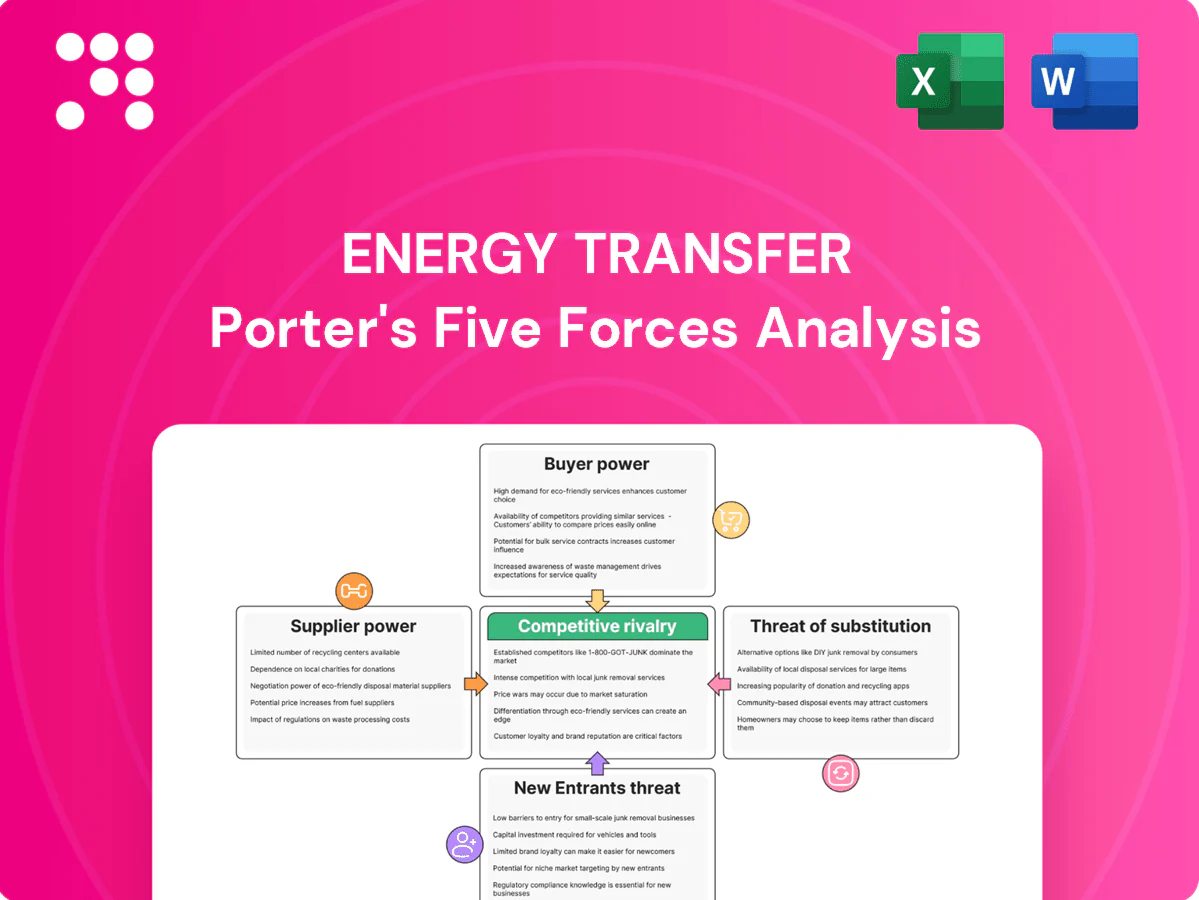
Energy Transfer Porter's Five Forces Analysis

A Must-Have Tool for Decision-Makers
Energy Transfer faces intense buyer power and regulatory scrutiny, while pipeline scale and long-term contracts limit supplier and new-entrant threats. Competitive rivalry is high among midstream operators, and substitution risks hinge on the pace of energy transition and LNG growth. This brief snapshot only scratches the surface—unlock the full Porter's Five Forces Analysis to explore force-by-force ratings, strategic implications, and actionable insights tailored to Energy Transfer.
Suppliers Bargaining Power

Upstream producer concentration
Energy Transfer sources volumes from large E&Ps and NGL producers that can negotiate favorable terms; in 2024 the Permian alone accounted for roughly 45% of US crude output, concentrating bargaining power among majors. When basin production is concentrated among a few companies, supplier leverage rises on fees and volume commitments. Diversified supply basins and counterparties dilute this power, and ETs long‑haul optionality plus >100,000 miles of pipeline interconnects reduce dependence on any single producer.
Commodity availability volatility
Supply swings from drilling cycles, associated gas and 2024 OPEC+ decisions materially shift throughput and supplier leverage, with 2024 OPEC+ cuts tightening liquids markets and U.S. gas remaining at near‑record production levels.
In oversupply producers prioritize takeaway and accept lower tariffs; in tight 2024 markets they negotiated firmer terms and premium capacity pricing.
ET’s multi‑basin footprint smooths regional cycles, while storage and blending services reduce volatility‑driven supplier bargaining power.

Specialized equipment and services
Compression, turbines, cryogenic units and frac towers largely come from limited OEMs such as Siemens Energy and GE Vernova, concentrating supply and creating lead times often up to 24 months in 2024. Vendor concentration and extended lead times raise input costs and schedule risk for Energy Transfer projects. Long-term framework agreements and strong in-house EPC expertise, plus scale purchasing, help secure priority allocation and mitigate supplier leverage.

Right-of-way and land access
Landowners and tribal authorities control critical easements, exerting leverage over costs and timelines for pipeline projects.
Scarce corridors for major routes raise bargaining power for key parcels, though ET’s ~120,000-mile pipeline network (2024) and existing easements lower need for new negotiations.
Regulatory compliance and proactive community engagement reduce holdout risk and delay exposure on capital projects.
- Control: landowners/tribes
- Scarcity: premium parcels
- Offset: ET ~120,000-mile corridors
- Mitigation: regulation & engagement
Labor and regulatory inputs
Skilled craft labor and environmental consultants are critical and scarce during peak build cycles; AGC reported 77% of contractors had hiring difficulty in 2023, driving wage inflation and higher bid costs. Wage pressures and tightened compliance raise supplier power, but Energy Transfer’s sizable 2024 growth capex guidance of about $5.5 billion and long-term contractor relationships help stabilize access; strong safety records and reliable schedules attract preferred vendors.
- Labor scarcity: AGC 2023 — 77% hiring difficulty
- 2024 ET capex guidance: ~$5.5 billion
- Wage/compliance = higher supplier leverage
- Safety + predictability = preferred vendor access
Suppliers hold moderate leverage amid Permian concentration and long OEM lead times
Suppliers exert moderate leverage: basin concentration (Permian ~45% of US crude output in 2024) and OEM/vendor concentration (Siemens/GE lead times up to 24 months) increase supplier power, while ET’s ~120,000 miles of pipeline and ~$5.5B 2024 capex guidance diversify counterparties and secure priority allocation. Landowners/tribes and skilled labor (AGC 2023 hiring difficulty 77%) remain localized power points.
| Metric | 2024 value |
|---|---|
| Permian share (US crude) | ~45% |
| Energy Transfer pipeline miles | ~120,000 |
| ET 2024 capex guidance | ~$5.5B |
| OEM lead times | up to 24 months |
| Contractor hiring difficulty (AGC 2023) | 77% |
What is included in the product
 Detailed Word Document
Porter’s Five Forces analysis for Energy Transfer reveals how supplier leverage, buyer power, regulatory barriers, rivalry among midstream peers, and threat of substitutes shape pricing, margins, and strategic resilience. It highlights emerging regulatory and renewable-energy risks, incumbent advantages from scale and infrastructure, and tactical areas to protect market share.

 Customizable Excel Spreadsheet
A concise one-sheet Porter’s Five Forces for Energy Transfer that maps supplier, buyer, entrant, substitute, and rivalry pressures — ideal for quick strategic decisions, slide-ready summaries, and adapting pressures as market conditions change.
Customers Bargaining Power

Large shippers and anchor customers
Refiners, utilities, petrochemical firms and supermajors — many with top-10 credit ratings and multi-year sourcing needs — wield scale and alternatives, pressuring tariffs. Energy Transfer’s ~120,000-mile integrated network and bundled midstream services enable tailored offerings and route optionality. Take-or-pay and minimum volume commitments, often covering 70–90% of contracted capacity, blunt buyer leverage.
Interconnect and route optionality
Multiple pipeline, rail and waterborne routes give buyers easy switching power if service or price disappoints; Energy Transfer’s network spans over 100,000 miles, increasing route optionality. Hubs like Mont Belvieu and Cushing, which move millions of barrels/days of crude and NGLs, intensify this optionality. ET’s connectivity to numerous markets raises customer stickiness, while value-added services (fractionation, storage, logistics) shift competition away from pure price.

Contract structures and terms
Fee-based, take-or-pay and deficiency-fee structures—typically 10–20 year take-or-pay terms—shift volume and price risk from Energy Transfer to buyers, locking in cash flows. Renewal windows are negotiation flashpoints where buyer leverage rises if markets soften, often compressing tariffs. Index-linked escalators, commonly tied to CPI, and explicit inflation adjustments protect ET margins. Term diversity staggers renegotiation risk across cohorts.

Quality, reliability, and ESG demands
Buyers increasingly demand low-incident operations, transparent emissions reporting, and high uptime, turning non-price factors into negotiation levers for sophisticated customers; ET’s scale, storage capacity, and redundant systems underpin reliability commitments and support long-term contracts. Emissions-reduction initiatives and methane-leak programs are critical to winning or retaining premium accounts in ESG-sensitive segments. Strong operational uptime and visible ESG metrics reduce buyer bargaining leverage.
- Reliability: scale and storage reduce outage risk
- ESG: emissions transparency as a procurement requirement
- Negotiation: non-price terms gaining leverage
- Commercial: ESG initiatives can secure premium contracts
Price sensitivity in low-margin segments
Marketers and smaller industrial shippers are highly price sensitive in ETs low-margin segments, switching quickly between pipelines and storage when spreads tighten; commodity cycles in 2024 amplified their bargaining leverage as spot volumes rose relative to contract volumes. ET mitigates this via standardized tariffs and available spot capacity, while core earnings stay anchored by investment-grade anchors under long-term firm contracts.
- Price elasticity: high among marketers/industrials
- Spot vs contract: 2024 spot volumes increased bargaining intensity
- Mitigation: standardized tariffs, spot capacity
- Stability: investment-grade, long-term anchors support core EBITDA
Integrated network and long take-or-pay contracts tip leverage
Large refiners/utilities exert scale-driven pressure, but ET’s ~120,000-mile integrated network and bundled services provide route optionality and tailored offers. Long-term fee-based contracts (typ. 10–20 years) and take-or-pay coverage (commonly 70–90% of capacity) blunt buyer power, though 2024 saw rising spot volumes that increased marketer leverage. ESG, uptime and value-added services shift negotiations beyond price.
| Metric | Value |
|---|---|
| Network length | ~120,000 miles |
| Take-or-pay coverage | 70–90% |
| Typical contract terms | 10–20 years |
| 2024 spot trend | spot volumes increased |
Preview Before You Purchase
Energy Transfer Porter's Five Forces Analysis
This Porter's Five Forces analysis of Energy Transfer offers a concise, actionable assessment of industry rivalry, supplier and buyer power, threat of entrants and substitutes; the preview you see is the exact document you'll receive immediately after purchase. It's fully formatted, ready for download and use—no placeholders or mockups. Instant access upon payment.

A Must-Have Tool for Decision-Makers
Energy Transfer faces intense buyer power and regulatory scrutiny, while pipeline scale and long-term contracts limit supplier and new-entrant threats. Competitive rivalry is high among midstream operators, and substitution risks hinge on the pace of energy transition and LNG growth. This brief snapshot only scratches the surface—unlock the full Porter's Five Forces Analysis to explore force-by-force ratings, strategic implications, and actionable insights tailored to Energy Transfer.
Suppliers Bargaining Power
Upstream producer concentration
Energy Transfer sources volumes from large E&Ps and NGL producers that can negotiate favorable terms; in 2024 the Permian alone accounted for roughly 45% of US crude output, concentrating bargaining power among majors. When basin production is concentrated among a few companies, supplier leverage rises on fees and volume commitments. Diversified supply basins and counterparties dilute this power, and ETs long‑haul optionality plus >100,000 miles of pipeline interconnects reduce dependence on any single producer.
Commodity availability volatility
Supply swings from drilling cycles, associated gas and 2024 OPEC+ decisions materially shift throughput and supplier leverage, with 2024 OPEC+ cuts tightening liquids markets and U.S. gas remaining at near‑record production levels.
In oversupply producers prioritize takeaway and accept lower tariffs; in tight 2024 markets they negotiated firmer terms and premium capacity pricing.
ET’s multi‑basin footprint smooths regional cycles, while storage and blending services reduce volatility‑driven supplier bargaining power.
Specialized equipment and services
Compression, turbines, cryogenic units and frac towers largely come from limited OEMs such as Siemens Energy and GE Vernova, concentrating supply and creating lead times often up to 24 months in 2024. Vendor concentration and extended lead times raise input costs and schedule risk for Energy Transfer projects. Long-term framework agreements and strong in-house EPC expertise, plus scale purchasing, help secure priority allocation and mitigate supplier leverage.
Right-of-way and land access
Landowners and tribal authorities control critical easements, exerting leverage over costs and timelines for pipeline projects.
Scarce corridors for major routes raise bargaining power for key parcels, though ET’s ~120,000-mile pipeline network (2024) and existing easements lower need for new negotiations.
Regulatory compliance and proactive community engagement reduce holdout risk and delay exposure on capital projects.
- Control: landowners/tribes
- Scarcity: premium parcels
- Offset: ET ~120,000-mile corridors
- Mitigation: regulation & engagement
Labor and regulatory inputs
Skilled craft labor and environmental consultants are critical and scarce during peak build cycles; AGC reported 77% of contractors had hiring difficulty in 2023, driving wage inflation and higher bid costs. Wage pressures and tightened compliance raise supplier power, but Energy Transfer’s sizable 2024 growth capex guidance of about $5.5 billion and long-term contractor relationships help stabilize access; strong safety records and reliable schedules attract preferred vendors.
- Labor scarcity: AGC 2023 — 77% hiring difficulty
- 2024 ET capex guidance: ~$5.5 billion
- Wage/compliance = higher supplier leverage
- Safety + predictability = preferred vendor access
Suppliers hold moderate leverage amid Permian concentration and long OEM lead times
Suppliers exert moderate leverage: basin concentration (Permian ~45% of US crude output in 2024) and OEM/vendor concentration (Siemens/GE lead times up to 24 months) increase supplier power, while ET’s ~120,000 miles of pipeline and ~$5.5B 2024 capex guidance diversify counterparties and secure priority allocation. Landowners/tribes and skilled labor (AGC 2023 hiring difficulty 77%) remain localized power points.
| Metric | 2024 value |
|---|---|
| Permian share (US crude) | ~45% |
| Energy Transfer pipeline miles | ~120,000 |
| ET 2024 capex guidance | ~$5.5B |
| OEM lead times | up to 24 months |
| Contractor hiring difficulty (AGC 2023) | 77% |
What is included in the product
Detailed Word Document
Porter’s Five Forces analysis for Energy Transfer reveals how supplier leverage, buyer power, regulatory barriers, rivalry among midstream peers, and threat of substitutes shape pricing, margins, and strategic resilience. It highlights emerging regulatory and renewable-energy risks, incumbent advantages from scale and infrastructure, and tactical areas to protect market share.
Customizable Excel Spreadsheet
A concise one-sheet Porter’s Five Forces for Energy Transfer that maps supplier, buyer, entrant, substitute, and rivalry pressures — ideal for quick strategic decisions, slide-ready summaries, and adapting pressures as market conditions change.
Customers Bargaining Power
Large shippers and anchor customers
Refiners, utilities, petrochemical firms and supermajors — many with top-10 credit ratings and multi-year sourcing needs — wield scale and alternatives, pressuring tariffs. Energy Transfer’s ~120,000-mile integrated network and bundled midstream services enable tailored offerings and route optionality. Take-or-pay and minimum volume commitments, often covering 70–90% of contracted capacity, blunt buyer leverage.
Interconnect and route optionality
Multiple pipeline, rail and waterborne routes give buyers easy switching power if service or price disappoints; Energy Transfer’s network spans over 100,000 miles, increasing route optionality. Hubs like Mont Belvieu and Cushing, which move millions of barrels/days of crude and NGLs, intensify this optionality. ET’s connectivity to numerous markets raises customer stickiness, while value-added services (fractionation, storage, logistics) shift competition away from pure price.
Contract structures and terms
Fee-based, take-or-pay and deficiency-fee structures—typically 10–20 year take-or-pay terms—shift volume and price risk from Energy Transfer to buyers, locking in cash flows. Renewal windows are negotiation flashpoints where buyer leverage rises if markets soften, often compressing tariffs. Index-linked escalators, commonly tied to CPI, and explicit inflation adjustments protect ET margins. Term diversity staggers renegotiation risk across cohorts.
Quality, reliability, and ESG demands
Buyers increasingly demand low-incident operations, transparent emissions reporting, and high uptime, turning non-price factors into negotiation levers for sophisticated customers; ET’s scale, storage capacity, and redundant systems underpin reliability commitments and support long-term contracts. Emissions-reduction initiatives and methane-leak programs are critical to winning or retaining premium accounts in ESG-sensitive segments. Strong operational uptime and visible ESG metrics reduce buyer bargaining leverage.
- Reliability: scale and storage reduce outage risk
- ESG: emissions transparency as a procurement requirement
- Negotiation: non-price terms gaining leverage
- Commercial: ESG initiatives can secure premium contracts
Price sensitivity in low-margin segments
Marketers and smaller industrial shippers are highly price sensitive in ETs low-margin segments, switching quickly between pipelines and storage when spreads tighten; commodity cycles in 2024 amplified their bargaining leverage as spot volumes rose relative to contract volumes. ET mitigates this via standardized tariffs and available spot capacity, while core earnings stay anchored by investment-grade anchors under long-term firm contracts.
- Price elasticity: high among marketers/industrials
- Spot vs contract: 2024 spot volumes increased bargaining intensity
- Mitigation: standardized tariffs, spot capacity
- Stability: investment-grade, long-term anchors support core EBITDA
Integrated network and long take-or-pay contracts tip leverage
Large refiners/utilities exert scale-driven pressure, but ET’s ~120,000-mile integrated network and bundled services provide route optionality and tailored offers. Long-term fee-based contracts (typ. 10–20 years) and take-or-pay coverage (commonly 70–90% of capacity) blunt buyer power, though 2024 saw rising spot volumes that increased marketer leverage. ESG, uptime and value-added services shift negotiations beyond price.
| Metric | Value |
|---|---|
| Network length | ~120,000 miles |
| Take-or-pay coverage | 70–90% |
| Typical contract terms | 10–20 years |
| 2024 spot trend | spot volumes increased |
Preview Before You Purchase
Energy Transfer Porter's Five Forces Analysis
This Porter's Five Forces analysis of Energy Transfer offers a concise, actionable assessment of industry rivalry, supplier and buyer power, threat of entrants and substitutes; the preview you see is the exact document you'll receive immediately after purchase. It's fully formatted, ready for download and use—no placeholders or mockups. Instant access upon payment.
Description
A Must-Have Tool for Decision-Makers
Energy Transfer faces intense buyer power and regulatory scrutiny, while pipeline scale and long-term contracts limit supplier and new-entrant threats. Competitive rivalry is high among midstream operators, and substitution risks hinge on the pace of energy transition and LNG growth. This brief snapshot only scratches the surface—unlock the full Porter's Five Forces Analysis to explore force-by-force ratings, strategic implications, and actionable insights tailored to Energy Transfer.
Suppliers Bargaining Power
Upstream producer concentration
Energy Transfer sources volumes from large E&Ps and NGL producers that can negotiate favorable terms; in 2024 the Permian alone accounted for roughly 45% of US crude output, concentrating bargaining power among majors. When basin production is concentrated among a few companies, supplier leverage rises on fees and volume commitments. Diversified supply basins and counterparties dilute this power, and ETs long‑haul optionality plus >100,000 miles of pipeline interconnects reduce dependence on any single producer.
Commodity availability volatility
Supply swings from drilling cycles, associated gas and 2024 OPEC+ decisions materially shift throughput and supplier leverage, with 2024 OPEC+ cuts tightening liquids markets and U.S. gas remaining at near‑record production levels.
In oversupply producers prioritize takeaway and accept lower tariffs; in tight 2024 markets they negotiated firmer terms and premium capacity pricing.
ET’s multi‑basin footprint smooths regional cycles, while storage and blending services reduce volatility‑driven supplier bargaining power.
Specialized equipment and services
Compression, turbines, cryogenic units and frac towers largely come from limited OEMs such as Siemens Energy and GE Vernova, concentrating supply and creating lead times often up to 24 months in 2024. Vendor concentration and extended lead times raise input costs and schedule risk for Energy Transfer projects. Long-term framework agreements and strong in-house EPC expertise, plus scale purchasing, help secure priority allocation and mitigate supplier leverage.
Right-of-way and land access
Landowners and tribal authorities control critical easements, exerting leverage over costs and timelines for pipeline projects.
Scarce corridors for major routes raise bargaining power for key parcels, though ET’s ~120,000-mile pipeline network (2024) and existing easements lower need for new negotiations.
Regulatory compliance and proactive community engagement reduce holdout risk and delay exposure on capital projects.
- Control: landowners/tribes
- Scarcity: premium parcels
- Offset: ET ~120,000-mile corridors
- Mitigation: regulation & engagement
Labor and regulatory inputs
Skilled craft labor and environmental consultants are critical and scarce during peak build cycles; AGC reported 77% of contractors had hiring difficulty in 2023, driving wage inflation and higher bid costs. Wage pressures and tightened compliance raise supplier power, but Energy Transfer’s sizable 2024 growth capex guidance of about $5.5 billion and long-term contractor relationships help stabilize access; strong safety records and reliable schedules attract preferred vendors.
- Labor scarcity: AGC 2023 — 77% hiring difficulty
- 2024 ET capex guidance: ~$5.5 billion
- Wage/compliance = higher supplier leverage
- Safety + predictability = preferred vendor access
Suppliers hold moderate leverage amid Permian concentration and long OEM lead times
Suppliers exert moderate leverage: basin concentration (Permian ~45% of US crude output in 2024) and OEM/vendor concentration (Siemens/GE lead times up to 24 months) increase supplier power, while ET’s ~120,000 miles of pipeline and ~$5.5B 2024 capex guidance diversify counterparties and secure priority allocation. Landowners/tribes and skilled labor (AGC 2023 hiring difficulty 77%) remain localized power points.
| Metric | 2024 value |
|---|---|
| Permian share (US crude) | ~45% |
| Energy Transfer pipeline miles | ~120,000 |
| ET 2024 capex guidance | ~$5.5B |
| OEM lead times | up to 24 months |
| Contractor hiring difficulty (AGC 2023) | 77% |
What is included in the product
Detailed Word Document
Porter’s Five Forces analysis for Energy Transfer reveals how supplier leverage, buyer power, regulatory barriers, rivalry among midstream peers, and threat of substitutes shape pricing, margins, and strategic resilience. It highlights emerging regulatory and renewable-energy risks, incumbent advantages from scale and infrastructure, and tactical areas to protect market share.
Customizable Excel Spreadsheet
A concise one-sheet Porter’s Five Forces for Energy Transfer that maps supplier, buyer, entrant, substitute, and rivalry pressures — ideal for quick strategic decisions, slide-ready summaries, and adapting pressures as market conditions change.
Customers Bargaining Power
Large shippers and anchor customers
Refiners, utilities, petrochemical firms and supermajors — many with top-10 credit ratings and multi-year sourcing needs — wield scale and alternatives, pressuring tariffs. Energy Transfer’s ~120,000-mile integrated network and bundled midstream services enable tailored offerings and route optionality. Take-or-pay and minimum volume commitments, often covering 70–90% of contracted capacity, blunt buyer leverage.
Interconnect and route optionality
Multiple pipeline, rail and waterborne routes give buyers easy switching power if service or price disappoints; Energy Transfer’s network spans over 100,000 miles, increasing route optionality. Hubs like Mont Belvieu and Cushing, which move millions of barrels/days of crude and NGLs, intensify this optionality. ET’s connectivity to numerous markets raises customer stickiness, while value-added services (fractionation, storage, logistics) shift competition away from pure price.
Contract structures and terms
Fee-based, take-or-pay and deficiency-fee structures—typically 10–20 year take-or-pay terms—shift volume and price risk from Energy Transfer to buyers, locking in cash flows. Renewal windows are negotiation flashpoints where buyer leverage rises if markets soften, often compressing tariffs. Index-linked escalators, commonly tied to CPI, and explicit inflation adjustments protect ET margins. Term diversity staggers renegotiation risk across cohorts.
Quality, reliability, and ESG demands
Buyers increasingly demand low-incident operations, transparent emissions reporting, and high uptime, turning non-price factors into negotiation levers for sophisticated customers; ET’s scale, storage capacity, and redundant systems underpin reliability commitments and support long-term contracts. Emissions-reduction initiatives and methane-leak programs are critical to winning or retaining premium accounts in ESG-sensitive segments. Strong operational uptime and visible ESG metrics reduce buyer bargaining leverage.
- Reliability: scale and storage reduce outage risk
- ESG: emissions transparency as a procurement requirement
- Negotiation: non-price terms gaining leverage
- Commercial: ESG initiatives can secure premium contracts
Price sensitivity in low-margin segments
Marketers and smaller industrial shippers are highly price sensitive in ETs low-margin segments, switching quickly between pipelines and storage when spreads tighten; commodity cycles in 2024 amplified their bargaining leverage as spot volumes rose relative to contract volumes. ET mitigates this via standardized tariffs and available spot capacity, while core earnings stay anchored by investment-grade anchors under long-term firm contracts.
- Price elasticity: high among marketers/industrials
- Spot vs contract: 2024 spot volumes increased bargaining intensity
- Mitigation: standardized tariffs, spot capacity
- Stability: investment-grade, long-term anchors support core EBITDA
Integrated network and long take-or-pay contracts tip leverage
Large refiners/utilities exert scale-driven pressure, but ET’s ~120,000-mile integrated network and bundled services provide route optionality and tailored offers. Long-term fee-based contracts (typ. 10–20 years) and take-or-pay coverage (commonly 70–90% of capacity) blunt buyer power, though 2024 saw rising spot volumes that increased marketer leverage. ESG, uptime and value-added services shift negotiations beyond price.
| Metric | Value |
|---|---|
| Network length | ~120,000 miles |
| Take-or-pay coverage | 70–90% |
| Typical contract terms | 10–20 years |
| 2024 spot trend | spot volumes increased |
Preview Before You Purchase
Energy Transfer Porter's Five Forces Analysis
This Porter's Five Forces analysis of Energy Transfer offers a concise, actionable assessment of industry rivalry, supplier and buyer power, threat of entrants and substitutes; the preview you see is the exact document you'll receive immediately after purchase. It's fully formatted, ready for download and use—no placeholders or mockups. Instant access upon payment.











