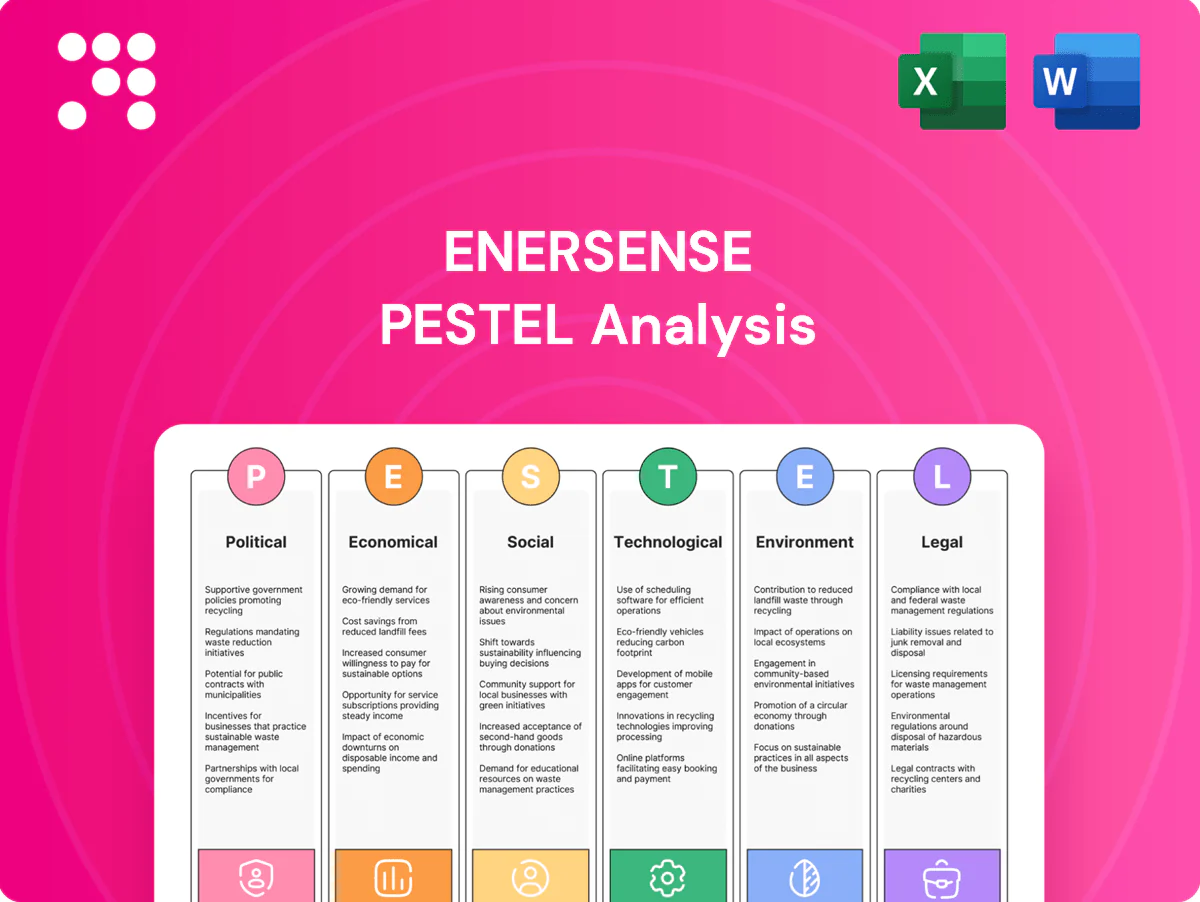
Enersense PESTLE Analysis

Your Competitive Advantage Starts with This Report
Our PESTLE analysis for Enersense reveals how political regulations, economic cycles, social trends, technological shifts, legal changes, and environmental pressures converge on the company’s strategy and risk profile. Actionable insights highlight growth levers and vulnerabilities—buy the full report to access detailed evidence, scenarios, and ready-to-use recommendations for investors and strategists.
Political factors

EU Green Deal and energy policy
EU Fit for 55 (55% GHG cut by 2030) and a 42.5% renewables target drive grid upgrades, renewables integration and electrification, supporting sustained demand for Enersense; ENTSO-E-style estimates imply c. €75–100bn/yr in grid investment to 2030. Policy stability and EU instruments (RRF ~€723bn) enable multi‑year project pipelines and financing. Election‑driven shifts can re‑prioritize spending; active monitoring and engagement mitigate tender timing risk.
Geopolitical security of supply
Regional push for energy security—EU target of 15% electricity interconnection by 2030 and a Connecting Europe Facility budget of €33.7bn (2021–27)—drives demand for transmission reinforcements and interconnectors. NATO/EU security priorities increase critical-infrastructure hardening and compliance costs. Geopolitical tensions raise equipment disruption risk and trade controls, making scenario planning and diversified sourcing essential to cut exposure.

Public procurement dynamics
Large grid and telecom projects are frequently publicly tendered, shaping margins and timeline certainty; public procurement in the EU represents about 14% of GDP (European Commission). Transparent, competitive bids favor cost control and documented ESG performance, increasingly required in tenders since 2023. Budget cycles and election calendars drive award cadence and can cluster opportunities. Strong references and local partnerships demonstrably raise win rates in regionally focused tenders.

Renewables siting and community acceptance
NIMBY politics increasingly delay permits for onshore wind, solar and grid corridors, with permitting often taking 3–5 years in Europe, raising execution risk and working capital needs for Enersense.
- Early stakeholder engagement and route optimization cut opposition and permit time
- Political support for repowering and offshore wind (Nordic pipeline >50 GW by 2030) opens specialist EPC opportunities
- Delays inflate carrying costs and contract risk
Industrial strategy and subsidies
- EU fund: €723.8bn
- H2 target: 40 GW by 2030
- Subsidies de-risk capex
- Portfolio balance mitigates pauses
EU funds, targets fuel €75–100bn/yr grid boom; permitting delays, geopolitics raise execution risk
EU Fit for 55, RRF €723.8bn and CEF €33.7bn underpin sustained grid/renewables demand; ENTSO-E estimates c. €75–100bn/yr grid spend to 2030. Energy security, 15% interconnection target and H2 40 GW by 2030 expand EPC scope; permitting delays (3–5 yrs) and geopolitics raise execution and supply risks.
| Metric | Value |
|---|---|
| Grid spend | €75–100bn/yr to 2030 |
| RRF | €723.8bn |
| CEF | €33.7bn (2021–27) |
| H2 target | 40 GW by 2030 |
| Permitting | 3–5 yrs |
What is included in the product
 Detailed Word Document
Explores how macro-environmental forces uniquely affect Enersense across Political, Economic, Social, Technological, Environmental and Legal dimensions, with data-driven insights and forward-looking scenarios to identify risks and opportunities for executives, investors and strategists.

 Customizable Excel Spreadsheet
A concise, visually segmented PESTLE summary for Enersense that simplifies external risk assessment and market positioning, easily dropped into presentations, annotated for local context, and quickly shared across teams for faster alignment.
Economic factors

Capex cycles in utilities and telecom
Regulated utilities capex and EU estimates of roughly 500 billion euros for gigabit/5G and grid upgrades to 2030 anchor demand visibility for Enersense, supporting multi-year project pipelines.
Slowdowns in operator spending or regulatory resets can defer orders and shift timing of revenues, though existing backlogs and framework agreements buffer short-term swings.
Strong execution discipline and project control are essential to protect margins across capex cycles and secure cashflow predictability.
Interest rates and financing costs
Higher market rates in 2024–25 pushed borrowing costs and implied WACC for asset owners up—Euribor/swap-driven yields and BBB spreads lifted effective cost of capital to roughly 5–7%, reprioritizing lower-return projects. Contract indexation (CPI/Euribor) helps offset input inflation; as easing expectations rise, deferred projects can re-accelerate. Tight cash-flow management remains critical across bid-to-build lags.

Commodity and equipment inflation
Copper, steel, cables and transformers have driven project cost inflation of roughly 8–15% and pushed transformer lead times to about 20–40 weeks in 2024–25, increasing schedule risk for Enersense. Escalation clauses and input-hedging programs have materially reduced exposure to raw-material swings. Tight supply has shifted pricing power toward contractors with capacity, while vendor diversification can shorten critical-path risks by up to ~30%.

Labor market and productivity
Skilled electricians, linemen and fiber technicians remain scarce across the Nordics and EU, driving wage inflation that rose roughly 4–6% in Nordic construction roles in 2023–24 and squeezing fixed-price contracts without indexation.
Training, cross-skilling and digital tools (site planning, AR, workforce management) have lifted on-site productivity by low double digits in pilot programs, while selective bidding preserves unit economics and margins.
- Labor scarcity: high demand vs limited supply
- Wage pressure: ~4–6% regional rise (2023–24)
- Productivity: digital/training gains ~10%+
- Strategy: selective bidding to protect margins
Currency and regional mix
Enersense faces EUR/NOK/SEK swings that affect contract revenues and local costs; EUR/NOK fluctuated roughly between 9.5 and 12.0 during 2024–H1 2025, increasing FX impact on margins. Local sourcing and on-site staffing create natural hedges that lower volatility across projects. Project mix across Nordics, Baltics and EU materially shifts gross margins, while treasury aligns hedging and liquidity to contract currencies.
- FX exposure: EUR/NOK ~9.5–12.0 (2024–H1 2025)
- Natural hedge: local sourcing reduces cost volatility
- Geographic mix: Nordics/Baltics/EU drives margin profile
- Treasury: hedging and contract-currency alignment
EU funds, targets fuel €75–100bn/yr grid boom; permitting delays, geopolitics raise execution risk
Regulated utility capex (EU ~500bn to 2030) and telco/grid upgrades underpin multi-year demand; backlogs/frameworks buffer short-term shocks. Higher market rates raised effective WACC to ~5–7% (2024–25), reprioritizing lower-return projects. Material inflation +8–15% and 20–40wk transformer lead times increase schedule risk; wage inflation ~4–6% strains margins.
| Metric | 2024–25 |
|---|---|
| EU capex to 2030 | ~€500bn |
| WACC | ~5–7% |
| Material inflation | 8–15% |
| Transformer lead time | 20–40 wks |
| Wage rise | 4–6% |
| EUR/NOK | 9.5–12.0 (2024–H1 2025) |
Preview the Actual Deliverable
Enersense PESTLE Analysis
The Enersense PESTLE Analysis preview shown here is the exact document you’ll receive after purchase—fully formatted and ready to use. This is the real file you’re buying, delivered exactly as displayed with no placeholders or teasers. The layout, content, and structure visible here are what you’ll download immediately after payment.

Your Competitive Advantage Starts with This Report
Our PESTLE analysis for Enersense reveals how political regulations, economic cycles, social trends, technological shifts, legal changes, and environmental pressures converge on the company’s strategy and risk profile. Actionable insights highlight growth levers and vulnerabilities—buy the full report to access detailed evidence, scenarios, and ready-to-use recommendations for investors and strategists.
Political factors
EU Green Deal and energy policy
EU Fit for 55 (55% GHG cut by 2030) and a 42.5% renewables target drive grid upgrades, renewables integration and electrification, supporting sustained demand for Enersense; ENTSO-E-style estimates imply c. €75–100bn/yr in grid investment to 2030. Policy stability and EU instruments (RRF ~€723bn) enable multi‑year project pipelines and financing. Election‑driven shifts can re‑prioritize spending; active monitoring and engagement mitigate tender timing risk.
Geopolitical security of supply
Regional push for energy security—EU target of 15% electricity interconnection by 2030 and a Connecting Europe Facility budget of €33.7bn (2021–27)—drives demand for transmission reinforcements and interconnectors. NATO/EU security priorities increase critical-infrastructure hardening and compliance costs. Geopolitical tensions raise equipment disruption risk and trade controls, making scenario planning and diversified sourcing essential to cut exposure.
Public procurement dynamics
Large grid and telecom projects are frequently publicly tendered, shaping margins and timeline certainty; public procurement in the EU represents about 14% of GDP (European Commission). Transparent, competitive bids favor cost control and documented ESG performance, increasingly required in tenders since 2023. Budget cycles and election calendars drive award cadence and can cluster opportunities. Strong references and local partnerships demonstrably raise win rates in regionally focused tenders.
Renewables siting and community acceptance
NIMBY politics increasingly delay permits for onshore wind, solar and grid corridors, with permitting often taking 3–5 years in Europe, raising execution risk and working capital needs for Enersense.
- Early stakeholder engagement and route optimization cut opposition and permit time
- Political support for repowering and offshore wind (Nordic pipeline >50 GW by 2030) opens specialist EPC opportunities
- Delays inflate carrying costs and contract risk
Industrial strategy and subsidies
- EU fund: €723.8bn
- H2 target: 40 GW by 2030
- Subsidies de-risk capex
- Portfolio balance mitigates pauses
EU funds, targets fuel €75–100bn/yr grid boom; permitting delays, geopolitics raise execution risk
EU Fit for 55, RRF €723.8bn and CEF €33.7bn underpin sustained grid/renewables demand; ENTSO-E estimates c. €75–100bn/yr grid spend to 2030. Energy security, 15% interconnection target and H2 40 GW by 2030 expand EPC scope; permitting delays (3–5 yrs) and geopolitics raise execution and supply risks.
| Metric | Value |
|---|---|
| Grid spend | €75–100bn/yr to 2030 |
| RRF | €723.8bn |
| CEF | €33.7bn (2021–27) |
| H2 target | 40 GW by 2030 |
| Permitting | 3–5 yrs |
What is included in the product
Detailed Word Document
Explores how macro-environmental forces uniquely affect Enersense across Political, Economic, Social, Technological, Environmental and Legal dimensions, with data-driven insights and forward-looking scenarios to identify risks and opportunities for executives, investors and strategists.
Customizable Excel Spreadsheet
A concise, visually segmented PESTLE summary for Enersense that simplifies external risk assessment and market positioning, easily dropped into presentations, annotated for local context, and quickly shared across teams for faster alignment.
Economic factors
Capex cycles in utilities and telecom
Regulated utilities capex and EU estimates of roughly 500 billion euros for gigabit/5G and grid upgrades to 2030 anchor demand visibility for Enersense, supporting multi-year project pipelines.
Slowdowns in operator spending or regulatory resets can defer orders and shift timing of revenues, though existing backlogs and framework agreements buffer short-term swings.
Strong execution discipline and project control are essential to protect margins across capex cycles and secure cashflow predictability.
Interest rates and financing costs
Higher market rates in 2024–25 pushed borrowing costs and implied WACC for asset owners up—Euribor/swap-driven yields and BBB spreads lifted effective cost of capital to roughly 5–7%, reprioritizing lower-return projects. Contract indexation (CPI/Euribor) helps offset input inflation; as easing expectations rise, deferred projects can re-accelerate. Tight cash-flow management remains critical across bid-to-build lags.
Commodity and equipment inflation
Copper, steel, cables and transformers have driven project cost inflation of roughly 8–15% and pushed transformer lead times to about 20–40 weeks in 2024–25, increasing schedule risk for Enersense. Escalation clauses and input-hedging programs have materially reduced exposure to raw-material swings. Tight supply has shifted pricing power toward contractors with capacity, while vendor diversification can shorten critical-path risks by up to ~30%.
Labor market and productivity
Skilled electricians, linemen and fiber technicians remain scarce across the Nordics and EU, driving wage inflation that rose roughly 4–6% in Nordic construction roles in 2023–24 and squeezing fixed-price contracts without indexation.
Training, cross-skilling and digital tools (site planning, AR, workforce management) have lifted on-site productivity by low double digits in pilot programs, while selective bidding preserves unit economics and margins.
- Labor scarcity: high demand vs limited supply
- Wage pressure: ~4–6% regional rise (2023–24)
- Productivity: digital/training gains ~10%+
- Strategy: selective bidding to protect margins
Currency and regional mix
Enersense faces EUR/NOK/SEK swings that affect contract revenues and local costs; EUR/NOK fluctuated roughly between 9.5 and 12.0 during 2024–H1 2025, increasing FX impact on margins. Local sourcing and on-site staffing create natural hedges that lower volatility across projects. Project mix across Nordics, Baltics and EU materially shifts gross margins, while treasury aligns hedging and liquidity to contract currencies.
- FX exposure: EUR/NOK ~9.5–12.0 (2024–H1 2025)
- Natural hedge: local sourcing reduces cost volatility
- Geographic mix: Nordics/Baltics/EU drives margin profile
- Treasury: hedging and contract-currency alignment
EU funds, targets fuel €75–100bn/yr grid boom; permitting delays, geopolitics raise execution risk
Regulated utility capex (EU ~500bn to 2030) and telco/grid upgrades underpin multi-year demand; backlogs/frameworks buffer short-term shocks. Higher market rates raised effective WACC to ~5–7% (2024–25), reprioritizing lower-return projects. Material inflation +8–15% and 20–40wk transformer lead times increase schedule risk; wage inflation ~4–6% strains margins.
| Metric | 2024–25 |
|---|---|
| EU capex to 2030 | ~€500bn |
| WACC | ~5–7% |
| Material inflation | 8–15% |
| Transformer lead time | 20–40 wks |
| Wage rise | 4–6% |
| EUR/NOK | 9.5–12.0 (2024–H1 2025) |
Preview the Actual Deliverable
Enersense PESTLE Analysis
The Enersense PESTLE Analysis preview shown here is the exact document you’ll receive after purchase—fully formatted and ready to use. This is the real file you’re buying, delivered exactly as displayed with no placeholders or teasers. The layout, content, and structure visible here are what you’ll download immediately after payment.
Original: $10.00
-65%$10.00
$3.50Description
Your Competitive Advantage Starts with This Report
Our PESTLE analysis for Enersense reveals how political regulations, economic cycles, social trends, technological shifts, legal changes, and environmental pressures converge on the company’s strategy and risk profile. Actionable insights highlight growth levers and vulnerabilities—buy the full report to access detailed evidence, scenarios, and ready-to-use recommendations for investors and strategists.
Political factors
EU Green Deal and energy policy
EU Fit for 55 (55% GHG cut by 2030) and a 42.5% renewables target drive grid upgrades, renewables integration and electrification, supporting sustained demand for Enersense; ENTSO-E-style estimates imply c. €75–100bn/yr in grid investment to 2030. Policy stability and EU instruments (RRF ~€723bn) enable multi‑year project pipelines and financing. Election‑driven shifts can re‑prioritize spending; active monitoring and engagement mitigate tender timing risk.
Geopolitical security of supply
Regional push for energy security—EU target of 15% electricity interconnection by 2030 and a Connecting Europe Facility budget of €33.7bn (2021–27)—drives demand for transmission reinforcements and interconnectors. NATO/EU security priorities increase critical-infrastructure hardening and compliance costs. Geopolitical tensions raise equipment disruption risk and trade controls, making scenario planning and diversified sourcing essential to cut exposure.
Public procurement dynamics
Large grid and telecom projects are frequently publicly tendered, shaping margins and timeline certainty; public procurement in the EU represents about 14% of GDP (European Commission). Transparent, competitive bids favor cost control and documented ESG performance, increasingly required in tenders since 2023. Budget cycles and election calendars drive award cadence and can cluster opportunities. Strong references and local partnerships demonstrably raise win rates in regionally focused tenders.
Renewables siting and community acceptance
NIMBY politics increasingly delay permits for onshore wind, solar and grid corridors, with permitting often taking 3–5 years in Europe, raising execution risk and working capital needs for Enersense.
- Early stakeholder engagement and route optimization cut opposition and permit time
- Political support for repowering and offshore wind (Nordic pipeline >50 GW by 2030) opens specialist EPC opportunities
- Delays inflate carrying costs and contract risk
Industrial strategy and subsidies
- EU fund: €723.8bn
- H2 target: 40 GW by 2030
- Subsidies de-risk capex
- Portfolio balance mitigates pauses
EU funds, targets fuel €75–100bn/yr grid boom; permitting delays, geopolitics raise execution risk
EU Fit for 55, RRF €723.8bn and CEF €33.7bn underpin sustained grid/renewables demand; ENTSO-E estimates c. €75–100bn/yr grid spend to 2030. Energy security, 15% interconnection target and H2 40 GW by 2030 expand EPC scope; permitting delays (3–5 yrs) and geopolitics raise execution and supply risks.
| Metric | Value |
|---|---|
| Grid spend | €75–100bn/yr to 2030 |
| RRF | €723.8bn |
| CEF | €33.7bn (2021–27) |
| H2 target | 40 GW by 2030 |
| Permitting | 3–5 yrs |
What is included in the product
Detailed Word Document
Explores how macro-environmental forces uniquely affect Enersense across Political, Economic, Social, Technological, Environmental and Legal dimensions, with data-driven insights and forward-looking scenarios to identify risks and opportunities for executives, investors and strategists.
Customizable Excel Spreadsheet
A concise, visually segmented PESTLE summary for Enersense that simplifies external risk assessment and market positioning, easily dropped into presentations, annotated for local context, and quickly shared across teams for faster alignment.
Economic factors
Capex cycles in utilities and telecom
Regulated utilities capex and EU estimates of roughly 500 billion euros for gigabit/5G and grid upgrades to 2030 anchor demand visibility for Enersense, supporting multi-year project pipelines.
Slowdowns in operator spending or regulatory resets can defer orders and shift timing of revenues, though existing backlogs and framework agreements buffer short-term swings.
Strong execution discipline and project control are essential to protect margins across capex cycles and secure cashflow predictability.
Interest rates and financing costs
Higher market rates in 2024–25 pushed borrowing costs and implied WACC for asset owners up—Euribor/swap-driven yields and BBB spreads lifted effective cost of capital to roughly 5–7%, reprioritizing lower-return projects. Contract indexation (CPI/Euribor) helps offset input inflation; as easing expectations rise, deferred projects can re-accelerate. Tight cash-flow management remains critical across bid-to-build lags.
Commodity and equipment inflation
Copper, steel, cables and transformers have driven project cost inflation of roughly 8–15% and pushed transformer lead times to about 20–40 weeks in 2024–25, increasing schedule risk for Enersense. Escalation clauses and input-hedging programs have materially reduced exposure to raw-material swings. Tight supply has shifted pricing power toward contractors with capacity, while vendor diversification can shorten critical-path risks by up to ~30%.
Labor market and productivity
Skilled electricians, linemen and fiber technicians remain scarce across the Nordics and EU, driving wage inflation that rose roughly 4–6% in Nordic construction roles in 2023–24 and squeezing fixed-price contracts without indexation.
Training, cross-skilling and digital tools (site planning, AR, workforce management) have lifted on-site productivity by low double digits in pilot programs, while selective bidding preserves unit economics and margins.
- Labor scarcity: high demand vs limited supply
- Wage pressure: ~4–6% regional rise (2023–24)
- Productivity: digital/training gains ~10%+
- Strategy: selective bidding to protect margins
Currency and regional mix
Enersense faces EUR/NOK/SEK swings that affect contract revenues and local costs; EUR/NOK fluctuated roughly between 9.5 and 12.0 during 2024–H1 2025, increasing FX impact on margins. Local sourcing and on-site staffing create natural hedges that lower volatility across projects. Project mix across Nordics, Baltics and EU materially shifts gross margins, while treasury aligns hedging and liquidity to contract currencies.
- FX exposure: EUR/NOK ~9.5–12.0 (2024–H1 2025)
- Natural hedge: local sourcing reduces cost volatility
- Geographic mix: Nordics/Baltics/EU drives margin profile
- Treasury: hedging and contract-currency alignment
EU funds, targets fuel €75–100bn/yr grid boom; permitting delays, geopolitics raise execution risk
Regulated utility capex (EU ~500bn to 2030) and telco/grid upgrades underpin multi-year demand; backlogs/frameworks buffer short-term shocks. Higher market rates raised effective WACC to ~5–7% (2024–25), reprioritizing lower-return projects. Material inflation +8–15% and 20–40wk transformer lead times increase schedule risk; wage inflation ~4–6% strains margins.
| Metric | 2024–25 |
|---|---|
| EU capex to 2030 | ~€500bn |
| WACC | ~5–7% |
| Material inflation | 8–15% |
| Transformer lead time | 20–40 wks |
| Wage rise | 4–6% |
| EUR/NOK | 9.5–12.0 (2024–H1 2025) |
Preview the Actual Deliverable
Enersense PESTLE Analysis
The Enersense PESTLE Analysis preview shown here is the exact document you’ll receive after purchase—fully formatted and ready to use. This is the real file you’re buying, delivered exactly as displayed with no placeholders or teasers. The layout, content, and structure visible here are what you’ll download immediately after payment.











