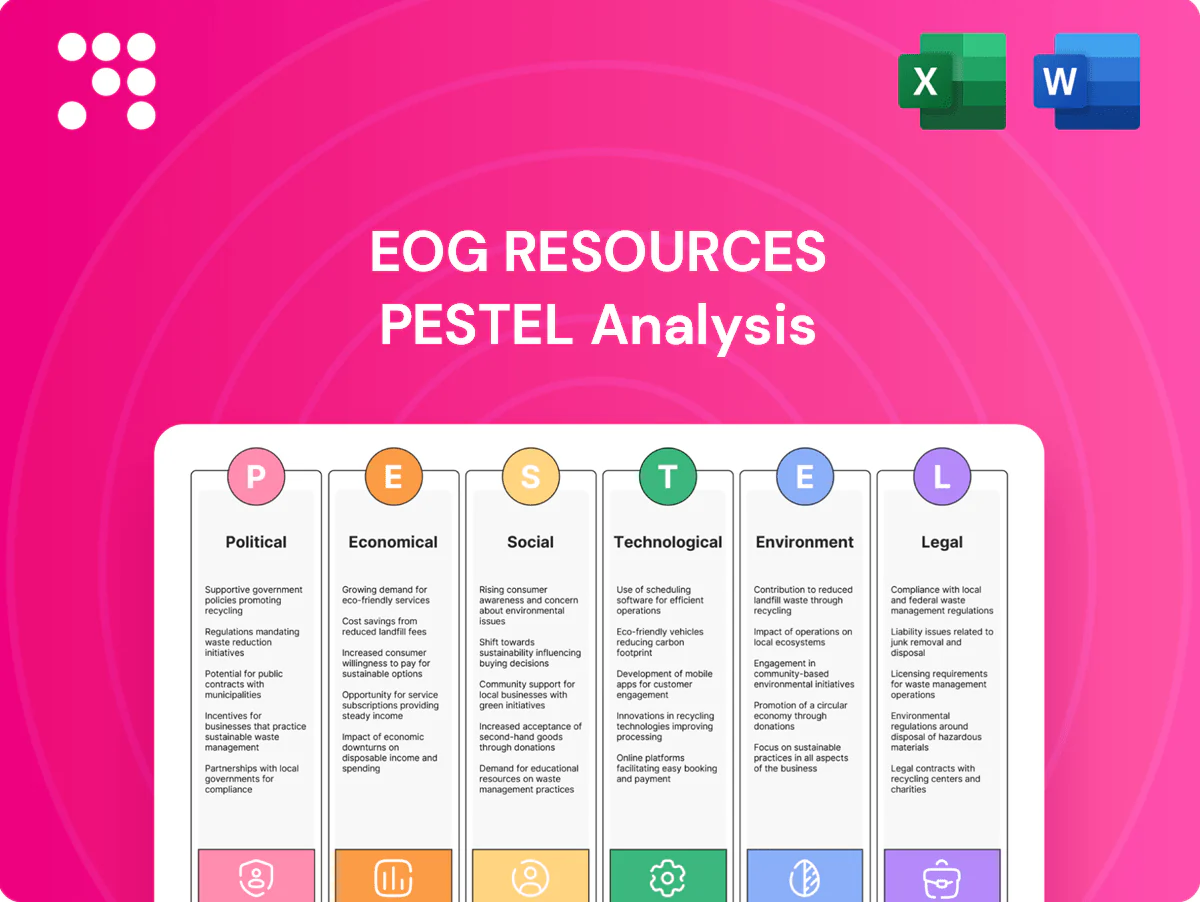
EOG Resources PESTLE Analysis

Plan Smarter. Present Sharper. Compete Stronger.
Our PESTLE Analysis of EOG Resources reveals how political shifts, energy markets, technological advances, and environmental regulations converge to shape its strategic outlook. Ideal for investors and strategists, this concise report highlights risks and opportunities you can act on today. Buy the full analysis to access the complete, ready-to-use insights instantly.
Political factors

Federal energy policy
Shifts in federal energy policy reshape leasing, permitting and emissions rules that directly affect EOG’s cost base and project timelines amid U.S. crude output near 13.5 mb/d in 2024. Changes between administrations can accelerate or restrict development on federal and mixed-mineral acreage, altering reserve access and schedule risk. Incentives such as the enhanced 45Q credit (up to $85/ton for CO2) steer capital toward lower‑carbon tech and CCUS. Federal infrastructure priorities — including pipeline and LNG export capacity (~12 Bcf/d) — influence takeaway capacity and market access for EOG.
State-level regulation
State regimes in Texas, New Mexico and North Dakota — where EOG's Permian and Bakken activity is concentrated — set drilling, flaring and water rules that shape operating practices; Texas crude output was ~5.9 mbd in 2023, New Mexico ~1.3 mbd and North Dakota ~1.1 mbd (EIA).
Variability across states creates compliance complexity and basin cost differentials; state commissions have tightened methane and seismicity controls, delaying permits and shifting production schedules.
Local permitting and setback rules constrain pad placement and cadence, raising per-well development costs and capital timing risk.

Permitting timelines
NEPA reviews (often 1–5 years), air permits (commonly 6–12 months) and rights‑of‑way approvals on federal/tribal lands (frequently >18 months) can materially delay projects; regulatory tightening or streamlining shifts these cycle times. EOG’s ability to execute multi‑year drilling hinges on predictable approvals; its ~2024 capex (~$2.2B) and schedules face higher non‑productive time and working capital needs if backlogs persist.

Trade and tariffs
Tariffs such as the US 25% Section 232 steel tariff raise costs for steel, OCTG and drilling equipment, squeezing well economics and raising per‑well costs for EOG. Geopolitical tensions disrupt supply chains for specialty components and can delay rigs and completions. Trade policy and currency swings affect NGL export arbitrage and pricing, impacting realized margins.
- 25% US steel tariff increases capex per well
- OCTG duties and geopolitical risk disrupt timelines
- Currency/trade policy alters NGL export spreads
- Stable trade flows support sourcing and scheduling
Election cycles
National and state elections in 2024 can reset priorities on climate, leasing, and infrastructure, creating regulatory swings that affect EOG Resources’ asset economics. Policy uncertainty ahead of elections often defers drilling and midstream investment; IEA 2024 highlighted increased capital allocation volatility in energy markets. Post-election regulatory shifts may re-rate basin attractiveness, so EOG must keep flexibility to pivot capital among plays.
- 2024 election-driven policy risk: higher near-term uncertainty
- Investment deferral: documented volatility per IEA 2024
- Operational response: maintain capital mobility across basins
45Q, NEPA delays and state rules reshape US oil, CCUS and capex amid tariffs, LNG buildout
Federal policy shifts (U.S. crude ~13.5 mb/d in 2024) and 45Q credits up to $85/ton reshape EOG’s permitting, CCUS and capex decisions; 2024 capex ~ $2.2B faces NEPA/air permit delays (months–years). State rules in TX (crude ~5.9 mb/d), NM (~1.3 mbd) and ND (~1.1 mbd) drive drilling, flaring and methane costs. Trade tariffs (25% steel) and ~12 Bcf/d LNG capacity affect equipment costs and market access.
| Metric | Value |
|---|---|
| US crude 2024 | ~13.5 mb/d |
| TX/NM/ND output | 5.9 / 1.3 / 1.1 mbd |
| EOG 2024 capex | ~$2.2B |
| 45Q credit | up to $85/ton |
| Steel tariff | 25% |
What is included in the product
 Detailed Word Document
Explores how Political, Economic, Social, Technological, Environmental and Legal forces uniquely impact EOG Resources, with data-backed trends, sector-specific examples and forward-looking insights to help executives, investors and strategists identify risks, opportunities and inform scenario-driven planning.

 Customizable Excel Spreadsheet
A concise, visually segmented PESTLE summary for EOG Resources that streamlines external risk discussions, is easily dropped into presentations or shared across teams, and allows quick note edits to tailor insights by region or business line during planning sessions.
Economic factors

Oil and gas price volatility
WTI at ~75 USD/bbl, Henry Hub near 3.0 USD/MMBtu and Mont Belvieu NGL blend around 30 USD/bbl in mid‑2025 drive EOG cash flows, returns and drilling intensity. Volatile price swings shift PDP valuations and prompt dynamic hedging program adjustments. Basin‑specific differentials change realized pricing and capital allocation; prolonged lows compress margins while sustained highs strain service capacity.
Service cost inflation
Rigs, frac spreads, sand and labor cycles drove well costs higher—U.S. rig counts and frac-spread tightness in 2022–23 pushed completion costs up roughly 20–30% versus pre-pandemic levels, elongating paybacks. Tight markets raised dayrates and completion expenses, compressing IRRs for EOG and peers. By 2024 supply normalization and easing sand prices began restoring margins and capital efficiency. Aggressive contracting strategies and strong vendor relationships remain key mitigants.

Pipeline and takeaway capacity
Takeaway constraints have pushed Midland/WTI basis differentials into the roughly 10–15 USD/bbl range at times, raising trucking and flaring mitigation costs. Additions like Gray Oak (900 kb/d) and Cactus II (585 kb/d) have lowered differentials and stabilized realizations. Timing of midstream builds still dictates E&P pacing, while EOG’s marketing and firm-transport contracts help optimize netbacks.

Capital markets and discipline
Investor emphasis on free cash flow and returns constrains EOG Resources from overexpansion; cost of capital, buybacks, and dividends drive disciplined capital allocation and prioritize shareholder returns over acreage growth.
Credit conditions influence liquidity for acreage, infrastructure, and technology spending, while EOG’s strong balance sheet enables counter-cyclical investments when markets soften.
- Focus: free cash flow discipline
- Allocation drivers: cost of capital, buybacks, dividends
- Liquidity risk: credit conditions affect CAPEX on acreage/infrastructure
- Opportunity: strong balance sheet supports counter-cyclical buys
LNG and petrochem demand
- US LNG capacity ~95 mtpa (end-2024)
- US ethylene/cracker capacity ~50 mtpa (2024)
- Export growth reduced regional oversupply and basis pressure
- Contracting optionality improved marketing; delays pose downside risk
45Q, NEPA delays and state rules reshape US oil, CCUS and capex amid tariffs, LNG buildout
WTI ~75 USD/bbl (mid‑2025), Henry Hub ~3 USD/MMBtu and NGLs ~30 USD/bbl underpin EOG cash flows; 2022–23 completion cost inflation (~20–30%) lengthened paybacks but 2024–25 normalization restored margins. Midland basis often 10–15 USD/bbl; Gray Oak/Cactus II cut differentials. US LNG ~95 mtpa (end‑2024) and US ethylene ~50 Mtpa (2024) tightened regional supply; strong FCF/low leverage enforces capital discipline.
| Metric | Value |
|---|---|
| WTI (mid‑2025) | ~75 USD/bbl |
| Henry Hub | ~3 USD/MMBtu |
| NGL blend | ~30 USD/bbl |
| Midland basis | 10–15 USD/bbl |
| Completion cost change (2022–23) | +20–30% |
| US LNG capacity (end‑2024) | ~95 mtpa |
| US ethylene (2024) | ~50 Mtpa |
Same Document Delivered
EOG Resources PESTLE Analysis
The preview shown here is the exact document you’ll receive after purchase—fully formatted and ready to use. This EOG Resources PESTLE Analysis delivers the same structured insights, data and layout as the downloadable file. No placeholders or changes; what you see is the final product ready for immediate use.

Plan Smarter. Present Sharper. Compete Stronger.
Our PESTLE Analysis of EOG Resources reveals how political shifts, energy markets, technological advances, and environmental regulations converge to shape its strategic outlook. Ideal for investors and strategists, this concise report highlights risks and opportunities you can act on today. Buy the full analysis to access the complete, ready-to-use insights instantly.
Political factors
Federal energy policy
Shifts in federal energy policy reshape leasing, permitting and emissions rules that directly affect EOG’s cost base and project timelines amid U.S. crude output near 13.5 mb/d in 2024. Changes between administrations can accelerate or restrict development on federal and mixed-mineral acreage, altering reserve access and schedule risk. Incentives such as the enhanced 45Q credit (up to $85/ton for CO2) steer capital toward lower‑carbon tech and CCUS. Federal infrastructure priorities — including pipeline and LNG export capacity (~12 Bcf/d) — influence takeaway capacity and market access for EOG.
State-level regulation
State regimes in Texas, New Mexico and North Dakota — where EOG's Permian and Bakken activity is concentrated — set drilling, flaring and water rules that shape operating practices; Texas crude output was ~5.9 mbd in 2023, New Mexico ~1.3 mbd and North Dakota ~1.1 mbd (EIA).
Variability across states creates compliance complexity and basin cost differentials; state commissions have tightened methane and seismicity controls, delaying permits and shifting production schedules.
Local permitting and setback rules constrain pad placement and cadence, raising per-well development costs and capital timing risk.
Permitting timelines
NEPA reviews (often 1–5 years), air permits (commonly 6–12 months) and rights‑of‑way approvals on federal/tribal lands (frequently >18 months) can materially delay projects; regulatory tightening or streamlining shifts these cycle times. EOG’s ability to execute multi‑year drilling hinges on predictable approvals; its ~2024 capex (~$2.2B) and schedules face higher non‑productive time and working capital needs if backlogs persist.
Trade and tariffs
Tariffs such as the US 25% Section 232 steel tariff raise costs for steel, OCTG and drilling equipment, squeezing well economics and raising per‑well costs for EOG. Geopolitical tensions disrupt supply chains for specialty components and can delay rigs and completions. Trade policy and currency swings affect NGL export arbitrage and pricing, impacting realized margins.
- 25% US steel tariff increases capex per well
- OCTG duties and geopolitical risk disrupt timelines
- Currency/trade policy alters NGL export spreads
- Stable trade flows support sourcing and scheduling
Election cycles
National and state elections in 2024 can reset priorities on climate, leasing, and infrastructure, creating regulatory swings that affect EOG Resources’ asset economics. Policy uncertainty ahead of elections often defers drilling and midstream investment; IEA 2024 highlighted increased capital allocation volatility in energy markets. Post-election regulatory shifts may re-rate basin attractiveness, so EOG must keep flexibility to pivot capital among plays.
- 2024 election-driven policy risk: higher near-term uncertainty
- Investment deferral: documented volatility per IEA 2024
- Operational response: maintain capital mobility across basins
45Q, NEPA delays and state rules reshape US oil, CCUS and capex amid tariffs, LNG buildout
Federal policy shifts (U.S. crude ~13.5 mb/d in 2024) and 45Q credits up to $85/ton reshape EOG’s permitting, CCUS and capex decisions; 2024 capex ~ $2.2B faces NEPA/air permit delays (months–years). State rules in TX (crude ~5.9 mb/d), NM (~1.3 mbd) and ND (~1.1 mbd) drive drilling, flaring and methane costs. Trade tariffs (25% steel) and ~12 Bcf/d LNG capacity affect equipment costs and market access.
| Metric | Value |
|---|---|
| US crude 2024 | ~13.5 mb/d |
| TX/NM/ND output | 5.9 / 1.3 / 1.1 mbd |
| EOG 2024 capex | ~$2.2B |
| 45Q credit | up to $85/ton |
| Steel tariff | 25% |
What is included in the product
Detailed Word Document
Explores how Political, Economic, Social, Technological, Environmental and Legal forces uniquely impact EOG Resources, with data-backed trends, sector-specific examples and forward-looking insights to help executives, investors and strategists identify risks, opportunities and inform scenario-driven planning.
Customizable Excel Spreadsheet
A concise, visually segmented PESTLE summary for EOG Resources that streamlines external risk discussions, is easily dropped into presentations or shared across teams, and allows quick note edits to tailor insights by region or business line during planning sessions.
Economic factors
Oil and gas price volatility
WTI at ~75 USD/bbl, Henry Hub near 3.0 USD/MMBtu and Mont Belvieu NGL blend around 30 USD/bbl in mid‑2025 drive EOG cash flows, returns and drilling intensity. Volatile price swings shift PDP valuations and prompt dynamic hedging program adjustments. Basin‑specific differentials change realized pricing and capital allocation; prolonged lows compress margins while sustained highs strain service capacity.
Service cost inflation
Rigs, frac spreads, sand and labor cycles drove well costs higher—U.S. rig counts and frac-spread tightness in 2022–23 pushed completion costs up roughly 20–30% versus pre-pandemic levels, elongating paybacks. Tight markets raised dayrates and completion expenses, compressing IRRs for EOG and peers. By 2024 supply normalization and easing sand prices began restoring margins and capital efficiency. Aggressive contracting strategies and strong vendor relationships remain key mitigants.
Pipeline and takeaway capacity
Takeaway constraints have pushed Midland/WTI basis differentials into the roughly 10–15 USD/bbl range at times, raising trucking and flaring mitigation costs. Additions like Gray Oak (900 kb/d) and Cactus II (585 kb/d) have lowered differentials and stabilized realizations. Timing of midstream builds still dictates E&P pacing, while EOG’s marketing and firm-transport contracts help optimize netbacks.
Capital markets and discipline
Investor emphasis on free cash flow and returns constrains EOG Resources from overexpansion; cost of capital, buybacks, and dividends drive disciplined capital allocation and prioritize shareholder returns over acreage growth.
Credit conditions influence liquidity for acreage, infrastructure, and technology spending, while EOG’s strong balance sheet enables counter-cyclical investments when markets soften.
- Focus: free cash flow discipline
- Allocation drivers: cost of capital, buybacks, dividends
- Liquidity risk: credit conditions affect CAPEX on acreage/infrastructure
- Opportunity: strong balance sheet supports counter-cyclical buys
LNG and petrochem demand
- US LNG capacity ~95 mtpa (end-2024)
- US ethylene/cracker capacity ~50 mtpa (2024)
- Export growth reduced regional oversupply and basis pressure
- Contracting optionality improved marketing; delays pose downside risk
45Q, NEPA delays and state rules reshape US oil, CCUS and capex amid tariffs, LNG buildout
WTI ~75 USD/bbl (mid‑2025), Henry Hub ~3 USD/MMBtu and NGLs ~30 USD/bbl underpin EOG cash flows; 2022–23 completion cost inflation (~20–30%) lengthened paybacks but 2024–25 normalization restored margins. Midland basis often 10–15 USD/bbl; Gray Oak/Cactus II cut differentials. US LNG ~95 mtpa (end‑2024) and US ethylene ~50 Mtpa (2024) tightened regional supply; strong FCF/low leverage enforces capital discipline.
| Metric | Value |
|---|---|
| WTI (mid‑2025) | ~75 USD/bbl |
| Henry Hub | ~3 USD/MMBtu |
| NGL blend | ~30 USD/bbl |
| Midland basis | 10–15 USD/bbl |
| Completion cost change (2022–23) | +20–30% |
| US LNG capacity (end‑2024) | ~95 mtpa |
| US ethylene (2024) | ~50 Mtpa |
Same Document Delivered
EOG Resources PESTLE Analysis
The preview shown here is the exact document you’ll receive after purchase—fully formatted and ready to use. This EOG Resources PESTLE Analysis delivers the same structured insights, data and layout as the downloadable file. No placeholders or changes; what you see is the final product ready for immediate use.
Original: $10.00
-65%$10.00
$3.50Description
Plan Smarter. Present Sharper. Compete Stronger.
Our PESTLE Analysis of EOG Resources reveals how political shifts, energy markets, technological advances, and environmental regulations converge to shape its strategic outlook. Ideal for investors and strategists, this concise report highlights risks and opportunities you can act on today. Buy the full analysis to access the complete, ready-to-use insights instantly.
Political factors
Federal energy policy
Shifts in federal energy policy reshape leasing, permitting and emissions rules that directly affect EOG’s cost base and project timelines amid U.S. crude output near 13.5 mb/d in 2024. Changes between administrations can accelerate or restrict development on federal and mixed-mineral acreage, altering reserve access and schedule risk. Incentives such as the enhanced 45Q credit (up to $85/ton for CO2) steer capital toward lower‑carbon tech and CCUS. Federal infrastructure priorities — including pipeline and LNG export capacity (~12 Bcf/d) — influence takeaway capacity and market access for EOG.
State-level regulation
State regimes in Texas, New Mexico and North Dakota — where EOG's Permian and Bakken activity is concentrated — set drilling, flaring and water rules that shape operating practices; Texas crude output was ~5.9 mbd in 2023, New Mexico ~1.3 mbd and North Dakota ~1.1 mbd (EIA).
Variability across states creates compliance complexity and basin cost differentials; state commissions have tightened methane and seismicity controls, delaying permits and shifting production schedules.
Local permitting and setback rules constrain pad placement and cadence, raising per-well development costs and capital timing risk.
Permitting timelines
NEPA reviews (often 1–5 years), air permits (commonly 6–12 months) and rights‑of‑way approvals on federal/tribal lands (frequently >18 months) can materially delay projects; regulatory tightening or streamlining shifts these cycle times. EOG’s ability to execute multi‑year drilling hinges on predictable approvals; its ~2024 capex (~$2.2B) and schedules face higher non‑productive time and working capital needs if backlogs persist.
Trade and tariffs
Tariffs such as the US 25% Section 232 steel tariff raise costs for steel, OCTG and drilling equipment, squeezing well economics and raising per‑well costs for EOG. Geopolitical tensions disrupt supply chains for specialty components and can delay rigs and completions. Trade policy and currency swings affect NGL export arbitrage and pricing, impacting realized margins.
- 25% US steel tariff increases capex per well
- OCTG duties and geopolitical risk disrupt timelines
- Currency/trade policy alters NGL export spreads
- Stable trade flows support sourcing and scheduling
Election cycles
National and state elections in 2024 can reset priorities on climate, leasing, and infrastructure, creating regulatory swings that affect EOG Resources’ asset economics. Policy uncertainty ahead of elections often defers drilling and midstream investment; IEA 2024 highlighted increased capital allocation volatility in energy markets. Post-election regulatory shifts may re-rate basin attractiveness, so EOG must keep flexibility to pivot capital among plays.
- 2024 election-driven policy risk: higher near-term uncertainty
- Investment deferral: documented volatility per IEA 2024
- Operational response: maintain capital mobility across basins
45Q, NEPA delays and state rules reshape US oil, CCUS and capex amid tariffs, LNG buildout
Federal policy shifts (U.S. crude ~13.5 mb/d in 2024) and 45Q credits up to $85/ton reshape EOG’s permitting, CCUS and capex decisions; 2024 capex ~ $2.2B faces NEPA/air permit delays (months–years). State rules in TX (crude ~5.9 mb/d), NM (~1.3 mbd) and ND (~1.1 mbd) drive drilling, flaring and methane costs. Trade tariffs (25% steel) and ~12 Bcf/d LNG capacity affect equipment costs and market access.
| Metric | Value |
|---|---|
| US crude 2024 | ~13.5 mb/d |
| TX/NM/ND output | 5.9 / 1.3 / 1.1 mbd |
| EOG 2024 capex | ~$2.2B |
| 45Q credit | up to $85/ton |
| Steel tariff | 25% |
What is included in the product
Detailed Word Document
Explores how Political, Economic, Social, Technological, Environmental and Legal forces uniquely impact EOG Resources, with data-backed trends, sector-specific examples and forward-looking insights to help executives, investors and strategists identify risks, opportunities and inform scenario-driven planning.
Customizable Excel Spreadsheet
A concise, visually segmented PESTLE summary for EOG Resources that streamlines external risk discussions, is easily dropped into presentations or shared across teams, and allows quick note edits to tailor insights by region or business line during planning sessions.
Economic factors
Oil and gas price volatility
WTI at ~75 USD/bbl, Henry Hub near 3.0 USD/MMBtu and Mont Belvieu NGL blend around 30 USD/bbl in mid‑2025 drive EOG cash flows, returns and drilling intensity. Volatile price swings shift PDP valuations and prompt dynamic hedging program adjustments. Basin‑specific differentials change realized pricing and capital allocation; prolonged lows compress margins while sustained highs strain service capacity.
Service cost inflation
Rigs, frac spreads, sand and labor cycles drove well costs higher—U.S. rig counts and frac-spread tightness in 2022–23 pushed completion costs up roughly 20–30% versus pre-pandemic levels, elongating paybacks. Tight markets raised dayrates and completion expenses, compressing IRRs for EOG and peers. By 2024 supply normalization and easing sand prices began restoring margins and capital efficiency. Aggressive contracting strategies and strong vendor relationships remain key mitigants.
Pipeline and takeaway capacity
Takeaway constraints have pushed Midland/WTI basis differentials into the roughly 10–15 USD/bbl range at times, raising trucking and flaring mitigation costs. Additions like Gray Oak (900 kb/d) and Cactus II (585 kb/d) have lowered differentials and stabilized realizations. Timing of midstream builds still dictates E&P pacing, while EOG’s marketing and firm-transport contracts help optimize netbacks.
Capital markets and discipline
Investor emphasis on free cash flow and returns constrains EOG Resources from overexpansion; cost of capital, buybacks, and dividends drive disciplined capital allocation and prioritize shareholder returns over acreage growth.
Credit conditions influence liquidity for acreage, infrastructure, and technology spending, while EOG’s strong balance sheet enables counter-cyclical investments when markets soften.
- Focus: free cash flow discipline
- Allocation drivers: cost of capital, buybacks, dividends
- Liquidity risk: credit conditions affect CAPEX on acreage/infrastructure
- Opportunity: strong balance sheet supports counter-cyclical buys
LNG and petrochem demand
- US LNG capacity ~95 mtpa (end-2024)
- US ethylene/cracker capacity ~50 mtpa (2024)
- Export growth reduced regional oversupply and basis pressure
- Contracting optionality improved marketing; delays pose downside risk
45Q, NEPA delays and state rules reshape US oil, CCUS and capex amid tariffs, LNG buildout
WTI ~75 USD/bbl (mid‑2025), Henry Hub ~3 USD/MMBtu and NGLs ~30 USD/bbl underpin EOG cash flows; 2022–23 completion cost inflation (~20–30%) lengthened paybacks but 2024–25 normalization restored margins. Midland basis often 10–15 USD/bbl; Gray Oak/Cactus II cut differentials. US LNG ~95 mtpa (end‑2024) and US ethylene ~50 Mtpa (2024) tightened regional supply; strong FCF/low leverage enforces capital discipline.
| Metric | Value |
|---|---|
| WTI (mid‑2025) | ~75 USD/bbl |
| Henry Hub | ~3 USD/MMBtu |
| NGL blend | ~30 USD/bbl |
| Midland basis | 10–15 USD/bbl |
| Completion cost change (2022–23) | +20–30% |
| US LNG capacity (end‑2024) | ~95 mtpa |
| US ethylene (2024) | ~50 Mtpa |
Same Document Delivered
EOG Resources PESTLE Analysis
The preview shown here is the exact document you’ll receive after purchase—fully formatted and ready to use. This EOG Resources PESTLE Analysis delivers the same structured insights, data and layout as the downloadable file. No placeholders or changes; what you see is the final product ready for immediate use.











