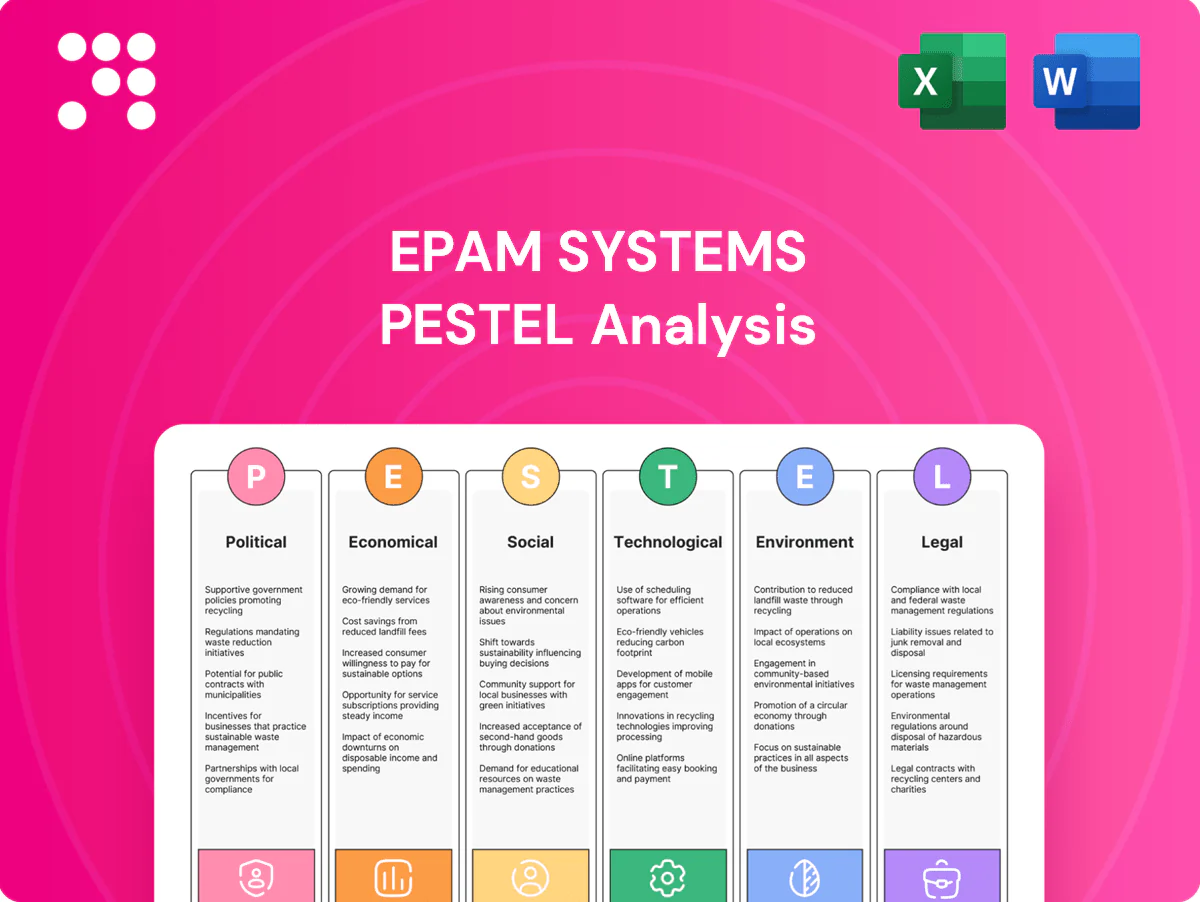
EPAM Systems PESTLE Analysis

Plan Smarter. Present Sharper. Compete Stronger.
Uncover how political shifts, economic cycles, and rapid tech change are reshaping EPAM Systems with our concise PESTLE snapshot—insightful for investors and strategists alike. This expertly researched brief highlights key external risks and opportunities; purchase the full PESTLE for the complete, actionable breakdown and ready-to-use charts to power your decisions.
Political factors

Geopolitical exposure
EPAM’s global delivery footprint, with over 60,000 employees across 35+ countries, faces disruption from regional conflicts, sanctions, and shifting alliances that can interrupt client programs. Political instability restricts travel, talent mobility, and nearshore options and drove EPAM to suspend operations in Russia in 2022. Diversifying locations and contingency planning mitigate concentration risk. Active government relations help anticipate policy changes.
Government tech spending
Public sector digital initiatives drive demand for EPAM's platform engineering and modernization services, aligning with the firm's 2024 revenue base (about $5.14 billion) and pipeline focus on government accounts.
Budget cycles and procurement rules—notably the US federal IT budget near $112 billion for FY2025—shape deal timing and margin pressure for multi-year modernization contracts.
Compliance with public procurement standards and holding relevant partner certifications (e.g., AWS, Microsoft Government, FedRAMP for US work) is essential to access and scale this revenue.

Trade and visa policies
Changes to work visas and immigration quotas, notably the US H-1B cap of 85,000 plus 20,000 master’s exemptions, and tightening remote-work rules reduce staffing flexibility and onsite delivery options. US/US-allied export controls on advanced AI chips and tooling since 2023 constrain cross-border projects and vendor choices. EPAM must optimize global mobility and local hiring models and maintain proactive immigration compliance to preserve service levels for its ~57,000-strong workforce.

Data sovereignty mandates
Data sovereignty mandates (GDPR, India, China, Russia) force EPAM to architect region-compliant platforms that preserve latency and cost efficiency; GDPR noncompliance can trigger fines up to 4% of global turnover. Local partnerships and certified cloud regions are critical to avoid project delays and regulatory penalties.
Incentives and R&D policy
R&D tax credits (commonly 6–14% effective), EU Horizon Europe funding of €95.5bn (2021–27) and US CHIPS Act subsidies of $52.7bn lower innovation costs and boost demand for AI, cybersecurity and semiconductor services; EPAM can align labs and delivery centers to capture grants and tax breaks while monitoring policy shifts to guide site selection and investments.
- Align labs to tax/grant zones
- Target AI/cyber/semiconductor policy hotspots
- Use policy monitoring for site selection
57,000+ staff, $5.14B revenue face sanctions, visa caps; US IT $112B boosts pipeline
EPAM’s 57,000+ workforce and $5.14B 2024 revenue face risks from regional conflicts, sanctions and visa limits (H‑1B 85k+20k) that disrupt delivery; US FY2025 federal IT ~$112B shapes pipeline timing; GDPR (4% turnover), export controls and data‑sovereignty rules raise compliance costs; R&D credits (6–14%), CHIPS $52.7B and Horizon Europe €95.5B create funding tailwinds.
| Metric | Value |
|---|---|
| Revenue 2024 | $5.14B |
| Employees | ~57,000 |
| US IT Budget FY2025 | $112B |
What is included in the product
 Detailed Word Document
Explores how macro-environmental factors affect EPAM Systems across Political, Economic, Social, Technological, Environmental and Legal dimensions; each section uses current data and trends to identify risks, opportunities and forward-looking insights for executives, investors and strategists.

 Customizable Excel Spreadsheet
Summarized EPAM Systems PESTLE that’s visually segmented for quick interpretation, easily dropped into presentations or shared across teams, and editable for region- or business-line–specific notes to streamline risk discussions and strategic planning.
Economic factors

IT spend cycles
Macro slowdowns push discretionary transformation projects into deferral, while growth phases accelerate demand for platform engineering; Gartner projects global IT spending at about 4.7 trillion USD in 2024, underscoring large addressable demand swings.
EPAM’s diversified industry mix helps smooth cyclicality versus single-sector peers; value-based pricing and managed services can stabilize revenue and margins, making pipeline visibility and backlog management (key operational levers) critical to EBITDA resilience.
Labor cost inflation
Labor cost inflation in EPAM’s key delivery markets puts upward pressure on margins, forcing the company to manage rising wage demands across its engineering footprint.
EPAM leverages blended billing rates, automation and pyramid optimization to offset cost increases and preserve margin expansion.
Maintaining a nearshore-offshore mix remains a primary lever for cost control while targeted upskilling raises productivity per engineer.

Currency fluctuations
Multi-currency revenues and costs expose EPAM to FX volatility, a risk the company acknowledges in its SEC filings as materially affecting margins. It mitigates exposure through natural hedging (currency-matched staffing and billing) and targeted financial hedges using forwards and options. Contractual pricing clauses and periodic rate adjustments on longer projects further reduce pass-through risk. Rigorous treasury discipline, documented in corporate treasury policy, remains critical to execution.

Client consolidation
Client consolidation via M&A (global deal value ~2.8 trillion USD in 2024) tends to compress vendor lists and squeeze rates, but EPAM’s strong delivery quality and domain expertise support preferred-partner status; cross-selling across merged entities can expand scope while governance and account management become decisive differentiators.
- Vendor compression
- Preferred-partner edge
- Cross-sell growth
- Governance as differentiator
AI-driven productivity
Generative AI can cut software build costs and cycle times—Microsoft/GitHub studies show developer productivity gains up to 55% on coding tasks—allowing EPAM to rethink time-and-materials pricing toward outcome-based contracts and accelerators. By investing in AI platforms and reusable IP, EPAM can widen gross margins while clear ROI narratives (clients prioritize 6–18 month paybacks) sustain demand amid tight IT budgets.
- AI macro impact: PwC estimates up to $15.7 trillion added to global GDP by 2030
- Productivity: GitHub/Microsoft ~55% faster coding in studies
- Commercial: outcome-based pricing & accelerators capture value
- Finance: AI platforms improve margins; 6–18 month ROI keeps demand
57,000+ staff, $5.14B revenue face sanctions, visa caps; US IT $112B boosts pipeline
Macro IT spend ~4.7T (2024) drives demand swings; EPAM's diversified mix, managed services and nearshore-offshore model stabilize margins. Labor inflation pressures margins; automation, pyramid optimization and AI (GitHub ~55% coding speed) raise productivity and enable outcome pricing. FX and client M&A (~2.8T global deal value 2024) are material risks mitigated by hedging and preferred-partner status.
| Metric | Value | Implication |
|---|---|---|
| Global IT spend | 4.7T (2024) | Large addressable market |
| AI productivity | ~55% | Margin upside |
| Global M&A | ~2.8T (2024) | Vendor consolidation risk |
Preview Before You Purchase
EPAM Systems PESTLE Analysis
The EPAM Systems PESTLE Analysis provides a concise evaluation of political, economic, social, technological, legal, and environmental factors shaping the company’s strategy and risks. The preview shown here is the exact document you’ll receive after purchase—fully formatted and ready to use. This analysis is actionable for investors and strategists seeking clarity on EPAM’s external landscape.

Plan Smarter. Present Sharper. Compete Stronger.
Uncover how political shifts, economic cycles, and rapid tech change are reshaping EPAM Systems with our concise PESTLE snapshot—insightful for investors and strategists alike. This expertly researched brief highlights key external risks and opportunities; purchase the full PESTLE for the complete, actionable breakdown and ready-to-use charts to power your decisions.
Political factors
Geopolitical exposure
EPAM’s global delivery footprint, with over 60,000 employees across 35+ countries, faces disruption from regional conflicts, sanctions, and shifting alliances that can interrupt client programs. Political instability restricts travel, talent mobility, and nearshore options and drove EPAM to suspend operations in Russia in 2022. Diversifying locations and contingency planning mitigate concentration risk. Active government relations help anticipate policy changes.
Government tech spending
Public sector digital initiatives drive demand for EPAM's platform engineering and modernization services, aligning with the firm's 2024 revenue base (about $5.14 billion) and pipeline focus on government accounts.
Budget cycles and procurement rules—notably the US federal IT budget near $112 billion for FY2025—shape deal timing and margin pressure for multi-year modernization contracts.
Compliance with public procurement standards and holding relevant partner certifications (e.g., AWS, Microsoft Government, FedRAMP for US work) is essential to access and scale this revenue.
Trade and visa policies
Changes to work visas and immigration quotas, notably the US H-1B cap of 85,000 plus 20,000 master’s exemptions, and tightening remote-work rules reduce staffing flexibility and onsite delivery options. US/US-allied export controls on advanced AI chips and tooling since 2023 constrain cross-border projects and vendor choices. EPAM must optimize global mobility and local hiring models and maintain proactive immigration compliance to preserve service levels for its ~57,000-strong workforce.
Data sovereignty mandates
Data sovereignty mandates (GDPR, India, China, Russia) force EPAM to architect region-compliant platforms that preserve latency and cost efficiency; GDPR noncompliance can trigger fines up to 4% of global turnover. Local partnerships and certified cloud regions are critical to avoid project delays and regulatory penalties.
Incentives and R&D policy
R&D tax credits (commonly 6–14% effective), EU Horizon Europe funding of €95.5bn (2021–27) and US CHIPS Act subsidies of $52.7bn lower innovation costs and boost demand for AI, cybersecurity and semiconductor services; EPAM can align labs and delivery centers to capture grants and tax breaks while monitoring policy shifts to guide site selection and investments.
- Align labs to tax/grant zones
- Target AI/cyber/semiconductor policy hotspots
- Use policy monitoring for site selection
57,000+ staff, $5.14B revenue face sanctions, visa caps; US IT $112B boosts pipeline
EPAM’s 57,000+ workforce and $5.14B 2024 revenue face risks from regional conflicts, sanctions and visa limits (H‑1B 85k+20k) that disrupt delivery; US FY2025 federal IT ~$112B shapes pipeline timing; GDPR (4% turnover), export controls and data‑sovereignty rules raise compliance costs; R&D credits (6–14%), CHIPS $52.7B and Horizon Europe €95.5B create funding tailwinds.
| Metric | Value |
|---|---|
| Revenue 2024 | $5.14B |
| Employees | ~57,000 |
| US IT Budget FY2025 | $112B |
What is included in the product
Detailed Word Document
Explores how macro-environmental factors affect EPAM Systems across Political, Economic, Social, Technological, Environmental and Legal dimensions; each section uses current data and trends to identify risks, opportunities and forward-looking insights for executives, investors and strategists.
Customizable Excel Spreadsheet
Summarized EPAM Systems PESTLE that’s visually segmented for quick interpretation, easily dropped into presentations or shared across teams, and editable for region- or business-line–specific notes to streamline risk discussions and strategic planning.
Economic factors
IT spend cycles
Macro slowdowns push discretionary transformation projects into deferral, while growth phases accelerate demand for platform engineering; Gartner projects global IT spending at about 4.7 trillion USD in 2024, underscoring large addressable demand swings.
EPAM’s diversified industry mix helps smooth cyclicality versus single-sector peers; value-based pricing and managed services can stabilize revenue and margins, making pipeline visibility and backlog management (key operational levers) critical to EBITDA resilience.
Labor cost inflation
Labor cost inflation in EPAM’s key delivery markets puts upward pressure on margins, forcing the company to manage rising wage demands across its engineering footprint.
EPAM leverages blended billing rates, automation and pyramid optimization to offset cost increases and preserve margin expansion.
Maintaining a nearshore-offshore mix remains a primary lever for cost control while targeted upskilling raises productivity per engineer.
Currency fluctuations
Multi-currency revenues and costs expose EPAM to FX volatility, a risk the company acknowledges in its SEC filings as materially affecting margins. It mitigates exposure through natural hedging (currency-matched staffing and billing) and targeted financial hedges using forwards and options. Contractual pricing clauses and periodic rate adjustments on longer projects further reduce pass-through risk. Rigorous treasury discipline, documented in corporate treasury policy, remains critical to execution.
Client consolidation
Client consolidation via M&A (global deal value ~2.8 trillion USD in 2024) tends to compress vendor lists and squeeze rates, but EPAM’s strong delivery quality and domain expertise support preferred-partner status; cross-selling across merged entities can expand scope while governance and account management become decisive differentiators.
- Vendor compression
- Preferred-partner edge
- Cross-sell growth
- Governance as differentiator
AI-driven productivity
Generative AI can cut software build costs and cycle times—Microsoft/GitHub studies show developer productivity gains up to 55% on coding tasks—allowing EPAM to rethink time-and-materials pricing toward outcome-based contracts and accelerators. By investing in AI platforms and reusable IP, EPAM can widen gross margins while clear ROI narratives (clients prioritize 6–18 month paybacks) sustain demand amid tight IT budgets.
- AI macro impact: PwC estimates up to $15.7 trillion added to global GDP by 2030
- Productivity: GitHub/Microsoft ~55% faster coding in studies
- Commercial: outcome-based pricing & accelerators capture value
- Finance: AI platforms improve margins; 6–18 month ROI keeps demand
57,000+ staff, $5.14B revenue face sanctions, visa caps; US IT $112B boosts pipeline
Macro IT spend ~4.7T (2024) drives demand swings; EPAM's diversified mix, managed services and nearshore-offshore model stabilize margins. Labor inflation pressures margins; automation, pyramid optimization and AI (GitHub ~55% coding speed) raise productivity and enable outcome pricing. FX and client M&A (~2.8T global deal value 2024) are material risks mitigated by hedging and preferred-partner status.
| Metric | Value | Implication |
|---|---|---|
| Global IT spend | 4.7T (2024) | Large addressable market |
| AI productivity | ~55% | Margin upside |
| Global M&A | ~2.8T (2024) | Vendor consolidation risk |
Preview Before You Purchase
EPAM Systems PESTLE Analysis
The EPAM Systems PESTLE Analysis provides a concise evaluation of political, economic, social, technological, legal, and environmental factors shaping the company’s strategy and risks. The preview shown here is the exact document you’ll receive after purchase—fully formatted and ready to use. This analysis is actionable for investors and strategists seeking clarity on EPAM’s external landscape.
Original: $10.00
-65%$10.00
$3.50Description
Plan Smarter. Present Sharper. Compete Stronger.
Uncover how political shifts, economic cycles, and rapid tech change are reshaping EPAM Systems with our concise PESTLE snapshot—insightful for investors and strategists alike. This expertly researched brief highlights key external risks and opportunities; purchase the full PESTLE for the complete, actionable breakdown and ready-to-use charts to power your decisions.
Political factors
Geopolitical exposure
EPAM’s global delivery footprint, with over 60,000 employees across 35+ countries, faces disruption from regional conflicts, sanctions, and shifting alliances that can interrupt client programs. Political instability restricts travel, talent mobility, and nearshore options and drove EPAM to suspend operations in Russia in 2022. Diversifying locations and contingency planning mitigate concentration risk. Active government relations help anticipate policy changes.
Government tech spending
Public sector digital initiatives drive demand for EPAM's platform engineering and modernization services, aligning with the firm's 2024 revenue base (about $5.14 billion) and pipeline focus on government accounts.
Budget cycles and procurement rules—notably the US federal IT budget near $112 billion for FY2025—shape deal timing and margin pressure for multi-year modernization contracts.
Compliance with public procurement standards and holding relevant partner certifications (e.g., AWS, Microsoft Government, FedRAMP for US work) is essential to access and scale this revenue.
Trade and visa policies
Changes to work visas and immigration quotas, notably the US H-1B cap of 85,000 plus 20,000 master’s exemptions, and tightening remote-work rules reduce staffing flexibility and onsite delivery options. US/US-allied export controls on advanced AI chips and tooling since 2023 constrain cross-border projects and vendor choices. EPAM must optimize global mobility and local hiring models and maintain proactive immigration compliance to preserve service levels for its ~57,000-strong workforce.
Data sovereignty mandates
Data sovereignty mandates (GDPR, India, China, Russia) force EPAM to architect region-compliant platforms that preserve latency and cost efficiency; GDPR noncompliance can trigger fines up to 4% of global turnover. Local partnerships and certified cloud regions are critical to avoid project delays and regulatory penalties.
Incentives and R&D policy
R&D tax credits (commonly 6–14% effective), EU Horizon Europe funding of €95.5bn (2021–27) and US CHIPS Act subsidies of $52.7bn lower innovation costs and boost demand for AI, cybersecurity and semiconductor services; EPAM can align labs and delivery centers to capture grants and tax breaks while monitoring policy shifts to guide site selection and investments.
- Align labs to tax/grant zones
- Target AI/cyber/semiconductor policy hotspots
- Use policy monitoring for site selection
57,000+ staff, $5.14B revenue face sanctions, visa caps; US IT $112B boosts pipeline
EPAM’s 57,000+ workforce and $5.14B 2024 revenue face risks from regional conflicts, sanctions and visa limits (H‑1B 85k+20k) that disrupt delivery; US FY2025 federal IT ~$112B shapes pipeline timing; GDPR (4% turnover), export controls and data‑sovereignty rules raise compliance costs; R&D credits (6–14%), CHIPS $52.7B and Horizon Europe €95.5B create funding tailwinds.
| Metric | Value |
|---|---|
| Revenue 2024 | $5.14B |
| Employees | ~57,000 |
| US IT Budget FY2025 | $112B |
What is included in the product
Detailed Word Document
Explores how macro-environmental factors affect EPAM Systems across Political, Economic, Social, Technological, Environmental and Legal dimensions; each section uses current data and trends to identify risks, opportunities and forward-looking insights for executives, investors and strategists.
Customizable Excel Spreadsheet
Summarized EPAM Systems PESTLE that’s visually segmented for quick interpretation, easily dropped into presentations or shared across teams, and editable for region- or business-line–specific notes to streamline risk discussions and strategic planning.
Economic factors
IT spend cycles
Macro slowdowns push discretionary transformation projects into deferral, while growth phases accelerate demand for platform engineering; Gartner projects global IT spending at about 4.7 trillion USD in 2024, underscoring large addressable demand swings.
EPAM’s diversified industry mix helps smooth cyclicality versus single-sector peers; value-based pricing and managed services can stabilize revenue and margins, making pipeline visibility and backlog management (key operational levers) critical to EBITDA resilience.
Labor cost inflation
Labor cost inflation in EPAM’s key delivery markets puts upward pressure on margins, forcing the company to manage rising wage demands across its engineering footprint.
EPAM leverages blended billing rates, automation and pyramid optimization to offset cost increases and preserve margin expansion.
Maintaining a nearshore-offshore mix remains a primary lever for cost control while targeted upskilling raises productivity per engineer.
Currency fluctuations
Multi-currency revenues and costs expose EPAM to FX volatility, a risk the company acknowledges in its SEC filings as materially affecting margins. It mitigates exposure through natural hedging (currency-matched staffing and billing) and targeted financial hedges using forwards and options. Contractual pricing clauses and periodic rate adjustments on longer projects further reduce pass-through risk. Rigorous treasury discipline, documented in corporate treasury policy, remains critical to execution.
Client consolidation
Client consolidation via M&A (global deal value ~2.8 trillion USD in 2024) tends to compress vendor lists and squeeze rates, but EPAM’s strong delivery quality and domain expertise support preferred-partner status; cross-selling across merged entities can expand scope while governance and account management become decisive differentiators.
- Vendor compression
- Preferred-partner edge
- Cross-sell growth
- Governance as differentiator
AI-driven productivity
Generative AI can cut software build costs and cycle times—Microsoft/GitHub studies show developer productivity gains up to 55% on coding tasks—allowing EPAM to rethink time-and-materials pricing toward outcome-based contracts and accelerators. By investing in AI platforms and reusable IP, EPAM can widen gross margins while clear ROI narratives (clients prioritize 6–18 month paybacks) sustain demand amid tight IT budgets.
- AI macro impact: PwC estimates up to $15.7 trillion added to global GDP by 2030
- Productivity: GitHub/Microsoft ~55% faster coding in studies
- Commercial: outcome-based pricing & accelerators capture value
- Finance: AI platforms improve margins; 6–18 month ROI keeps demand
57,000+ staff, $5.14B revenue face sanctions, visa caps; US IT $112B boosts pipeline
Macro IT spend ~4.7T (2024) drives demand swings; EPAM's diversified mix, managed services and nearshore-offshore model stabilize margins. Labor inflation pressures margins; automation, pyramid optimization and AI (GitHub ~55% coding speed) raise productivity and enable outcome pricing. FX and client M&A (~2.8T global deal value 2024) are material risks mitigated by hedging and preferred-partner status.
| Metric | Value | Implication |
|---|---|---|
| Global IT spend | 4.7T (2024) | Large addressable market |
| AI productivity | ~55% | Margin upside |
| Global M&A | ~2.8T (2024) | Vendor consolidation risk |
Preview Before You Purchase
EPAM Systems PESTLE Analysis
The EPAM Systems PESTLE Analysis provides a concise evaluation of political, economic, social, technological, legal, and environmental factors shaping the company’s strategy and risks. The preview shown here is the exact document you’ll receive after purchase—fully formatted and ready to use. This analysis is actionable for investors and strategists seeking clarity on EPAM’s external landscape.











