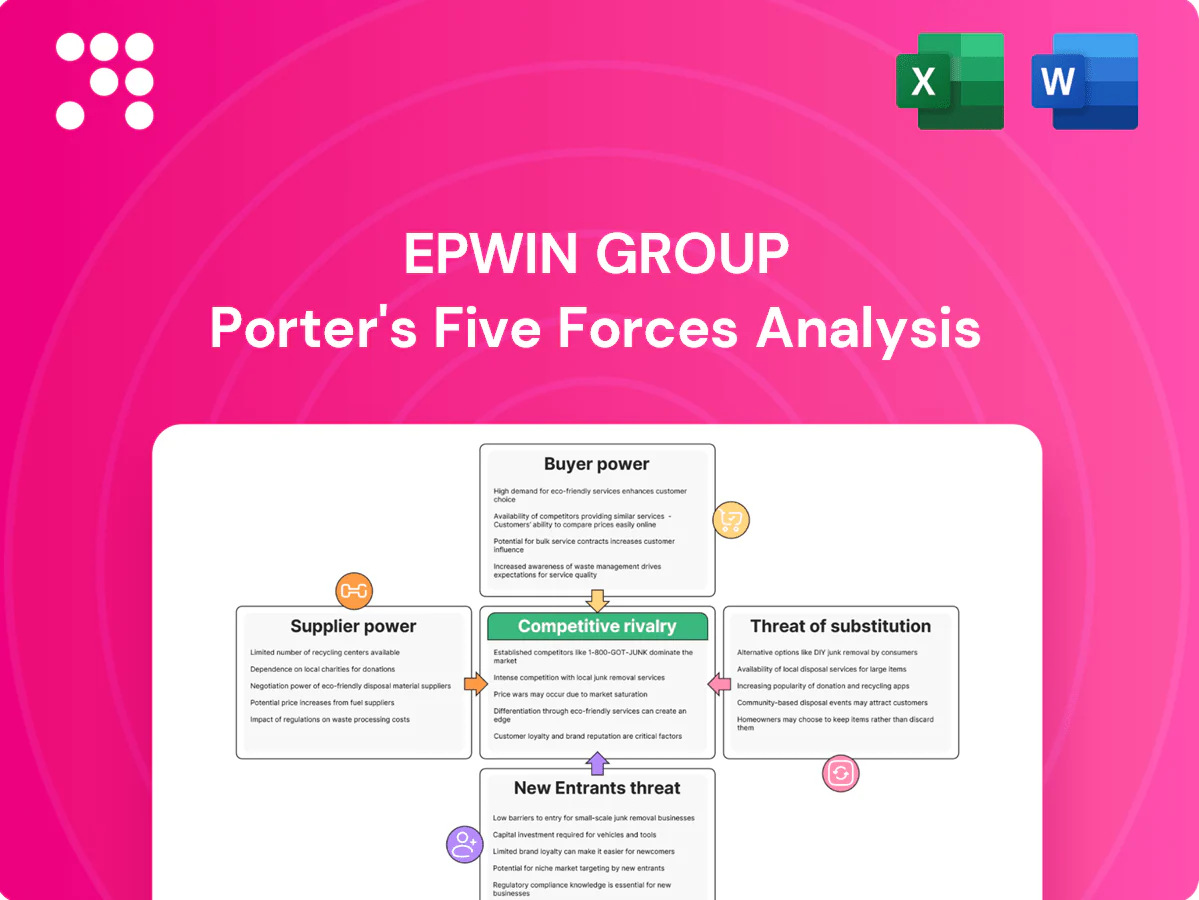
Epwin Group Porter's Five Forces Analysis

Go Beyond the Preview—Access the Full Strategic Report
Epwin Group faces moderate supplier and buyer power, niche substitute threats, and notable entry barriers—yet competitive rivalry and regulatory shifts shape margins and growth prospects; this brief snapshot only scratches the surface. Unlock the full Porter's Five Forces Analysis to explore force-by-force ratings, visuals, and strategic implications tailored to Epwin Group.
Suppliers Bargaining Power

Supplier Power 1
Core inputs like PVC resins, aluminium billets, glass and hardware are sourced from a relatively concentrated set of global suppliers, giving suppliers meaningful leverage over Epwin. Petrochemical cycles and smelter capacity constraints periodically tighten availability and push input prices higher. Epwin mitigates exposure through long-term contracts and hedging, but spot price spikes and energy surcharges continue to transmit into costs.
Supplier Power 2
Energy intensity in extrusion and aluminium processing makes electricity and gas suppliers influential: primary aluminium electrolysis requires roughly 13–15 MWh per tonne, and energy can account for 20–40% of processing costs. Volatile markets can shift cost structures rapidly; efficiency upgrades and corporate PPAs reduce exposure, but sudden regulatory levies or grid constraints can quickly reassert supplier power.

Supplier Power 3
Switching costs for critical additives, profiles and hardware are non-trivial due to tooling, warranty and certification requirements; qualification often spans 3–9 months. Dual-sourcing reduces dependency but still requires that qualification time and sample validation. Approved-vendor lists and compliance testing commonly add 6–12 weeks to supplier swaps. These frictions give incumbent suppliers bargaining room on terms and lead times.

Supplier Power 4
Supplier power for Epwin is elevated because logistics and import dynamics (ports, freight volatility and FX) materially affect delivered costs for imported polymers, aluminium and components; global container rates fell c.70% from 2022 peaks into 2024 but remain volatile, shifting margins.
Disruptions often prioritise larger buyers or higher-margin routes, while regional stocking and in-house recycling (used by many windows profile makers) cushion shocks; tight freight capacity during peaks increases supplier leverage.
Supplier Power 5
Recycled PVC and aluminium content reduced Epwin Group’s reliance on virgin inputs in 2024, moderating supplier influence and price exposure. Building a closed-loop recycling network strengthened negotiating position with upstream suppliers while requiring strict quality controls to meet performance specs. Investment in sorting and compounding improved control over input cost trajectories and supply predictability.
- 2024: closed-loop recycling scaled to lower virgin demand
- Quality: consistent recyclate necessary to meet spec
- CapEx: sorting/compounding reduces input cost volatility
Supplier power high: energy intensity and 40–60% imported polymers
Suppliers hold elevated power for Epwin due to concentrated PVC/aluminium/glass markets, energy intensity (aluminium 13–15 MWh/t; energy 20–40% of costs) and switching/qualification frictions (3–9 months). Long-term contracts, hedges and 2024 closed-loop recycling (reduced virgin demand) moderate but do not eliminate exposure; imported polymers remain c.40–60% of material spend.
| Metric | 2024 |
|---|---|
| Imported polymers % spend | 40–60% |
| Aluminium energy | 13–15 MWh/t |
| Energy share of costs | 20–40% |
| Recycling impact | Scaled in 2024 |
What is included in the product
 Detailed Word Document
Tailored Porter’s Five Forces analysis for Epwin Group, assessing competitive rivalry, buyer and supplier bargaining power, threat of new entrants and substitutes, and highlighting disruptive forces and entry barriers that shape pricing, profitability and strategic positioning.

 Customizable Excel Spreadsheet
Clear one-sheet Porter's Five Forces for Epwin Group—perfect for quick decisions, with customizable pressure levels and an instant spider chart to visualize strategic threats and opportunities.
Customers Bargaining Power

Buyer Power 1
Buyer Power 1: Epwin serves a mixed customer base—RMI installers, trade counters, housebuilders and social housing frameworks—which creates varied bargaining power across channels.
Large housebuilders and procurement consortia exert strong price and service pressure, while fragmented small installers lack leverage.
Commercial terms commonly include volume-linked rebates and strict service SLAs.
UK new-build completions were 222,820 in 2023, concentrating demand among bigger builders and strengthening their negotiation position.
Buyer Power 2
Products are spec-driven with performance standards, certifications and warranties that materially raise switching costs for customers, since changing profiles or systems often triggers retraining, re‑certification and new tooling requirements.
This creates subdued buyer power during mid-contract periods as replacements are costly and disruptive, but regular tender cycles reopen pricing pressure and force periodic renegotiation.

Buyer Power 3
Buyer Power 3: In Epwin’s commoditised PVC-U segments price sensitivity is high as aesthetics and U-values converge, driving margin compression of around 200 basis points in 2024 as customers benchmark aggressively against rivals. Buyers routinely compare rivals’ quotes, accelerating price-led churn. Differentiation via service, delivery reliability and bespoke solutions has defended margins, with value-added bundles lifting realised prices by c.5–10% in 2024.

Buyer Power 4
Buyer Power 4: lead times and OTIF (industry target ~95%) drive site schedules, letting buyers enforce penalties or dual-source; strong logistics and consistent OTIF can make Epwin the preferred partner, while delays hand buyers leverage to demand price or payment concessions; integrated forecasting and transparency reduce this volatility.
- OTIF ~95%
- Dual-sourcing raises buyer leverage
- Forecast integration stabilizes supply
Buyer Power 5
Regulatory and ESG requirements (eg PAS 2035, EPDs) and the UK policy aim to deliver 300,000 homes pa shift social housing and new-build buyers toward compliant, sustainable products; suppliers that demonstrate lifecycle and recyclability data win negotiating room. Buyers still use total cost of ownership analyses to press for discounts, but documented EPDs and recyclability metrics materially reduce price pressure.
- PAS 2035 compliance required
- EPDs/lifecycle data increase procurement leverage
- TCO-driven discounts remain common
Builders hold pricing power; installers constrained - OTIF ~95%, margins ~200bps
Buyers show mixed power: large housebuilders and consortia command strong price/service leverage while fragmented installers have limited sway. Specification, certifications and high switching costs mute power mid‑contract, but tender cycles and dual‑sourcing drive periodic price pressure; OTIF (~95%) and 2024 margin compression (~200bps) shape negotiations.
| Metric | Value |
|---|---|
| UK new‑build (2023) | 222,820 |
| Target homes pa | 300,000 |
| OTIF | ~95% |
| Margin compression (2024) | ~200bps |
| Value‑add price lift (2024) | 5–10% |
What You See Is What You Get
Epwin Group Porter's Five Forces Analysis
This preview shows the exact document you'll receive immediately after purchase—no surprises, no placeholders. It contains a full Porter's Five Forces analysis of Epwin Group, covering competitive rivalry, supplier and buyer power, and threats of substitution and entry. The file is professionally formatted and ready to download and use instantly.

Go Beyond the Preview—Access the Full Strategic Report
Epwin Group faces moderate supplier and buyer power, niche substitute threats, and notable entry barriers—yet competitive rivalry and regulatory shifts shape margins and growth prospects; this brief snapshot only scratches the surface. Unlock the full Porter's Five Forces Analysis to explore force-by-force ratings, visuals, and strategic implications tailored to Epwin Group.
Suppliers Bargaining Power
Supplier Power 1
Core inputs like PVC resins, aluminium billets, glass and hardware are sourced from a relatively concentrated set of global suppliers, giving suppliers meaningful leverage over Epwin. Petrochemical cycles and smelter capacity constraints periodically tighten availability and push input prices higher. Epwin mitigates exposure through long-term contracts and hedging, but spot price spikes and energy surcharges continue to transmit into costs.
Supplier Power 2
Energy intensity in extrusion and aluminium processing makes electricity and gas suppliers influential: primary aluminium electrolysis requires roughly 13–15 MWh per tonne, and energy can account for 20–40% of processing costs. Volatile markets can shift cost structures rapidly; efficiency upgrades and corporate PPAs reduce exposure, but sudden regulatory levies or grid constraints can quickly reassert supplier power.
Supplier Power 3
Switching costs for critical additives, profiles and hardware are non-trivial due to tooling, warranty and certification requirements; qualification often spans 3–9 months. Dual-sourcing reduces dependency but still requires that qualification time and sample validation. Approved-vendor lists and compliance testing commonly add 6–12 weeks to supplier swaps. These frictions give incumbent suppliers bargaining room on terms and lead times.
Supplier Power 4
Supplier power for Epwin is elevated because logistics and import dynamics (ports, freight volatility and FX) materially affect delivered costs for imported polymers, aluminium and components; global container rates fell c.70% from 2022 peaks into 2024 but remain volatile, shifting margins.
Disruptions often prioritise larger buyers or higher-margin routes, while regional stocking and in-house recycling (used by many windows profile makers) cushion shocks; tight freight capacity during peaks increases supplier leverage.
Supplier Power 5
Recycled PVC and aluminium content reduced Epwin Group’s reliance on virgin inputs in 2024, moderating supplier influence and price exposure. Building a closed-loop recycling network strengthened negotiating position with upstream suppliers while requiring strict quality controls to meet performance specs. Investment in sorting and compounding improved control over input cost trajectories and supply predictability.
- 2024: closed-loop recycling scaled to lower virgin demand
- Quality: consistent recyclate necessary to meet spec
- CapEx: sorting/compounding reduces input cost volatility
Supplier power high: energy intensity and 40–60% imported polymers
Suppliers hold elevated power for Epwin due to concentrated PVC/aluminium/glass markets, energy intensity (aluminium 13–15 MWh/t; energy 20–40% of costs) and switching/qualification frictions (3–9 months). Long-term contracts, hedges and 2024 closed-loop recycling (reduced virgin demand) moderate but do not eliminate exposure; imported polymers remain c.40–60% of material spend.
| Metric | 2024 |
|---|---|
| Imported polymers % spend | 40–60% |
| Aluminium energy | 13–15 MWh/t |
| Energy share of costs | 20–40% |
| Recycling impact | Scaled in 2024 |
What is included in the product
Detailed Word Document
Tailored Porter’s Five Forces analysis for Epwin Group, assessing competitive rivalry, buyer and supplier bargaining power, threat of new entrants and substitutes, and highlighting disruptive forces and entry barriers that shape pricing, profitability and strategic positioning.
Customizable Excel Spreadsheet
Clear one-sheet Porter's Five Forces for Epwin Group—perfect for quick decisions, with customizable pressure levels and an instant spider chart to visualize strategic threats and opportunities.
Customers Bargaining Power
Buyer Power 1
Buyer Power 1: Epwin serves a mixed customer base—RMI installers, trade counters, housebuilders and social housing frameworks—which creates varied bargaining power across channels.
Large housebuilders and procurement consortia exert strong price and service pressure, while fragmented small installers lack leverage.
Commercial terms commonly include volume-linked rebates and strict service SLAs.
UK new-build completions were 222,820 in 2023, concentrating demand among bigger builders and strengthening their negotiation position.
Buyer Power 2
Products are spec-driven with performance standards, certifications and warranties that materially raise switching costs for customers, since changing profiles or systems often triggers retraining, re‑certification and new tooling requirements.
This creates subdued buyer power during mid-contract periods as replacements are costly and disruptive, but regular tender cycles reopen pricing pressure and force periodic renegotiation.
Buyer Power 3
Buyer Power 3: In Epwin’s commoditised PVC-U segments price sensitivity is high as aesthetics and U-values converge, driving margin compression of around 200 basis points in 2024 as customers benchmark aggressively against rivals. Buyers routinely compare rivals’ quotes, accelerating price-led churn. Differentiation via service, delivery reliability and bespoke solutions has defended margins, with value-added bundles lifting realised prices by c.5–10% in 2024.
Buyer Power 4
Buyer Power 4: lead times and OTIF (industry target ~95%) drive site schedules, letting buyers enforce penalties or dual-source; strong logistics and consistent OTIF can make Epwin the preferred partner, while delays hand buyers leverage to demand price or payment concessions; integrated forecasting and transparency reduce this volatility.
- OTIF ~95%
- Dual-sourcing raises buyer leverage
- Forecast integration stabilizes supply
Buyer Power 5
Regulatory and ESG requirements (eg PAS 2035, EPDs) and the UK policy aim to deliver 300,000 homes pa shift social housing and new-build buyers toward compliant, sustainable products; suppliers that demonstrate lifecycle and recyclability data win negotiating room. Buyers still use total cost of ownership analyses to press for discounts, but documented EPDs and recyclability metrics materially reduce price pressure.
- PAS 2035 compliance required
- EPDs/lifecycle data increase procurement leverage
- TCO-driven discounts remain common
Builders hold pricing power; installers constrained - OTIF ~95%, margins ~200bps
Buyers show mixed power: large housebuilders and consortia command strong price/service leverage while fragmented installers have limited sway. Specification, certifications and high switching costs mute power mid‑contract, but tender cycles and dual‑sourcing drive periodic price pressure; OTIF (~95%) and 2024 margin compression (~200bps) shape negotiations.
| Metric | Value |
|---|---|
| UK new‑build (2023) | 222,820 |
| Target homes pa | 300,000 |
| OTIF | ~95% |
| Margin compression (2024) | ~200bps |
| Value‑add price lift (2024) | 5–10% |
What You See Is What You Get
Epwin Group Porter's Five Forces Analysis
This preview shows the exact document you'll receive immediately after purchase—no surprises, no placeholders. It contains a full Porter's Five Forces analysis of Epwin Group, covering competitive rivalry, supplier and buyer power, and threats of substitution and entry. The file is professionally formatted and ready to download and use instantly.
Original: $10.00
-65%$10.00
$3.50Description
Go Beyond the Preview—Access the Full Strategic Report
Epwin Group faces moderate supplier and buyer power, niche substitute threats, and notable entry barriers—yet competitive rivalry and regulatory shifts shape margins and growth prospects; this brief snapshot only scratches the surface. Unlock the full Porter's Five Forces Analysis to explore force-by-force ratings, visuals, and strategic implications tailored to Epwin Group.
Suppliers Bargaining Power
Supplier Power 1
Core inputs like PVC resins, aluminium billets, glass and hardware are sourced from a relatively concentrated set of global suppliers, giving suppliers meaningful leverage over Epwin. Petrochemical cycles and smelter capacity constraints periodically tighten availability and push input prices higher. Epwin mitigates exposure through long-term contracts and hedging, but spot price spikes and energy surcharges continue to transmit into costs.
Supplier Power 2
Energy intensity in extrusion and aluminium processing makes electricity and gas suppliers influential: primary aluminium electrolysis requires roughly 13–15 MWh per tonne, and energy can account for 20–40% of processing costs. Volatile markets can shift cost structures rapidly; efficiency upgrades and corporate PPAs reduce exposure, but sudden regulatory levies or grid constraints can quickly reassert supplier power.
Supplier Power 3
Switching costs for critical additives, profiles and hardware are non-trivial due to tooling, warranty and certification requirements; qualification often spans 3–9 months. Dual-sourcing reduces dependency but still requires that qualification time and sample validation. Approved-vendor lists and compliance testing commonly add 6–12 weeks to supplier swaps. These frictions give incumbent suppliers bargaining room on terms and lead times.
Supplier Power 4
Supplier power for Epwin is elevated because logistics and import dynamics (ports, freight volatility and FX) materially affect delivered costs for imported polymers, aluminium and components; global container rates fell c.70% from 2022 peaks into 2024 but remain volatile, shifting margins.
Disruptions often prioritise larger buyers or higher-margin routes, while regional stocking and in-house recycling (used by many windows profile makers) cushion shocks; tight freight capacity during peaks increases supplier leverage.
Supplier Power 5
Recycled PVC and aluminium content reduced Epwin Group’s reliance on virgin inputs in 2024, moderating supplier influence and price exposure. Building a closed-loop recycling network strengthened negotiating position with upstream suppliers while requiring strict quality controls to meet performance specs. Investment in sorting and compounding improved control over input cost trajectories and supply predictability.
- 2024: closed-loop recycling scaled to lower virgin demand
- Quality: consistent recyclate necessary to meet spec
- CapEx: sorting/compounding reduces input cost volatility
Supplier power high: energy intensity and 40–60% imported polymers
Suppliers hold elevated power for Epwin due to concentrated PVC/aluminium/glass markets, energy intensity (aluminium 13–15 MWh/t; energy 20–40% of costs) and switching/qualification frictions (3–9 months). Long-term contracts, hedges and 2024 closed-loop recycling (reduced virgin demand) moderate but do not eliminate exposure; imported polymers remain c.40–60% of material spend.
| Metric | 2024 |
|---|---|
| Imported polymers % spend | 40–60% |
| Aluminium energy | 13–15 MWh/t |
| Energy share of costs | 20–40% |
| Recycling impact | Scaled in 2024 |
What is included in the product
Detailed Word Document
Tailored Porter’s Five Forces analysis for Epwin Group, assessing competitive rivalry, buyer and supplier bargaining power, threat of new entrants and substitutes, and highlighting disruptive forces and entry barriers that shape pricing, profitability and strategic positioning.
Customizable Excel Spreadsheet
Clear one-sheet Porter's Five Forces for Epwin Group—perfect for quick decisions, with customizable pressure levels and an instant spider chart to visualize strategic threats and opportunities.
Customers Bargaining Power
Buyer Power 1
Buyer Power 1: Epwin serves a mixed customer base—RMI installers, trade counters, housebuilders and social housing frameworks—which creates varied bargaining power across channels.
Large housebuilders and procurement consortia exert strong price and service pressure, while fragmented small installers lack leverage.
Commercial terms commonly include volume-linked rebates and strict service SLAs.
UK new-build completions were 222,820 in 2023, concentrating demand among bigger builders and strengthening their negotiation position.
Buyer Power 2
Products are spec-driven with performance standards, certifications and warranties that materially raise switching costs for customers, since changing profiles or systems often triggers retraining, re‑certification and new tooling requirements.
This creates subdued buyer power during mid-contract periods as replacements are costly and disruptive, but regular tender cycles reopen pricing pressure and force periodic renegotiation.
Buyer Power 3
Buyer Power 3: In Epwin’s commoditised PVC-U segments price sensitivity is high as aesthetics and U-values converge, driving margin compression of around 200 basis points in 2024 as customers benchmark aggressively against rivals. Buyers routinely compare rivals’ quotes, accelerating price-led churn. Differentiation via service, delivery reliability and bespoke solutions has defended margins, with value-added bundles lifting realised prices by c.5–10% in 2024.
Buyer Power 4
Buyer Power 4: lead times and OTIF (industry target ~95%) drive site schedules, letting buyers enforce penalties or dual-source; strong logistics and consistent OTIF can make Epwin the preferred partner, while delays hand buyers leverage to demand price or payment concessions; integrated forecasting and transparency reduce this volatility.
- OTIF ~95%
- Dual-sourcing raises buyer leverage
- Forecast integration stabilizes supply
Buyer Power 5
Regulatory and ESG requirements (eg PAS 2035, EPDs) and the UK policy aim to deliver 300,000 homes pa shift social housing and new-build buyers toward compliant, sustainable products; suppliers that demonstrate lifecycle and recyclability data win negotiating room. Buyers still use total cost of ownership analyses to press for discounts, but documented EPDs and recyclability metrics materially reduce price pressure.
- PAS 2035 compliance required
- EPDs/lifecycle data increase procurement leverage
- TCO-driven discounts remain common
Builders hold pricing power; installers constrained - OTIF ~95%, margins ~200bps
Buyers show mixed power: large housebuilders and consortia command strong price/service leverage while fragmented installers have limited sway. Specification, certifications and high switching costs mute power mid‑contract, but tender cycles and dual‑sourcing drive periodic price pressure; OTIF (~95%) and 2024 margin compression (~200bps) shape negotiations.
| Metric | Value |
|---|---|
| UK new‑build (2023) | 222,820 |
| Target homes pa | 300,000 |
| OTIF | ~95% |
| Margin compression (2024) | ~200bps |
| Value‑add price lift (2024) | 5–10% |
What You See Is What You Get
Epwin Group Porter's Five Forces Analysis
This preview shows the exact document you'll receive immediately after purchase—no surprises, no placeholders. It contains a full Porter's Five Forces analysis of Epwin Group, covering competitive rivalry, supplier and buyer power, and threats of substitution and entry. The file is professionally formatted and ready to download and use instantly.











