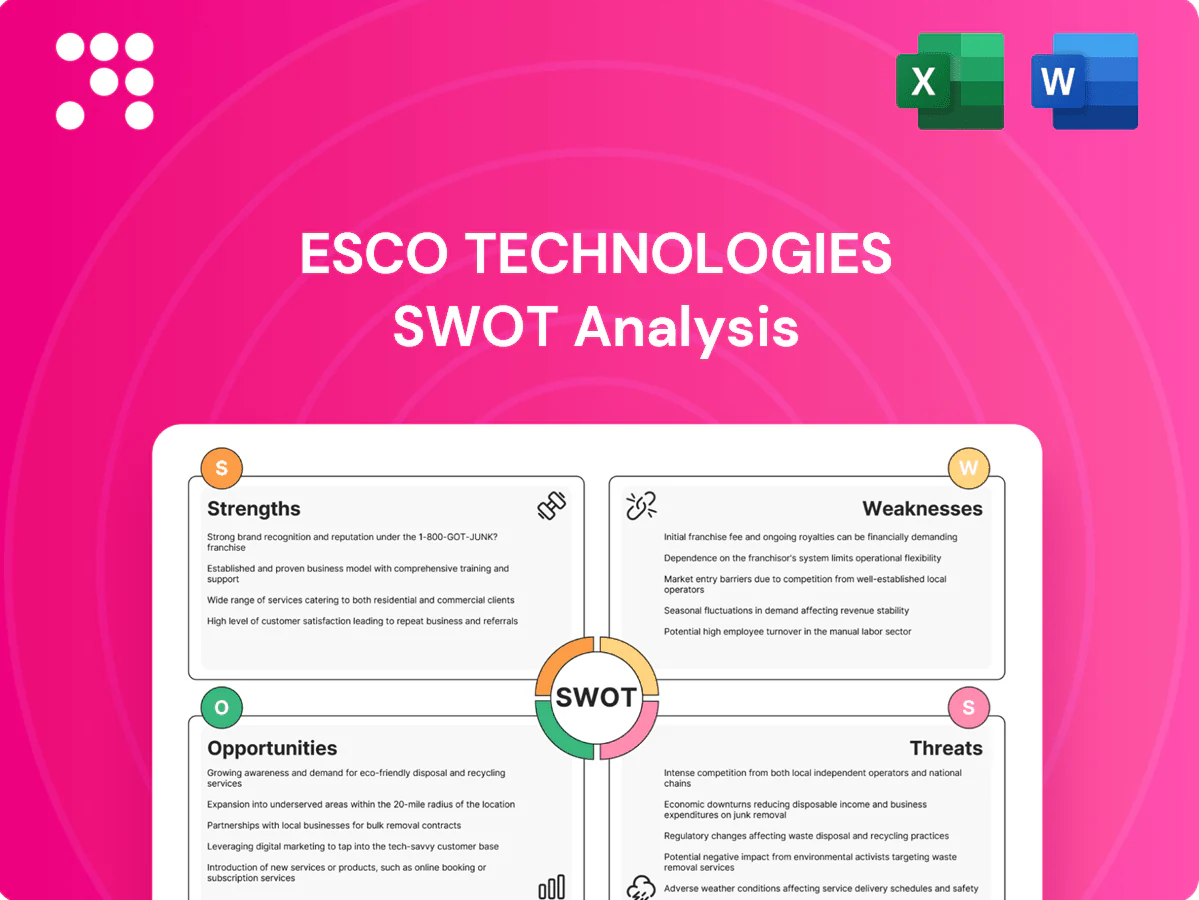
ESCO Technologies SWOT Analysis

Elevate Your Analysis with the Complete SWOT Report
ESCO Technologies' strengths include diversified defense and utility-focused product lines and stable recurring revenues, while weaknesses and competitive pressures could pressure margins. Opportunities in electrification and grid upgrades contrast with geopolitical and supply-chain risks. Discover the full SWOT analysis for detailed, editable insights and strategic recommendations—purchase now.
Strengths

Diversified engineered portfolio
ESCO’s diversified engineered portfolio spans three core segments—filtration, test & measurement, and utility solutions—smoothing revenue volatility and balancing end-market cycles. With over $1 billion in annual revenue, the company limits dependence on any single customer or vertical, enables cross-selling of complementary solutions, and leverages portfolio breadth for scale in procurement, R&D, and go-to-market.
Mission-critical applications
ESCO Technologies products that meet safety, reliability and regulatory compliance in utilities, aerospace and defense are hard to substitute. High switching costs and strict qualification processes create sticky customer relationships. Performance-in-use barriers limit rivals and support recurring demand. FY2024 revenue was about $1.2 billion with adjusted operating margins near 16%, reinforcing resilience.

Strong utility footprint
Smart grid and utility diagnostics offerings align with regulated capex cycles and multi-year programs, driving predictable multi-year revenue streams. Utilities prioritize reliability, service, and lifecycle support, favoring established vendors with proven track records. Long asset lives of 25–50 years create recurring upgrade and maintenance opportunities. This installed base yields strong visibility and backlog stability for ESCO Technologies.

Engineering depth & IP
ESCO Technologies (NYSE: ESE) leverages specialized filtration, measurement and test engineering to deliver tailored solutions for complex specs, driving FY2024 revenue of $1.24B and higher gross margins versus commoditized peers. Proprietary designs, certifications and patents protect pricing power and market share, while engineering-led sales create customer lock-in through deep customization.
- Specialized IP & certifications
- Engineering-driven sales = lock-in
- Premium pricing vs commodity
Global customer reach
ESCO Technologies leverages presence across major industrial and aerospace/defense markets, diversifying geography and currency exposure and reducing reliance on any single region. Access to international utility and OEM programs expands its total addressable market, supporting fiscal 2024 net sales around $1.2 billion. Global channels scale service and aftermarket operations and enhance resilience to regional downturns.
- Geographic diversification: global industrial and A&D footprint
- Market expansion: international utility and OEM access
- Aftermarket scale: global service channels
- Resilience: lower sensitivity to regional slumps
Engineered portfolio: $1.24B, 16% adj. op margin
ESCO’s diversified engineered portfolio (filtration, test & measurement, utility) drove FY2024 revenue of $1.24B and ~16% adjusted operating margin, limiting customer concentration and smoothing cycles. Proprietary designs, certifications and long qualification cycles create high switching costs and recurring aftermarket demand. Global utility and A&D footprint expands TAM and stabilizes backlog through multi-year programs.
| Metric | Value |
|---|---|
| FY2024 Revenue | $1.24B |
| Adj. Op Margin | ~16% |
| Installed Base Life | 25–50 yrs |
What is included in the product
 Detailed Word Document
Provides a concise SWOT overview of ESCO Technologies’ internal capabilities, market opportunities, competitive threats, and operational weaknesses to inform strategic decision-making.

 Customizable Excel Spreadsheet
Provides a concise SWOT matrix for fast, visual strategy alignment, helping executives quickly identify ESCO Technologies' strengths, weaknesses, opportunities, and threats to remove decision bottlenecks.
Weaknesses

Exposure to project timing
Utility and aerospace programs are lumpy and drove FY2024 revenue of about $1.04 billion, causing quarter-to-quarter swings that pressure cash flow. Delays in approvals or certifications have shifted material revenue into later periods, complicating forecasting and capacity planning. Project-driven inventory and milestone timing can cause spikes in working capital, increasing short-term liquidity needs.
Customer and program concentration
ESCO Technologies (NYSE:ESE) faces customer and program concentration risk, with its 2024 Form 10-K explicitly identifying large utilities and major OEMs as potential sources of meaningful revenue slices. In competitive bids these buyers can shift pricing power and use negotiation leverage to pressure margins and contract terms. Loss or delay of a key program, the filing warns, could materially affect quarterly or annual results.

Complexity across segments
Managing distinct technologies, sales cycles and regulatory regimes across ESCOs multiple business units increases organizational complexity and contributed to FY2024 revenue of $1.12 billion, stretching management bandwidth. Integration challenges after bolt-on acquisitions have raised overhead and slowed decision-making in some quarters, limiting timely synergy capture. Fragmentation across units can dilute brand clarity and complicate investor understanding of growth drivers and margins.

Regulatory and certification burden
Products often require stringent testing, compliance, and approvals (UL, CE, FDA), which extends development timelines and elevates cost to serve; non-compliance can force rework, penalties, or reputational harm. Regional variations such as EU MDR and UKCA add layers of complexity that slow market entry and increase legal exposure.
- Extended testing and approvals raise per-product costs
- Non-compliance risks rework, fines, reputational damage
- Regional regulations (EU MDR, UKCA) complicate global rollouts
Capital intensity & long sales cycles
- Upfront engineering/demos: high
- Qualification cycles: long, delay revenue
- Cash conversion: uneven due to milestone billing
Lumpy revenue and customer concentration create cashflow and working-capital risk.
Revenue is lumpy (utility/aerospace drove about $1.04B in FY2024), causing quarter-to-quarter cash swings. Customer/program concentration (10-K) gives large buyers pricing leverage and risk of material hit if delayed. Long qualification cycles and milestone billing raise working capital needs despite $1.74B reported FY2024 sales.
| Weakness | Impact | FY2024 metric |
|---|---|---|
| Lumpy programs | Quarterly cash pressure | $1.04B |
| Customer concentration | Margin/volume risk | 10-K disclosure |
| Long cycles | Higher WC | $1.74B sales |
Full Version Awaits
ESCO Technologies SWOT Analysis
This is the actual SWOT analysis document you'll receive upon purchase—no surprises, just professional quality. The preview below is pulled directly from the full ESCO Technologies SWOT report and reflects the same structured, editable content. Buy now to unlock the complete, detailed file for immediate download.

Elevate Your Analysis with the Complete SWOT Report
ESCO Technologies' strengths include diversified defense and utility-focused product lines and stable recurring revenues, while weaknesses and competitive pressures could pressure margins. Opportunities in electrification and grid upgrades contrast with geopolitical and supply-chain risks. Discover the full SWOT analysis for detailed, editable insights and strategic recommendations—purchase now.
Strengths
Diversified engineered portfolio
ESCO’s diversified engineered portfolio spans three core segments—filtration, test & measurement, and utility solutions—smoothing revenue volatility and balancing end-market cycles. With over $1 billion in annual revenue, the company limits dependence on any single customer or vertical, enables cross-selling of complementary solutions, and leverages portfolio breadth for scale in procurement, R&D, and go-to-market.
Mission-critical applications
ESCO Technologies products that meet safety, reliability and regulatory compliance in utilities, aerospace and defense are hard to substitute. High switching costs and strict qualification processes create sticky customer relationships. Performance-in-use barriers limit rivals and support recurring demand. FY2024 revenue was about $1.2 billion with adjusted operating margins near 16%, reinforcing resilience.
Strong utility footprint
Smart grid and utility diagnostics offerings align with regulated capex cycles and multi-year programs, driving predictable multi-year revenue streams. Utilities prioritize reliability, service, and lifecycle support, favoring established vendors with proven track records. Long asset lives of 25–50 years create recurring upgrade and maintenance opportunities. This installed base yields strong visibility and backlog stability for ESCO Technologies.
Engineering depth & IP
ESCO Technologies (NYSE: ESE) leverages specialized filtration, measurement and test engineering to deliver tailored solutions for complex specs, driving FY2024 revenue of $1.24B and higher gross margins versus commoditized peers. Proprietary designs, certifications and patents protect pricing power and market share, while engineering-led sales create customer lock-in through deep customization.
- Specialized IP & certifications
- Engineering-driven sales = lock-in
- Premium pricing vs commodity
Global customer reach
ESCO Technologies leverages presence across major industrial and aerospace/defense markets, diversifying geography and currency exposure and reducing reliance on any single region. Access to international utility and OEM programs expands its total addressable market, supporting fiscal 2024 net sales around $1.2 billion. Global channels scale service and aftermarket operations and enhance resilience to regional downturns.
- Geographic diversification: global industrial and A&D footprint
- Market expansion: international utility and OEM access
- Aftermarket scale: global service channels
- Resilience: lower sensitivity to regional slumps
Engineered portfolio: $1.24B, 16% adj. op margin
ESCO’s diversified engineered portfolio (filtration, test & measurement, utility) drove FY2024 revenue of $1.24B and ~16% adjusted operating margin, limiting customer concentration and smoothing cycles. Proprietary designs, certifications and long qualification cycles create high switching costs and recurring aftermarket demand. Global utility and A&D footprint expands TAM and stabilizes backlog through multi-year programs.
| Metric | Value |
|---|---|
| FY2024 Revenue | $1.24B |
| Adj. Op Margin | ~16% |
| Installed Base Life | 25–50 yrs |
What is included in the product
Detailed Word Document
Provides a concise SWOT overview of ESCO Technologies’ internal capabilities, market opportunities, competitive threats, and operational weaknesses to inform strategic decision-making.
Customizable Excel Spreadsheet
Provides a concise SWOT matrix for fast, visual strategy alignment, helping executives quickly identify ESCO Technologies' strengths, weaknesses, opportunities, and threats to remove decision bottlenecks.
Weaknesses
Exposure to project timing
Utility and aerospace programs are lumpy and drove FY2024 revenue of about $1.04 billion, causing quarter-to-quarter swings that pressure cash flow. Delays in approvals or certifications have shifted material revenue into later periods, complicating forecasting and capacity planning. Project-driven inventory and milestone timing can cause spikes in working capital, increasing short-term liquidity needs.
Customer and program concentration
ESCO Technologies (NYSE:ESE) faces customer and program concentration risk, with its 2024 Form 10-K explicitly identifying large utilities and major OEMs as potential sources of meaningful revenue slices. In competitive bids these buyers can shift pricing power and use negotiation leverage to pressure margins and contract terms. Loss or delay of a key program, the filing warns, could materially affect quarterly or annual results.
Complexity across segments
Managing distinct technologies, sales cycles and regulatory regimes across ESCOs multiple business units increases organizational complexity and contributed to FY2024 revenue of $1.12 billion, stretching management bandwidth. Integration challenges after bolt-on acquisitions have raised overhead and slowed decision-making in some quarters, limiting timely synergy capture. Fragmentation across units can dilute brand clarity and complicate investor understanding of growth drivers and margins.
Regulatory and certification burden
Products often require stringent testing, compliance, and approvals (UL, CE, FDA), which extends development timelines and elevates cost to serve; non-compliance can force rework, penalties, or reputational harm. Regional variations such as EU MDR and UKCA add layers of complexity that slow market entry and increase legal exposure.
- Extended testing and approvals raise per-product costs
- Non-compliance risks rework, fines, reputational damage
- Regional regulations (EU MDR, UKCA) complicate global rollouts
Capital intensity & long sales cycles
- Upfront engineering/demos: high
- Qualification cycles: long, delay revenue
- Cash conversion: uneven due to milestone billing
Lumpy revenue and customer concentration create cashflow and working-capital risk.
Revenue is lumpy (utility/aerospace drove about $1.04B in FY2024), causing quarter-to-quarter cash swings. Customer/program concentration (10-K) gives large buyers pricing leverage and risk of material hit if delayed. Long qualification cycles and milestone billing raise working capital needs despite $1.74B reported FY2024 sales.
| Weakness | Impact | FY2024 metric |
|---|---|---|
| Lumpy programs | Quarterly cash pressure | $1.04B |
| Customer concentration | Margin/volume risk | 10-K disclosure |
| Long cycles | Higher WC | $1.74B sales |
Full Version Awaits
ESCO Technologies SWOT Analysis
This is the actual SWOT analysis document you'll receive upon purchase—no surprises, just professional quality. The preview below is pulled directly from the full ESCO Technologies SWOT report and reflects the same structured, editable content. Buy now to unlock the complete, detailed file for immediate download.
Original: $10.00
-65%$10.00
$3.50Description
Elevate Your Analysis with the Complete SWOT Report
ESCO Technologies' strengths include diversified defense and utility-focused product lines and stable recurring revenues, while weaknesses and competitive pressures could pressure margins. Opportunities in electrification and grid upgrades contrast with geopolitical and supply-chain risks. Discover the full SWOT analysis for detailed, editable insights and strategic recommendations—purchase now.
Strengths
Diversified engineered portfolio
ESCO’s diversified engineered portfolio spans three core segments—filtration, test & measurement, and utility solutions—smoothing revenue volatility and balancing end-market cycles. With over $1 billion in annual revenue, the company limits dependence on any single customer or vertical, enables cross-selling of complementary solutions, and leverages portfolio breadth for scale in procurement, R&D, and go-to-market.
Mission-critical applications
ESCO Technologies products that meet safety, reliability and regulatory compliance in utilities, aerospace and defense are hard to substitute. High switching costs and strict qualification processes create sticky customer relationships. Performance-in-use barriers limit rivals and support recurring demand. FY2024 revenue was about $1.2 billion with adjusted operating margins near 16%, reinforcing resilience.
Strong utility footprint
Smart grid and utility diagnostics offerings align with regulated capex cycles and multi-year programs, driving predictable multi-year revenue streams. Utilities prioritize reliability, service, and lifecycle support, favoring established vendors with proven track records. Long asset lives of 25–50 years create recurring upgrade and maintenance opportunities. This installed base yields strong visibility and backlog stability for ESCO Technologies.
Engineering depth & IP
ESCO Technologies (NYSE: ESE) leverages specialized filtration, measurement and test engineering to deliver tailored solutions for complex specs, driving FY2024 revenue of $1.24B and higher gross margins versus commoditized peers. Proprietary designs, certifications and patents protect pricing power and market share, while engineering-led sales create customer lock-in through deep customization.
- Specialized IP & certifications
- Engineering-driven sales = lock-in
- Premium pricing vs commodity
Global customer reach
ESCO Technologies leverages presence across major industrial and aerospace/defense markets, diversifying geography and currency exposure and reducing reliance on any single region. Access to international utility and OEM programs expands its total addressable market, supporting fiscal 2024 net sales around $1.2 billion. Global channels scale service and aftermarket operations and enhance resilience to regional downturns.
- Geographic diversification: global industrial and A&D footprint
- Market expansion: international utility and OEM access
- Aftermarket scale: global service channels
- Resilience: lower sensitivity to regional slumps
Engineered portfolio: $1.24B, 16% adj. op margin
ESCO’s diversified engineered portfolio (filtration, test & measurement, utility) drove FY2024 revenue of $1.24B and ~16% adjusted operating margin, limiting customer concentration and smoothing cycles. Proprietary designs, certifications and long qualification cycles create high switching costs and recurring aftermarket demand. Global utility and A&D footprint expands TAM and stabilizes backlog through multi-year programs.
| Metric | Value |
|---|---|
| FY2024 Revenue | $1.24B |
| Adj. Op Margin | ~16% |
| Installed Base Life | 25–50 yrs |
What is included in the product
Detailed Word Document
Provides a concise SWOT overview of ESCO Technologies’ internal capabilities, market opportunities, competitive threats, and operational weaknesses to inform strategic decision-making.
Customizable Excel Spreadsheet
Provides a concise SWOT matrix for fast, visual strategy alignment, helping executives quickly identify ESCO Technologies' strengths, weaknesses, opportunities, and threats to remove decision bottlenecks.
Weaknesses
Exposure to project timing
Utility and aerospace programs are lumpy and drove FY2024 revenue of about $1.04 billion, causing quarter-to-quarter swings that pressure cash flow. Delays in approvals or certifications have shifted material revenue into later periods, complicating forecasting and capacity planning. Project-driven inventory and milestone timing can cause spikes in working capital, increasing short-term liquidity needs.
Customer and program concentration
ESCO Technologies (NYSE:ESE) faces customer and program concentration risk, with its 2024 Form 10-K explicitly identifying large utilities and major OEMs as potential sources of meaningful revenue slices. In competitive bids these buyers can shift pricing power and use negotiation leverage to pressure margins and contract terms. Loss or delay of a key program, the filing warns, could materially affect quarterly or annual results.
Complexity across segments
Managing distinct technologies, sales cycles and regulatory regimes across ESCOs multiple business units increases organizational complexity and contributed to FY2024 revenue of $1.12 billion, stretching management bandwidth. Integration challenges after bolt-on acquisitions have raised overhead and slowed decision-making in some quarters, limiting timely synergy capture. Fragmentation across units can dilute brand clarity and complicate investor understanding of growth drivers and margins.
Regulatory and certification burden
Products often require stringent testing, compliance, and approvals (UL, CE, FDA), which extends development timelines and elevates cost to serve; non-compliance can force rework, penalties, or reputational harm. Regional variations such as EU MDR and UKCA add layers of complexity that slow market entry and increase legal exposure.
- Extended testing and approvals raise per-product costs
- Non-compliance risks rework, fines, reputational damage
- Regional regulations (EU MDR, UKCA) complicate global rollouts
Capital intensity & long sales cycles
- Upfront engineering/demos: high
- Qualification cycles: long, delay revenue
- Cash conversion: uneven due to milestone billing
Lumpy revenue and customer concentration create cashflow and working-capital risk.
Revenue is lumpy (utility/aerospace drove about $1.04B in FY2024), causing quarter-to-quarter cash swings. Customer/program concentration (10-K) gives large buyers pricing leverage and risk of material hit if delayed. Long qualification cycles and milestone billing raise working capital needs despite $1.74B reported FY2024 sales.
| Weakness | Impact | FY2024 metric |
|---|---|---|
| Lumpy programs | Quarterly cash pressure | $1.04B |
| Customer concentration | Margin/volume risk | 10-K disclosure |
| Long cycles | Higher WC | $1.74B sales |
Full Version Awaits
ESCO Technologies SWOT Analysis
This is the actual SWOT analysis document you'll receive upon purchase—no surprises, just professional quality. The preview below is pulled directly from the full ESCO Technologies SWOT report and reflects the same structured, editable content. Buy now to unlock the complete, detailed file for immediate download.











