ESR Boston Consulting Group Matrix

See the Bigger Picture
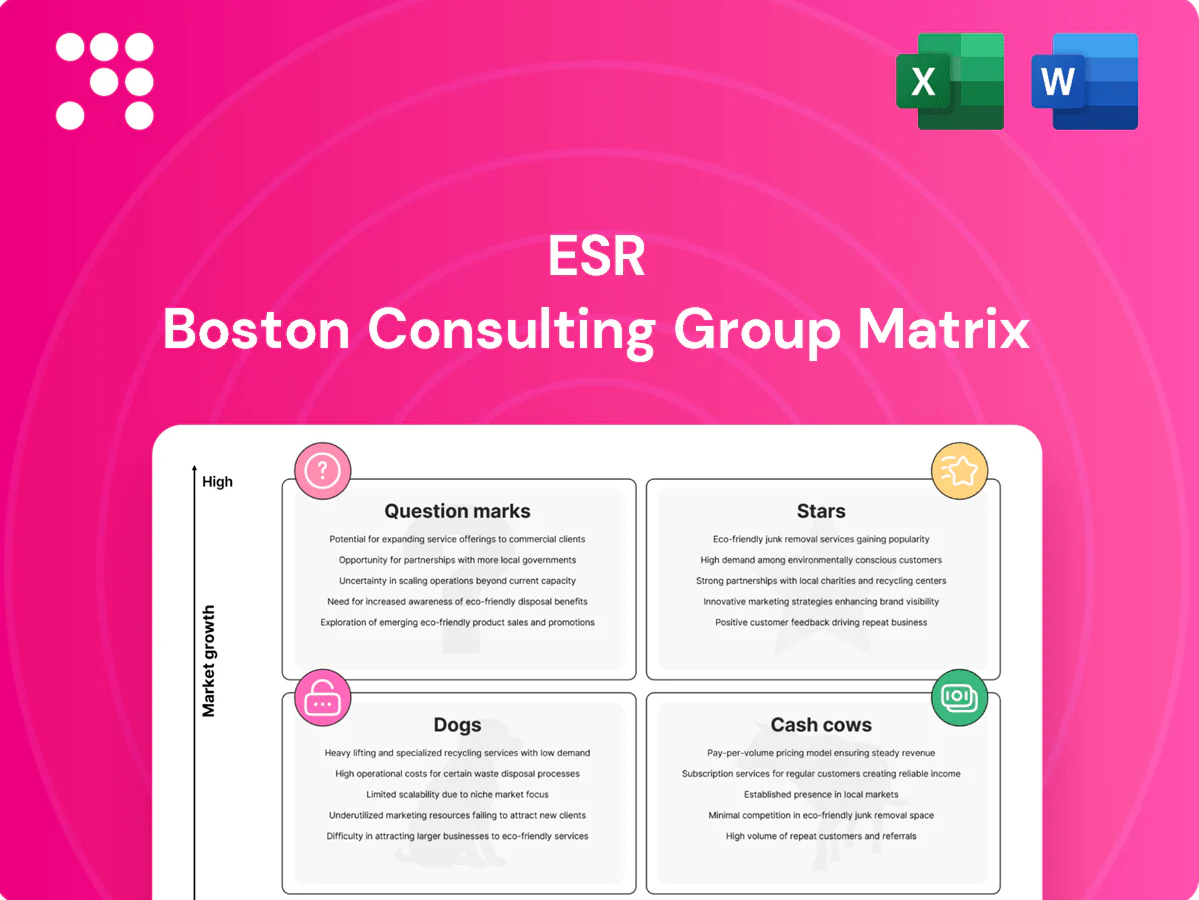
Think you know where this company’s products sit? Our ESR BCG Matrix preview shows the outline—Stars, Cash Cows, Dogs, Question Marks—but the full report gives you quadrant-by-quadrant clarity, data-backed recommendations, and a practical playbook for reallocating capital and prioritizing R&D. Buy the complete BCG Matrix to get a ready-to-present Word report plus an Excel summary so you can act fast and lead with confidence.
Stars

Tier-1 APAC logistics parks
Tier-1 APAC logistics parks (core China, Japan, Australia) report occupancy above 90% and saw mid-single-digit rent growth in 2024, driven by 3PL and e-commerce demand which accounted for roughly 60% of new leases; tight absorption keeps rents firm. Continue feeding the pipeline and upgrading specs to defend market share—these assets are growth engines with path to steady cash generation.
Data center development platform
Cloud, AI and hyperscalers are fueling a land grab—AWS 32%, Microsoft 22% and Google 10% share of the global cloud market in 2024 (Synergy Research), pushing massive campus demand. ESR’s integrated land, power and build capability accelerates site delivery for 10–100 MW campuses and hyperscaler specs. Capital needs are heavy but runway is long; prioritise investments where power and permits are locked to de‑risk deployment.

Last‑mile urban infill warehouses
Same-day delivery remains structural as e-commerce hit about 17% of US retail sales in 2024, driving demand for scarce urban nodes where infill vacancy averaged ~3.2% in top metros. Tight supply and high tenant retention pushed last-mile rent growth roughly 7% y/y in 2024, giving pricing power. Assembling urban sites is capex hungry—transactions and site assembly commonly run $2–8m per site—but returns justify it. Hold existing assets and densify to extend yield and stay ahead.

Institutional capital partnerships
Flagship development JVs with blue-chip LPs are flying in 2024, delivering predictable fee streams and carried interest that compound with portfolio growth. Fee streams plus promote align nicely with scaling economics; disciplined deployment is the gating constraint. If deployment stays disciplined, the model scales efficiently. Double down on partners who move fast and show repeatable execution.
- Priority: fast-moving blue-chip LPs
- Metric: fee + promote per JV
- Risk: deployment discipline
- Action: scale with proven partners
Integrated investment + fund management
Owning the full stack from sourcing to asset management creates speed and proprietary data advantages, enabling faster deployment and tighter risk control; in 2024 global AUM topped 120 trillion USD, amplifying value for managers who win large institutional mandates.
This integrated model forms a durable moat on mandates often >250m USD and, by continuously enhancing analytics and ops, widens the gap versus pure-play managers; this Star seeds future Cash Cows through scale and repeatable returns.
- Full-stack speed: faster deployment and decision cycles
- Data moat: proprietary datasets improve underwriting accuracy
- Large mandates: competitive edge on mandates >250m USD
- Strategy: invest in analytics and ops to convert Star → Cash Cow
Tier1 logistics >90% occ, hyperscalers A32/M22/G10 fuel campus; last-mile rents +7%
Tier‑1 logistics occupancy >90% and mid-single-digit rent growth in 2024; hyperscalers (AWS 32%, Microsoft 22%, Google 10%) drive campus demand; same‑day e‑commerce 17% US and last‑mile rent +7% y/y in 2024; JVs and full‑stack ops scale fee + promote into repeatable cash generation.
| Metric | 2024 | Implication |
|---|---|---|
| Occupancy | >90% | Pricing power |
| Cloud share | A32/M22/G10 | Campus demand |
| E‑commerce | 17% | Last‑mile growth |
| Last‑mile rent | +7% y/y | High yields |
| Global AUM | 120T USD | Large mandates |
What is included in the product
 Detailed Word Document
ESR BCG Matrix: evaluates units as Stars, Cash Cows, Question Marks, Dogs with strategic moves — invest, hold, or divest.

 Customizable Excel Spreadsheet
One-page ESR BCG Matrix pinpointing pain spots and priority bets for faster, clearer portfolio decisions
Cash Cows

Stabilized logistics portfolios
Mature, high-occupancy sheds in balanced markets deliver predictable cash: many core logistics portfolios reported occupancy >95% and stable NOI in 2024. Low capex and steady lease renewals with CPI/indexation support cashflow while prime logistics yields compressed to roughly 4–6% across core markets in 2024 (CBRE/JLL). Optimize operating expenses, minimize tenant churn, and selectively recycle assets at peak pricing to fund growth.
Core funds and REIT management fees
Management and recurring fee income from core funds and REITs arrives like clockwork, with typical management fee yields around 0.5–1.5% on assets under management. The US listed REIT market cap was roughly $1.4 trillion in 2024 and asset managers commonly report operating margins above 50%, reflecting high-margin, sticky cash flow. Maintain performance and compliance, and fees keep compounding into simple, dependable cash flow.

Long‑lease build‑to‑suit assets
Long‑lease build‑to‑suit assets, with WALEs commonly exceeding 10 years in 2024, give credit tenants long visibility and translate to minimal leasing risk and modest upkeep; firms use these steady cash flows to backstop debt and recycle capital into development financing. Harvest returns rather than over‑engineering upgrades to protect yield and liquidity.

Asset management and leasing services
Asset management and leasing services deliver steady day-to-day ops fees that scale with AUM; global AUM topped 100 trillion USD in 2024, making fee income predictable. Process improvements flow directly to operating margin, so standardize playbooks and keep SLAs crisp. It’s quiet, reliable cash you can count on.
- Fees scale with AUM
- Process gains = margin gains
- Standardize playbooks
- Maintain tight SLAs
Selective divestments/recycling gains
Stabilized exits in core markets deliver reliable, repeatable gains when disciplined asset recycling is applied. Not flashy, but consistent: time sales to cap-rate windows and buyer depth to capture recycling gains; industry examples in 2024 show typical exit IRRs of 8–12% and realized value uplift tied to 50–150 bps cap-rate movement. Fuels new growth without balance-sheet strain.
- Core exits: predictable cash generation
- Discipline: repeatability over flash
- Timing: sell into cap-rate windows/buyer depth
- 2024 ranges: 8–12% IRR; 50–150 bps recycling gain
- Outcome: funds growth, conserves leverage
>95% occ, 4-6% yields, WALE >10y
Mature logistics and core funds deliver predictable cash: occupancy >95% and prime yields ~4–6% in 2024, low capex and CPI‑linked rents stabilize NOI. REIT/manager fees compound from $1.4T US REIT market and $100T global AUM. Long WALEs >10 years cut leasing risk; core exits deliver 8–12% IRRs and 50–150bps recycling gains.
| Metric | 2024 Value |
|---|---|
| Occupancy | >95% |
| Prime yields | 4–6% |
| US REIT mkt cap | $1.4T |
| Global AUM | $100T |
| WALE | >10 yrs |
| Exit IRR | 8–12% |
What You See Is What You Get
ESR BCG Matrix
The file you're previewing is the exact ESR BCG Matrix you'll receive after purchase. No watermarks, no demo content—just a fully formatted, strategy-ready report built for clarity and action. It arrives immediately to your inbox and is ready to edit, print, or present. Crafted by industry strategists, it maps your portfolio with market-backed analysis. No surprises—what you see is what you get.

See the Bigger Picture
Think you know where this company’s products sit? Our ESR BCG Matrix preview shows the outline—Stars, Cash Cows, Dogs, Question Marks—but the full report gives you quadrant-by-quadrant clarity, data-backed recommendations, and a practical playbook for reallocating capital and prioritizing R&D. Buy the complete BCG Matrix to get a ready-to-present Word report plus an Excel summary so you can act fast and lead with confidence.
Stars
Tier-1 APAC logistics parks
Tier-1 APAC logistics parks (core China, Japan, Australia) report occupancy above 90% and saw mid-single-digit rent growth in 2024, driven by 3PL and e-commerce demand which accounted for roughly 60% of new leases; tight absorption keeps rents firm. Continue feeding the pipeline and upgrading specs to defend market share—these assets are growth engines with path to steady cash generation.
Data center development platform
Cloud, AI and hyperscalers are fueling a land grab—AWS 32%, Microsoft 22% and Google 10% share of the global cloud market in 2024 (Synergy Research), pushing massive campus demand. ESR’s integrated land, power and build capability accelerates site delivery for 10–100 MW campuses and hyperscaler specs. Capital needs are heavy but runway is long; prioritise investments where power and permits are locked to de‑risk deployment.
Last‑mile urban infill warehouses
Same-day delivery remains structural as e-commerce hit about 17% of US retail sales in 2024, driving demand for scarce urban nodes where infill vacancy averaged ~3.2% in top metros. Tight supply and high tenant retention pushed last-mile rent growth roughly 7% y/y in 2024, giving pricing power. Assembling urban sites is capex hungry—transactions and site assembly commonly run $2–8m per site—but returns justify it. Hold existing assets and densify to extend yield and stay ahead.
Institutional capital partnerships
Flagship development JVs with blue-chip LPs are flying in 2024, delivering predictable fee streams and carried interest that compound with portfolio growth. Fee streams plus promote align nicely with scaling economics; disciplined deployment is the gating constraint. If deployment stays disciplined, the model scales efficiently. Double down on partners who move fast and show repeatable execution.
- Priority: fast-moving blue-chip LPs
- Metric: fee + promote per JV
- Risk: deployment discipline
- Action: scale with proven partners
Integrated investment + fund management
Owning the full stack from sourcing to asset management creates speed and proprietary data advantages, enabling faster deployment and tighter risk control; in 2024 global AUM topped 120 trillion USD, amplifying value for managers who win large institutional mandates.
This integrated model forms a durable moat on mandates often >250m USD and, by continuously enhancing analytics and ops, widens the gap versus pure-play managers; this Star seeds future Cash Cows through scale and repeatable returns.
- Full-stack speed: faster deployment and decision cycles
- Data moat: proprietary datasets improve underwriting accuracy
- Large mandates: competitive edge on mandates >250m USD
- Strategy: invest in analytics and ops to convert Star → Cash Cow
Tier1 logistics >90% occ, hyperscalers A32/M22/G10 fuel campus; last-mile rents +7%
Tier‑1 logistics occupancy >90% and mid-single-digit rent growth in 2024; hyperscalers (AWS 32%, Microsoft 22%, Google 10%) drive campus demand; same‑day e‑commerce 17% US and last‑mile rent +7% y/y in 2024; JVs and full‑stack ops scale fee + promote into repeatable cash generation.
| Metric | 2024 | Implication |
|---|---|---|
| Occupancy | >90% | Pricing power |
| Cloud share | A32/M22/G10 | Campus demand |
| E‑commerce | 17% | Last‑mile growth |
| Last‑mile rent | +7% y/y | High yields |
| Global AUM | 120T USD | Large mandates |
What is included in the product
Detailed Word Document
ESR BCG Matrix: evaluates units as Stars, Cash Cows, Question Marks, Dogs with strategic moves — invest, hold, or divest.
Customizable Excel Spreadsheet
One-page ESR BCG Matrix pinpointing pain spots and priority bets for faster, clearer portfolio decisions
Cash Cows
Stabilized logistics portfolios
Mature, high-occupancy sheds in balanced markets deliver predictable cash: many core logistics portfolios reported occupancy >95% and stable NOI in 2024. Low capex and steady lease renewals with CPI/indexation support cashflow while prime logistics yields compressed to roughly 4–6% across core markets in 2024 (CBRE/JLL). Optimize operating expenses, minimize tenant churn, and selectively recycle assets at peak pricing to fund growth.
Core funds and REIT management fees
Management and recurring fee income from core funds and REITs arrives like clockwork, with typical management fee yields around 0.5–1.5% on assets under management. The US listed REIT market cap was roughly $1.4 trillion in 2024 and asset managers commonly report operating margins above 50%, reflecting high-margin, sticky cash flow. Maintain performance and compliance, and fees keep compounding into simple, dependable cash flow.
Long‑lease build‑to‑suit assets
Long‑lease build‑to‑suit assets, with WALEs commonly exceeding 10 years in 2024, give credit tenants long visibility and translate to minimal leasing risk and modest upkeep; firms use these steady cash flows to backstop debt and recycle capital into development financing. Harvest returns rather than over‑engineering upgrades to protect yield and liquidity.
Asset management and leasing services
Asset management and leasing services deliver steady day-to-day ops fees that scale with AUM; global AUM topped 100 trillion USD in 2024, making fee income predictable. Process improvements flow directly to operating margin, so standardize playbooks and keep SLAs crisp. It’s quiet, reliable cash you can count on.
- Fees scale with AUM
- Process gains = margin gains
- Standardize playbooks
- Maintain tight SLAs
Selective divestments/recycling gains
Stabilized exits in core markets deliver reliable, repeatable gains when disciplined asset recycling is applied. Not flashy, but consistent: time sales to cap-rate windows and buyer depth to capture recycling gains; industry examples in 2024 show typical exit IRRs of 8–12% and realized value uplift tied to 50–150 bps cap-rate movement. Fuels new growth without balance-sheet strain.
- Core exits: predictable cash generation
- Discipline: repeatability over flash
- Timing: sell into cap-rate windows/buyer depth
- 2024 ranges: 8–12% IRR; 50–150 bps recycling gain
- Outcome: funds growth, conserves leverage
>95% occ, 4-6% yields, WALE >10y
Mature logistics and core funds deliver predictable cash: occupancy >95% and prime yields ~4–6% in 2024, low capex and CPI‑linked rents stabilize NOI. REIT/manager fees compound from $1.4T US REIT market and $100T global AUM. Long WALEs >10 years cut leasing risk; core exits deliver 8–12% IRRs and 50–150bps recycling gains.
| Metric | 2024 Value |
|---|---|
| Occupancy | >95% |
| Prime yields | 4–6% |
| US REIT mkt cap | $1.4T |
| Global AUM | $100T |
| WALE | >10 yrs |
| Exit IRR | 8–12% |
What You See Is What You Get
ESR BCG Matrix
The file you're previewing is the exact ESR BCG Matrix you'll receive after purchase. No watermarks, no demo content—just a fully formatted, strategy-ready report built for clarity and action. It arrives immediately to your inbox and is ready to edit, print, or present. Crafted by industry strategists, it maps your portfolio with market-backed analysis. No surprises—what you see is what you get.
Original: $10.00
-65%$10.00
$3.50Description
See the Bigger Picture
Think you know where this company’s products sit? Our ESR BCG Matrix preview shows the outline—Stars, Cash Cows, Dogs, Question Marks—but the full report gives you quadrant-by-quadrant clarity, data-backed recommendations, and a practical playbook for reallocating capital and prioritizing R&D. Buy the complete BCG Matrix to get a ready-to-present Word report plus an Excel summary so you can act fast and lead with confidence.
Stars
Tier-1 APAC logistics parks
Tier-1 APAC logistics parks (core China, Japan, Australia) report occupancy above 90% and saw mid-single-digit rent growth in 2024, driven by 3PL and e-commerce demand which accounted for roughly 60% of new leases; tight absorption keeps rents firm. Continue feeding the pipeline and upgrading specs to defend market share—these assets are growth engines with path to steady cash generation.
Data center development platform
Cloud, AI and hyperscalers are fueling a land grab—AWS 32%, Microsoft 22% and Google 10% share of the global cloud market in 2024 (Synergy Research), pushing massive campus demand. ESR’s integrated land, power and build capability accelerates site delivery for 10–100 MW campuses and hyperscaler specs. Capital needs are heavy but runway is long; prioritise investments where power and permits are locked to de‑risk deployment.
Last‑mile urban infill warehouses
Same-day delivery remains structural as e-commerce hit about 17% of US retail sales in 2024, driving demand for scarce urban nodes where infill vacancy averaged ~3.2% in top metros. Tight supply and high tenant retention pushed last-mile rent growth roughly 7% y/y in 2024, giving pricing power. Assembling urban sites is capex hungry—transactions and site assembly commonly run $2–8m per site—but returns justify it. Hold existing assets and densify to extend yield and stay ahead.
Institutional capital partnerships
Flagship development JVs with blue-chip LPs are flying in 2024, delivering predictable fee streams and carried interest that compound with portfolio growth. Fee streams plus promote align nicely with scaling economics; disciplined deployment is the gating constraint. If deployment stays disciplined, the model scales efficiently. Double down on partners who move fast and show repeatable execution.
- Priority: fast-moving blue-chip LPs
- Metric: fee + promote per JV
- Risk: deployment discipline
- Action: scale with proven partners
Integrated investment + fund management
Owning the full stack from sourcing to asset management creates speed and proprietary data advantages, enabling faster deployment and tighter risk control; in 2024 global AUM topped 120 trillion USD, amplifying value for managers who win large institutional mandates.
This integrated model forms a durable moat on mandates often >250m USD and, by continuously enhancing analytics and ops, widens the gap versus pure-play managers; this Star seeds future Cash Cows through scale and repeatable returns.
- Full-stack speed: faster deployment and decision cycles
- Data moat: proprietary datasets improve underwriting accuracy
- Large mandates: competitive edge on mandates >250m USD
- Strategy: invest in analytics and ops to convert Star → Cash Cow
Tier1 logistics >90% occ, hyperscalers A32/M22/G10 fuel campus; last-mile rents +7%
Tier‑1 logistics occupancy >90% and mid-single-digit rent growth in 2024; hyperscalers (AWS 32%, Microsoft 22%, Google 10%) drive campus demand; same‑day e‑commerce 17% US and last‑mile rent +7% y/y in 2024; JVs and full‑stack ops scale fee + promote into repeatable cash generation.
| Metric | 2024 | Implication |
|---|---|---|
| Occupancy | >90% | Pricing power |
| Cloud share | A32/M22/G10 | Campus demand |
| E‑commerce | 17% | Last‑mile growth |
| Last‑mile rent | +7% y/y | High yields |
| Global AUM | 120T USD | Large mandates |
What is included in the product
Detailed Word Document
ESR BCG Matrix: evaluates units as Stars, Cash Cows, Question Marks, Dogs with strategic moves — invest, hold, or divest.
Customizable Excel Spreadsheet
One-page ESR BCG Matrix pinpointing pain spots and priority bets for faster, clearer portfolio decisions
Cash Cows
Stabilized logistics portfolios
Mature, high-occupancy sheds in balanced markets deliver predictable cash: many core logistics portfolios reported occupancy >95% and stable NOI in 2024. Low capex and steady lease renewals with CPI/indexation support cashflow while prime logistics yields compressed to roughly 4–6% across core markets in 2024 (CBRE/JLL). Optimize operating expenses, minimize tenant churn, and selectively recycle assets at peak pricing to fund growth.
Core funds and REIT management fees
Management and recurring fee income from core funds and REITs arrives like clockwork, with typical management fee yields around 0.5–1.5% on assets under management. The US listed REIT market cap was roughly $1.4 trillion in 2024 and asset managers commonly report operating margins above 50%, reflecting high-margin, sticky cash flow. Maintain performance and compliance, and fees keep compounding into simple, dependable cash flow.
Long‑lease build‑to‑suit assets
Long‑lease build‑to‑suit assets, with WALEs commonly exceeding 10 years in 2024, give credit tenants long visibility and translate to minimal leasing risk and modest upkeep; firms use these steady cash flows to backstop debt and recycle capital into development financing. Harvest returns rather than over‑engineering upgrades to protect yield and liquidity.
Asset management and leasing services
Asset management and leasing services deliver steady day-to-day ops fees that scale with AUM; global AUM topped 100 trillion USD in 2024, making fee income predictable. Process improvements flow directly to operating margin, so standardize playbooks and keep SLAs crisp. It’s quiet, reliable cash you can count on.
- Fees scale with AUM
- Process gains = margin gains
- Standardize playbooks
- Maintain tight SLAs
Selective divestments/recycling gains
Stabilized exits in core markets deliver reliable, repeatable gains when disciplined asset recycling is applied. Not flashy, but consistent: time sales to cap-rate windows and buyer depth to capture recycling gains; industry examples in 2024 show typical exit IRRs of 8–12% and realized value uplift tied to 50–150 bps cap-rate movement. Fuels new growth without balance-sheet strain.
- Core exits: predictable cash generation
- Discipline: repeatability over flash
- Timing: sell into cap-rate windows/buyer depth
- 2024 ranges: 8–12% IRR; 50–150 bps recycling gain
- Outcome: funds growth, conserves leverage
>95% occ, 4-6% yields, WALE >10y
Mature logistics and core funds deliver predictable cash: occupancy >95% and prime yields ~4–6% in 2024, low capex and CPI‑linked rents stabilize NOI. REIT/manager fees compound from $1.4T US REIT market and $100T global AUM. Long WALEs >10 years cut leasing risk; core exits deliver 8–12% IRRs and 50–150bps recycling gains.
| Metric | 2024 Value |
|---|---|
| Occupancy | >95% |
| Prime yields | 4–6% |
| US REIT mkt cap | $1.4T |
| Global AUM | $100T |
| WALE | >10 yrs |
| Exit IRR | 8–12% |
What You See Is What You Get
ESR BCG Matrix
The file you're previewing is the exact ESR BCG Matrix you'll receive after purchase. No watermarks, no demo content—just a fully formatted, strategy-ready report built for clarity and action. It arrives immediately to your inbox and is ready to edit, print, or present. Crafted by industry strategists, it maps your portfolio with market-backed analysis. No surprises—what you see is what you get.











