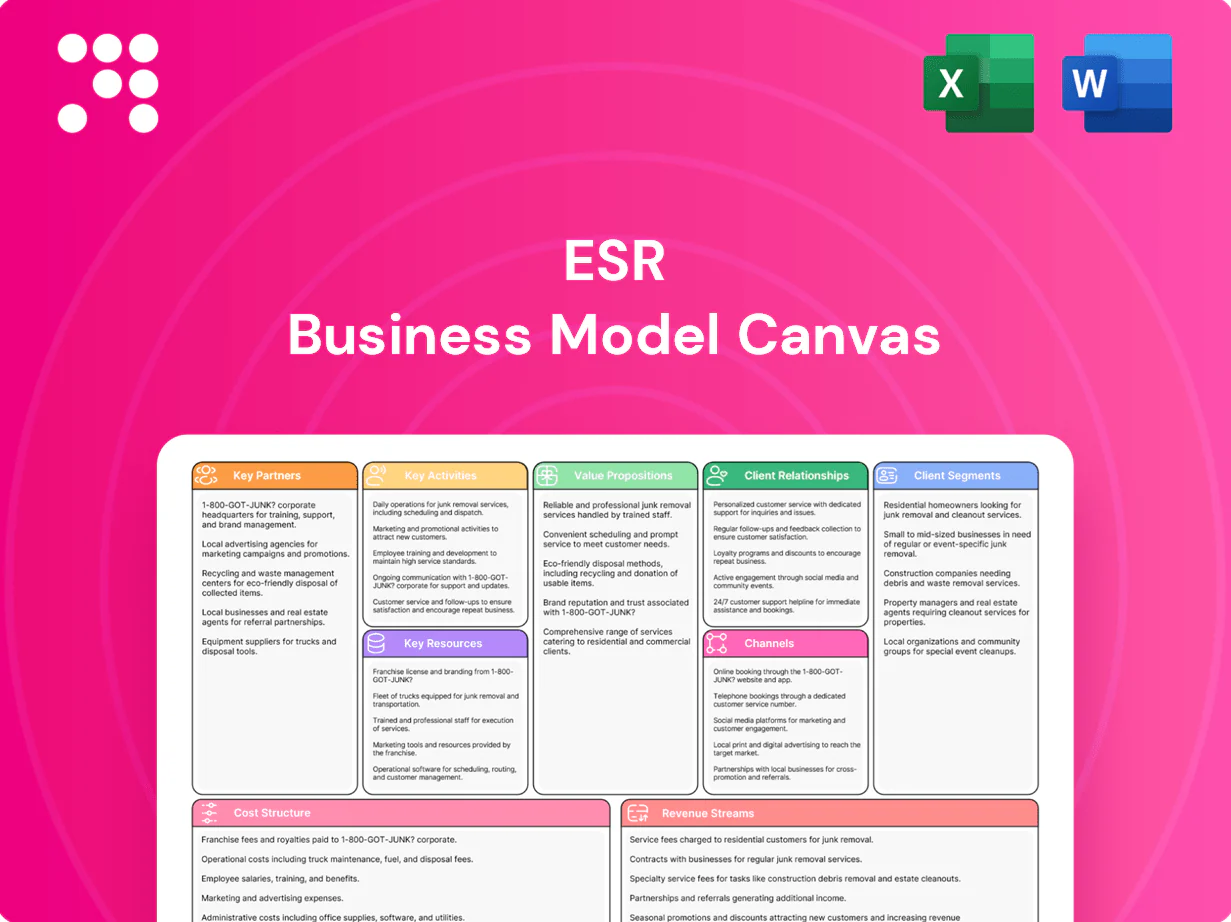
ESR Business Model Canvas

Download the complete Business Model Canvas: editable strategic blueprint for benchmarking
Unlock the full strategic blueprint behind ESR’s business model with our detailed Business Model Canvas—three to five lines won’t capture its depth. This downloadable, editable file breaks down value propositions, customer segments, key partners, revenue streams and cost structure so you can benchmark, plan or pitch with confidence. Purchase the complete canvas to get sector-specific insights and actionable recommendations now.
Partnerships

Institutional LPs & JVs
Co-investments from pensions (global pension assets ≈60 trillion in 2024), sovereign wealth funds (SWFs ≈11.8 trillion in 2024) and insurers provide scale and stable capital, enabling ESR to underwrite large platforms. Joint ventures match asset risk to investor mandates and de-risk executions. Long-duration capital underpins develop-to-core strategies. Alignment structures (co-invest rights, fee/carried alignment) boost performance and pipeline visibility.
Landowners & Governments
Public agencies and private landholders enable site access near urban demand nodes, with 2024 PPP projects reporting site acquisition times cut 30–40% versus standalone deals. Local zoning and permitting moved 30% faster where municipal partnerships existed in 2024 case studies. Fiscal incentives in 2024 reduced upfront capex by up to 20% on average. Collaborations with industrial parks and SEZs in 2024 unlocked bundled power and infrastructure, cutting utility hookup timelines by ~35%.

Design, EPC & Contractors
Tier-1 architects, engineers and builders drive speed, quality and safety across ESR projects, cutting delivery risk and aligning to 2024 compliance standards. Modular construction partners accelerate delivery by up to 50% and lower onsite labor needs, per 2024 industry data. Framework agreements narrow cost variance, improving certainty to single-digit percent ranges. Specialist MEP and data center vendors provide N+1 designs and 99.99% availability for resilient capacity.

Cloud & Network Ecosystem
In 2024 hyperscalers, carriers and IX providers drove over 50% of wholesale data center demand, anchoring long-term leases and capacity planning. Network partnerships reduce median latency by up to 30% via direct on-ramps and peering, expanding connectivity options. Power suppliers and renewable PPAs supplied roughly 40% of data center energy in 2024, lowering uptime and ESG risk. OEM service contracts extend hardware lifecycles to 7–10 years, smoothing capex and maintenance.
- Hyperscalers/carriers: >50% wholesale demand 2024
- Latency: up to 30% reduction via peering
- Energy: ~40% from renewables/PPAs 2024
- OEMs: 7–10 year lifecycle support
Brokerages & 3PL Anchors
Global brokerage firms extend ESR tenant reach across markets, tapping into the 3PL sector that was valued at about US$1.1 trillion in 2024; anchor 3PLs and e-commerce leaders drive pre-leasing and utilization, often securing multi-year commitments. Collaborative planning optimizes racking, docks and throughput, while long-term leases (commonly 7–15 years) stabilize cash flows and enhance valuations.
- Brokerage reach: global networks
- 3PL market: ~US$1.1T (2024)
- Pre-leasing: driven by e-commerce anchors
- Lease tenor: typically 7–15 years
Institutional capital $60T, hyperscalers >50% anchor demand
Co-investors (pensions ≈$60T, SWFs $11.8T in 2024) and insurers provide scale, long-duration capital and co-invest rights aligning returns.
Public/private land partners and PPPs cut site/permitting timelines 30–40% and incentives trimmed upfront capex ~20% in 2024.
Tier-1 builders, modular firms and MEP vendors reduce delivery risk; modular builds +50% speed; OEMs extend hardware 7–10y.
Hyperscalers/carriers >50% wholesale demand; renewables/PPAs ≈40% energy; 3PL market ≈$1.1T (2024).
| Partner | 2024 metric | Impact |
|---|---|---|
| Pensions/SWFs | $60T / $11.8T | Scale, long capital |
| Hyperscalers | >50% demand | Anchor leases |
| 3PL | $1.1T | Pre-leasing |
| Renewables | ~40% energy | ESG/uptime |
What is included in the product
 Detailed Word Document
A comprehensive, pre-written Business Model Canvas tailored to ESR’s strategy, detailing customer segments, value propositions, channels, and revenue streams with real-world operational insights. Ideal for presentations, investor discussions, and strategic decision-making, it includes competitive analysis, SWOT linkage, and a polished layout for internal or external use.

 Customizable Excel Spreadsheet
High-level, editable ESR Business Model Canvas that condenses strategy into a one-page snapshot, saving hours of formatting and enabling fast, shareable collaboration to quickly relieve planning and alignment bottlenecks.
Activities

Development & Acquisition
Source, entitle and assemble sites in infill and gateway locations, leveraging ESR’s scale — AUM of US$128bn in 2024 — to secure pipeline density and accelerate approvals. Execute build-to-suit and speculative developments, delivering millions of sqm annually and targeting stabilized yields above regional benchmarks. Acquire and reposition brownfield assets through value-add capex and ESG upgrades. Scale platforms via disciplined M&A and portfolio roll-ups to expand market share.
Fund & Investment Management
Raise and deploy capital across funds, JVs and REITs, managing a combined AUM exceeding US$60bn in 2024 and raising over US$3bn in new equity that year. Underwrite, structure and balance risk-return profiles with targeted IRRs and stress-tested covenants. Provide comprehensive reporting, governance and compliance aligned to global standards. Optimize portfolio construction by market, sector and duration to enhance yield and liquidity.

Leasing & Customer Solutions
Secure pre-lets and renewals with key accounts, leveraging ESR’s scale—over US$80bn AUM in 2024—to lock long-term cashflows; configure facilities for automation, cold chain and cross-dock requirements; offer scalable power and high-density connectivity for data halls; negotiate flexible, growth-aligned lease terms (phased capacity, CPI indexing, rent-by-usage) to retain and expand tenants.

Operations & Asset Management
Operations & Asset Management runs facilities to 99.9% uptime with LTIFR targets <0.5, executes preventive maintenance and energy optimization programs yielding 10–15% savings, and enforces 24/7 vendor/utilities SLAs with typical 2-hour critical response. Focused asset management drove 2024 logistics occupancy ~96%, ~5% rent reversion and value-add capex targeting >12% project IRR to lift NOI.
- uptime:99.9%
- safety:LTIFR<0.5
- energy:10–15% savings
- SLAs:24/7,2hr critical
- occupancy:~96% (2024)
- rent reversion:~5% (2024)
- capex IRR:>12%
Capital Recycling
Capital recycling stabilizes and seeds ESR core funds and REITs by recycling completed assets into institutional vehicles; in 2024 this approach remained central to unlocking development value and crystallising returns. Monetising developments converts paper gains to cash, which is redeployed into higher-yield pipelines while optimizing the balance sheet for growth and resilience.
- 2024 focus: asset recycling to seed funds/REITs
- Monetise developments to crystallise returns
- Reinvest proceeds into higher-yield projects
- Balance sheet optimisation for growth/resilience
Scale infill/gateway BTR & brownfield reposition to > 12% IRR
Source and develop infill/gateway sites using ESR scale (AUM US$128bn in 2024), execute BTR/speculative builds and brownfield repositioning to target >12% project IRR. Raise/deploy capital via funds, JVs and REITs (funds AUM US$60bn; US$3bn equity raised in 2024), optimize portfolio and recycle assets. Operate assets to 99.9% uptime, 96% occupancy, 10–15% energy savings and ~5% rent reversion (2024).
| Metric | 2024 |
|---|---|
| Total AUM | US$128bn |
| Funds/JVs AUM | US$60bn |
| Equity raised | US$3bn |
| Occupancy | ~96% |
| Uptime | 99.9% |
| Energy savings | 10–15% |
| Rent reversion | ~5% |
| Target capex IRR | >12% |
What You See Is What You Get
Business Model Canvas
The document you're previewing is the exact ESR Business Model Canvas you'll receive after purchase. It's not a mockup—this live preview matches the final file, fully structured and editable. On purchase you'll instantly download the complete document in Word and Excel formats.

Download the complete Business Model Canvas: editable strategic blueprint for benchmarking
Unlock the full strategic blueprint behind ESR’s business model with our detailed Business Model Canvas—three to five lines won’t capture its depth. This downloadable, editable file breaks down value propositions, customer segments, key partners, revenue streams and cost structure so you can benchmark, plan or pitch with confidence. Purchase the complete canvas to get sector-specific insights and actionable recommendations now.
Partnerships
Institutional LPs & JVs
Co-investments from pensions (global pension assets ≈60 trillion in 2024), sovereign wealth funds (SWFs ≈11.8 trillion in 2024) and insurers provide scale and stable capital, enabling ESR to underwrite large platforms. Joint ventures match asset risk to investor mandates and de-risk executions. Long-duration capital underpins develop-to-core strategies. Alignment structures (co-invest rights, fee/carried alignment) boost performance and pipeline visibility.
Landowners & Governments
Public agencies and private landholders enable site access near urban demand nodes, with 2024 PPP projects reporting site acquisition times cut 30–40% versus standalone deals. Local zoning and permitting moved 30% faster where municipal partnerships existed in 2024 case studies. Fiscal incentives in 2024 reduced upfront capex by up to 20% on average. Collaborations with industrial parks and SEZs in 2024 unlocked bundled power and infrastructure, cutting utility hookup timelines by ~35%.
Design, EPC & Contractors
Tier-1 architects, engineers and builders drive speed, quality and safety across ESR projects, cutting delivery risk and aligning to 2024 compliance standards. Modular construction partners accelerate delivery by up to 50% and lower onsite labor needs, per 2024 industry data. Framework agreements narrow cost variance, improving certainty to single-digit percent ranges. Specialist MEP and data center vendors provide N+1 designs and 99.99% availability for resilient capacity.
Cloud & Network Ecosystem
In 2024 hyperscalers, carriers and IX providers drove over 50% of wholesale data center demand, anchoring long-term leases and capacity planning. Network partnerships reduce median latency by up to 30% via direct on-ramps and peering, expanding connectivity options. Power suppliers and renewable PPAs supplied roughly 40% of data center energy in 2024, lowering uptime and ESG risk. OEM service contracts extend hardware lifecycles to 7–10 years, smoothing capex and maintenance.
- Hyperscalers/carriers: >50% wholesale demand 2024
- Latency: up to 30% reduction via peering
- Energy: ~40% from renewables/PPAs 2024
- OEMs: 7–10 year lifecycle support
Brokerages & 3PL Anchors
Global brokerage firms extend ESR tenant reach across markets, tapping into the 3PL sector that was valued at about US$1.1 trillion in 2024; anchor 3PLs and e-commerce leaders drive pre-leasing and utilization, often securing multi-year commitments. Collaborative planning optimizes racking, docks and throughput, while long-term leases (commonly 7–15 years) stabilize cash flows and enhance valuations.
- Brokerage reach: global networks
- 3PL market: ~US$1.1T (2024)
- Pre-leasing: driven by e-commerce anchors
- Lease tenor: typically 7–15 years
Institutional capital $60T, hyperscalers >50% anchor demand
Co-investors (pensions ≈$60T, SWFs $11.8T in 2024) and insurers provide scale, long-duration capital and co-invest rights aligning returns.
Public/private land partners and PPPs cut site/permitting timelines 30–40% and incentives trimmed upfront capex ~20% in 2024.
Tier-1 builders, modular firms and MEP vendors reduce delivery risk; modular builds +50% speed; OEMs extend hardware 7–10y.
Hyperscalers/carriers >50% wholesale demand; renewables/PPAs ≈40% energy; 3PL market ≈$1.1T (2024).
| Partner | 2024 metric | Impact |
|---|---|---|
| Pensions/SWFs | $60T / $11.8T | Scale, long capital |
| Hyperscalers | >50% demand | Anchor leases |
| 3PL | $1.1T | Pre-leasing |
| Renewables | ~40% energy | ESG/uptime |
What is included in the product
Detailed Word Document
A comprehensive, pre-written Business Model Canvas tailored to ESR’s strategy, detailing customer segments, value propositions, channels, and revenue streams with real-world operational insights. Ideal for presentations, investor discussions, and strategic decision-making, it includes competitive analysis, SWOT linkage, and a polished layout for internal or external use.
Customizable Excel Spreadsheet
High-level, editable ESR Business Model Canvas that condenses strategy into a one-page snapshot, saving hours of formatting and enabling fast, shareable collaboration to quickly relieve planning and alignment bottlenecks.
Activities
Development & Acquisition
Source, entitle and assemble sites in infill and gateway locations, leveraging ESR’s scale — AUM of US$128bn in 2024 — to secure pipeline density and accelerate approvals. Execute build-to-suit and speculative developments, delivering millions of sqm annually and targeting stabilized yields above regional benchmarks. Acquire and reposition brownfield assets through value-add capex and ESG upgrades. Scale platforms via disciplined M&A and portfolio roll-ups to expand market share.
Fund & Investment Management
Raise and deploy capital across funds, JVs and REITs, managing a combined AUM exceeding US$60bn in 2024 and raising over US$3bn in new equity that year. Underwrite, structure and balance risk-return profiles with targeted IRRs and stress-tested covenants. Provide comprehensive reporting, governance and compliance aligned to global standards. Optimize portfolio construction by market, sector and duration to enhance yield and liquidity.
Leasing & Customer Solutions
Secure pre-lets and renewals with key accounts, leveraging ESR’s scale—over US$80bn AUM in 2024—to lock long-term cashflows; configure facilities for automation, cold chain and cross-dock requirements; offer scalable power and high-density connectivity for data halls; negotiate flexible, growth-aligned lease terms (phased capacity, CPI indexing, rent-by-usage) to retain and expand tenants.
Operations & Asset Management
Operations & Asset Management runs facilities to 99.9% uptime with LTIFR targets <0.5, executes preventive maintenance and energy optimization programs yielding 10–15% savings, and enforces 24/7 vendor/utilities SLAs with typical 2-hour critical response. Focused asset management drove 2024 logistics occupancy ~96%, ~5% rent reversion and value-add capex targeting >12% project IRR to lift NOI.
- uptime:99.9%
- safety:LTIFR<0.5
- energy:10–15% savings
- SLAs:24/7,2hr critical
- occupancy:~96% (2024)
- rent reversion:~5% (2024)
- capex IRR:>12%
Capital Recycling
Capital recycling stabilizes and seeds ESR core funds and REITs by recycling completed assets into institutional vehicles; in 2024 this approach remained central to unlocking development value and crystallising returns. Monetising developments converts paper gains to cash, which is redeployed into higher-yield pipelines while optimizing the balance sheet for growth and resilience.
- 2024 focus: asset recycling to seed funds/REITs
- Monetise developments to crystallise returns
- Reinvest proceeds into higher-yield projects
- Balance sheet optimisation for growth/resilience
Scale infill/gateway BTR & brownfield reposition to > 12% IRR
Source and develop infill/gateway sites using ESR scale (AUM US$128bn in 2024), execute BTR/speculative builds and brownfield repositioning to target >12% project IRR. Raise/deploy capital via funds, JVs and REITs (funds AUM US$60bn; US$3bn equity raised in 2024), optimize portfolio and recycle assets. Operate assets to 99.9% uptime, 96% occupancy, 10–15% energy savings and ~5% rent reversion (2024).
| Metric | 2024 |
|---|---|
| Total AUM | US$128bn |
| Funds/JVs AUM | US$60bn |
| Equity raised | US$3bn |
| Occupancy | ~96% |
| Uptime | 99.9% |
| Energy savings | 10–15% |
| Rent reversion | ~5% |
| Target capex IRR | >12% |
What You See Is What You Get
Business Model Canvas
The document you're previewing is the exact ESR Business Model Canvas you'll receive after purchase. It's not a mockup—this live preview matches the final file, fully structured and editable. On purchase you'll instantly download the complete document in Word and Excel formats.
Original: $10.00
-65%$10.00
$3.50Description
Download the complete Business Model Canvas: editable strategic blueprint for benchmarking
Unlock the full strategic blueprint behind ESR’s business model with our detailed Business Model Canvas—three to five lines won’t capture its depth. This downloadable, editable file breaks down value propositions, customer segments, key partners, revenue streams and cost structure so you can benchmark, plan or pitch with confidence. Purchase the complete canvas to get sector-specific insights and actionable recommendations now.
Partnerships
Institutional LPs & JVs
Co-investments from pensions (global pension assets ≈60 trillion in 2024), sovereign wealth funds (SWFs ≈11.8 trillion in 2024) and insurers provide scale and stable capital, enabling ESR to underwrite large platforms. Joint ventures match asset risk to investor mandates and de-risk executions. Long-duration capital underpins develop-to-core strategies. Alignment structures (co-invest rights, fee/carried alignment) boost performance and pipeline visibility.
Landowners & Governments
Public agencies and private landholders enable site access near urban demand nodes, with 2024 PPP projects reporting site acquisition times cut 30–40% versus standalone deals. Local zoning and permitting moved 30% faster where municipal partnerships existed in 2024 case studies. Fiscal incentives in 2024 reduced upfront capex by up to 20% on average. Collaborations with industrial parks and SEZs in 2024 unlocked bundled power and infrastructure, cutting utility hookup timelines by ~35%.
Design, EPC & Contractors
Tier-1 architects, engineers and builders drive speed, quality and safety across ESR projects, cutting delivery risk and aligning to 2024 compliance standards. Modular construction partners accelerate delivery by up to 50% and lower onsite labor needs, per 2024 industry data. Framework agreements narrow cost variance, improving certainty to single-digit percent ranges. Specialist MEP and data center vendors provide N+1 designs and 99.99% availability for resilient capacity.
Cloud & Network Ecosystem
In 2024 hyperscalers, carriers and IX providers drove over 50% of wholesale data center demand, anchoring long-term leases and capacity planning. Network partnerships reduce median latency by up to 30% via direct on-ramps and peering, expanding connectivity options. Power suppliers and renewable PPAs supplied roughly 40% of data center energy in 2024, lowering uptime and ESG risk. OEM service contracts extend hardware lifecycles to 7–10 years, smoothing capex and maintenance.
- Hyperscalers/carriers: >50% wholesale demand 2024
- Latency: up to 30% reduction via peering
- Energy: ~40% from renewables/PPAs 2024
- OEMs: 7–10 year lifecycle support
Brokerages & 3PL Anchors
Global brokerage firms extend ESR tenant reach across markets, tapping into the 3PL sector that was valued at about US$1.1 trillion in 2024; anchor 3PLs and e-commerce leaders drive pre-leasing and utilization, often securing multi-year commitments. Collaborative planning optimizes racking, docks and throughput, while long-term leases (commonly 7–15 years) stabilize cash flows and enhance valuations.
- Brokerage reach: global networks
- 3PL market: ~US$1.1T (2024)
- Pre-leasing: driven by e-commerce anchors
- Lease tenor: typically 7–15 years
Institutional capital $60T, hyperscalers >50% anchor demand
Co-investors (pensions ≈$60T, SWFs $11.8T in 2024) and insurers provide scale, long-duration capital and co-invest rights aligning returns.
Public/private land partners and PPPs cut site/permitting timelines 30–40% and incentives trimmed upfront capex ~20% in 2024.
Tier-1 builders, modular firms and MEP vendors reduce delivery risk; modular builds +50% speed; OEMs extend hardware 7–10y.
Hyperscalers/carriers >50% wholesale demand; renewables/PPAs ≈40% energy; 3PL market ≈$1.1T (2024).
| Partner | 2024 metric | Impact |
|---|---|---|
| Pensions/SWFs | $60T / $11.8T | Scale, long capital |
| Hyperscalers | >50% demand | Anchor leases |
| 3PL | $1.1T | Pre-leasing |
| Renewables | ~40% energy | ESG/uptime |
What is included in the product
Detailed Word Document
A comprehensive, pre-written Business Model Canvas tailored to ESR’s strategy, detailing customer segments, value propositions, channels, and revenue streams with real-world operational insights. Ideal for presentations, investor discussions, and strategic decision-making, it includes competitive analysis, SWOT linkage, and a polished layout for internal or external use.
Customizable Excel Spreadsheet
High-level, editable ESR Business Model Canvas that condenses strategy into a one-page snapshot, saving hours of formatting and enabling fast, shareable collaboration to quickly relieve planning and alignment bottlenecks.
Activities
Development & Acquisition
Source, entitle and assemble sites in infill and gateway locations, leveraging ESR’s scale — AUM of US$128bn in 2024 — to secure pipeline density and accelerate approvals. Execute build-to-suit and speculative developments, delivering millions of sqm annually and targeting stabilized yields above regional benchmarks. Acquire and reposition brownfield assets through value-add capex and ESG upgrades. Scale platforms via disciplined M&A and portfolio roll-ups to expand market share.
Fund & Investment Management
Raise and deploy capital across funds, JVs and REITs, managing a combined AUM exceeding US$60bn in 2024 and raising over US$3bn in new equity that year. Underwrite, structure and balance risk-return profiles with targeted IRRs and stress-tested covenants. Provide comprehensive reporting, governance and compliance aligned to global standards. Optimize portfolio construction by market, sector and duration to enhance yield and liquidity.
Leasing & Customer Solutions
Secure pre-lets and renewals with key accounts, leveraging ESR’s scale—over US$80bn AUM in 2024—to lock long-term cashflows; configure facilities for automation, cold chain and cross-dock requirements; offer scalable power and high-density connectivity for data halls; negotiate flexible, growth-aligned lease terms (phased capacity, CPI indexing, rent-by-usage) to retain and expand tenants.
Operations & Asset Management
Operations & Asset Management runs facilities to 99.9% uptime with LTIFR targets <0.5, executes preventive maintenance and energy optimization programs yielding 10–15% savings, and enforces 24/7 vendor/utilities SLAs with typical 2-hour critical response. Focused asset management drove 2024 logistics occupancy ~96%, ~5% rent reversion and value-add capex targeting >12% project IRR to lift NOI.
- uptime:99.9%
- safety:LTIFR<0.5
- energy:10–15% savings
- SLAs:24/7,2hr critical
- occupancy:~96% (2024)
- rent reversion:~5% (2024)
- capex IRR:>12%
Capital Recycling
Capital recycling stabilizes and seeds ESR core funds and REITs by recycling completed assets into institutional vehicles; in 2024 this approach remained central to unlocking development value and crystallising returns. Monetising developments converts paper gains to cash, which is redeployed into higher-yield pipelines while optimizing the balance sheet for growth and resilience.
- 2024 focus: asset recycling to seed funds/REITs
- Monetise developments to crystallise returns
- Reinvest proceeds into higher-yield projects
- Balance sheet optimisation for growth/resilience
Scale infill/gateway BTR & brownfield reposition to > 12% IRR
Source and develop infill/gateway sites using ESR scale (AUM US$128bn in 2024), execute BTR/speculative builds and brownfield repositioning to target >12% project IRR. Raise/deploy capital via funds, JVs and REITs (funds AUM US$60bn; US$3bn equity raised in 2024), optimize portfolio and recycle assets. Operate assets to 99.9% uptime, 96% occupancy, 10–15% energy savings and ~5% rent reversion (2024).
| Metric | 2024 |
|---|---|
| Total AUM | US$128bn |
| Funds/JVs AUM | US$60bn |
| Equity raised | US$3bn |
| Occupancy | ~96% |
| Uptime | 99.9% |
| Energy savings | 10–15% |
| Rent reversion | ~5% |
| Target capex IRR | >12% |
What You See Is What You Get
Business Model Canvas
The document you're previewing is the exact ESR Business Model Canvas you'll receive after purchase. It's not a mockup—this live preview matches the final file, fully structured and editable. On purchase you'll instantly download the complete document in Word and Excel formats.











