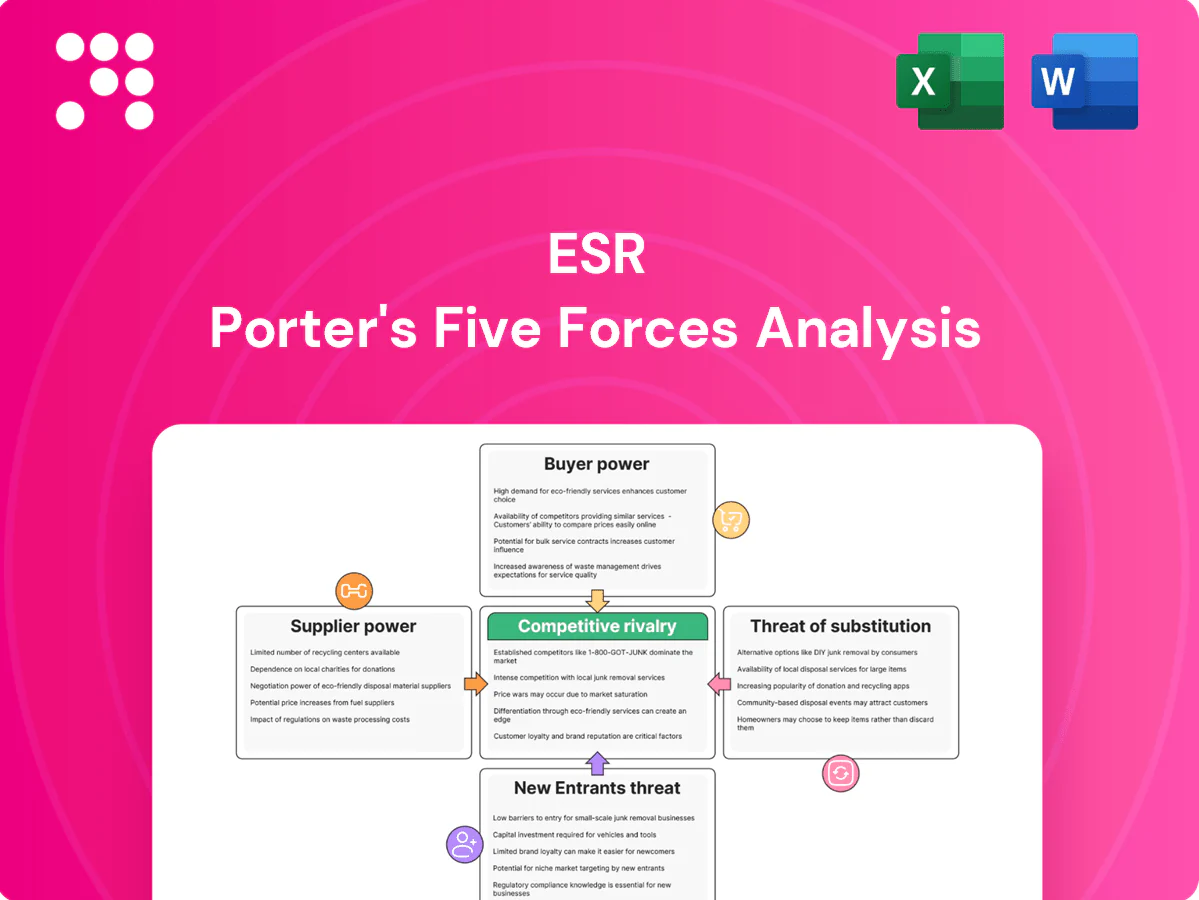
ESR Porter's Five Forces Analysis

Elevate Your Analysis with the Complete Porter's Five Forces Analysis
ESR’s Porter's Five Forces snapshot highlights competitive intensity, supplier and buyer leverage, threat of new entrants, and substitute pressures shaping its logistics and real estate platform. This concise view reveals key strategic vulnerabilities and strengths but only scratches the surface. Unlock the full Porter's Five Forces Analysis for force-by-force ratings, visuals, and actionable recommendations to guide investment or strategy decisions.
Suppliers Bargaining Power

Land and zoning scarcity
Prime industrial and data‑center land near tier‑1 APAC cities is scarce and tightly zoned, giving landowners and governments strong leverage; entitlements and permits in 2024 added months and elevated costs by up to 15–25% in many markets. ESR mitigates via a c.60m sqm GFA landbank and local JV partners, but scarcity still inflates acquisition premiums and slows pipeline.
Power and fiber dependencies
Data centres require high-capacity, reliable power and diverse fiber often controlled by utilities and a few carriers; data centres used about 200 TWh (~1% of global electricity) in 2022, per IEA, underpinning rising grid demand. US transmission interconnection backlogs topped ~1,100 GW in 2023, creating multi-year connection queues and 12–36 month substation lead times that raise supplier bargaining power. Long-term offtake agreements and early utility engagement reduce risk, but persistent grid and fiber bottlenecks can cap growth or force higher capex for dedicated substations and dark fiber buildouts.

Specialized contractors and OEMs
Design-build firms, MEP specialists and OEMs for generators, chillers and switchgear remain concentrated, giving suppliers outsized leverage; 2024 lead times of up to six months and bespoke specifications further strengthen pricing power and contract terms. Framework agreements and multi-sourcing have reduced single-vendor exposure and schedule risk. Nevertheless, ESR remains dependent on top-tier providers for performance, warranties and lifecycle OPEX certainty.

Construction materials volatility
- Steel ~800 USD/ton (2024)
- Cement 90–110 USD/ton (2024)
- Insulation volatility 15–25%
- Escalation clauses common
Facility management tech
BMS/DCIM, automation and security platforms are concentrated among a few global vendors (top 3 vendors hold over 60% market share in 2024), and tight integration plus data lock-in raise switching costs for ESR. ESR pursues open architectures and APIs to dilute supplier power, but mandatory upgrades, annual licenses and certified installer networks still give incumbents leverage and recurring revenue streams.
- Concentration: top 3 >60% (2024)
- Switching costs: integration + data lock-in
- Mitigation: open architectures, API-first
- Residual risk: upgrades/licenses = vendor leverage
Suppliers squeeze: land +15-25%, power/fiber backlogs, steel ~800 USD/ton
Suppliers hold elevated leverage: land scarcity and zoning drove entitlement delays and +15–25% costs in 2024. Power/fiber bottlenecks (data centres ~200 TWh in 2022; US interconnection ~1,100 GW backlog in 2023) raise capex and timelines. Concentrated vendors (top3 BMS >60% in 2024) and materials volatility (steel ~800 USD/ton 2024) sustain pricing power.
| Supplier | Metric | Impact |
|---|---|---|
| Land | Entitlement +15–25% (2024) | Acquisition premiums |
| Power/Fiber | 200 TWh (2022); 1,100 GW backlog (2023) | Multi-year queues |
| Materials | Steel ~800 USD/ton (2024) | Higher capex |
| BMS | Top3 >60% (2024) | High switching costs |
What is included in the product
 Detailed Word Document
Tailored Porter's Five Forces analysis for ESR that uncovers competitive drivers, supplier and buyer power, threats from substitutes and new entrants, and strategic levers to protect market share; fully editable Word format for integration into investor materials, business plans, and internal strategy decks.

 Customizable Excel Spreadsheet
Relieves analysis bottlenecks with a single-sheet ESR Porter's Five Forces summary—quantify and customize competitive pressures, switch scenarios, view instant radar visualization, and export-ready layouts without macros for seamless inclusion in decks, dashboards, or stakeholder reports.
Customers Bargaining Power

Concentrated anchor tenants
Concentrated anchor tenants—large e-commerce players, 3PLs and hyperscalers—lease megasites, concentrating demand and using scale to negotiate rent, incentives and bespoke specs. Public cloud end‑user spending topped about US$608bn in 2024, underpinning hyperscalers' footprint growth and bargaining leverage. ESR mitigates this by diversifying tenant mix and offering multi‑asset portfolios. Nonetheless anchors can still command favorable terms.
Long leases but price sensitive
Long, multi-year leases (typically 5+ years for logistics and even longer for data centres) reduce churn but intensify pre-lease negotiations as tenants benchmark across competing parks and markets; ESR’s scale, locations and service levels preserve pricing power, yet 2024 macro softness increased tenant leverage and expanded concession requests during renewals.

Build-to-suit requirements
Tenants demanding build-to-suit specs for automation, temperature control or higher megawatt density exert strong leverage over design, often requiring bespoke electrical and HVAC that lengthen approvals. Fit-out and ramp timelines — commonly 12–24 weeks for major industrial builds in 2024 — intensify negotiating power as speed-to-operation matters. ESR monetizes via premiums, often up to 20% on bespoke solutions, though customization can compress development margins.

Switching and relocation costs
Operational disruption, capex and latency needs make switching costly for tenants, moderating buyer power post-occupancy; in logistics, network redesign is nontrivial, and in data centers migration risk is high, so ESR leverages high renewal rates and long lease tenors to lock-in customers, though new nearby supply can reopen negotiations.
Institutional investor clients
Institutional LPs exert strong capital-side bargaining power by comparing managers on fees, net IRR and pipeline, pressing fees down and seeking co-invest or mandate rights; top-tier LPs can renegotiate economics and governance despite ESR’s scale and track record. ESR reported approximately US$101.7bn AUM by mid-2024, which supports favorable terms but does not eliminate LP leverage.
- Fees: LP benchmarking drives fee compression
- Co-invest: competitive and often demanded
- Scale: US$101.7bn AUM (mid-2024) strengthens ESR
- Top LPs: can secure enhanced economics/governance
Scale drives lease leverage as cloud spend US$608bn boosts hyperscaler bargaining
Concentrated anchor tenants (e‑commerce, 3PLs, hyperscalers) use scale to secure rent, incentives and bespoke specs; public cloud spend ~US$608bn in 2024 boosts hyperscaler leverage. Long leases lower churn but intensify pre-lease bargaining; 2024 softness raised concession requests. Build-to-suit premiums (~up to 20%) offset customization but compress margins; switching costs sustain renewals.
| Metric | 2024 |
|---|---|
| Public cloud spend | US$608bn |
| ESR AUM (mid‑2024) | US$101.7bn |
| Bespoke premium | ~up to 20% |
What You See Is What You Get
ESR Porter's Five Forces Analysis
This ESR Porter's Five Forces Analysis provides a concise, actionable assessment of competitive dynamics—threat of entrants, supplier and buyer power, substitute pressures, and industry rivalry—tailored to ESR's market context. The document shown is the same professionally written analysis you'll receive—fully formatted and ready to use.

Elevate Your Analysis with the Complete Porter's Five Forces Analysis
ESR’s Porter's Five Forces snapshot highlights competitive intensity, supplier and buyer leverage, threat of new entrants, and substitute pressures shaping its logistics and real estate platform. This concise view reveals key strategic vulnerabilities and strengths but only scratches the surface. Unlock the full Porter's Five Forces Analysis for force-by-force ratings, visuals, and actionable recommendations to guide investment or strategy decisions.
Suppliers Bargaining Power
Land and zoning scarcity
Prime industrial and data‑center land near tier‑1 APAC cities is scarce and tightly zoned, giving landowners and governments strong leverage; entitlements and permits in 2024 added months and elevated costs by up to 15–25% in many markets. ESR mitigates via a c.60m sqm GFA landbank and local JV partners, but scarcity still inflates acquisition premiums and slows pipeline.
Power and fiber dependencies
Data centres require high-capacity, reliable power and diverse fiber often controlled by utilities and a few carriers; data centres used about 200 TWh (~1% of global electricity) in 2022, per IEA, underpinning rising grid demand. US transmission interconnection backlogs topped ~1,100 GW in 2023, creating multi-year connection queues and 12–36 month substation lead times that raise supplier bargaining power. Long-term offtake agreements and early utility engagement reduce risk, but persistent grid and fiber bottlenecks can cap growth or force higher capex for dedicated substations and dark fiber buildouts.
Specialized contractors and OEMs
Design-build firms, MEP specialists and OEMs for generators, chillers and switchgear remain concentrated, giving suppliers outsized leverage; 2024 lead times of up to six months and bespoke specifications further strengthen pricing power and contract terms. Framework agreements and multi-sourcing have reduced single-vendor exposure and schedule risk. Nevertheless, ESR remains dependent on top-tier providers for performance, warranties and lifecycle OPEX certainty.
Construction materials volatility
- Steel ~800 USD/ton (2024)
- Cement 90–110 USD/ton (2024)
- Insulation volatility 15–25%
- Escalation clauses common
Facility management tech
BMS/DCIM, automation and security platforms are concentrated among a few global vendors (top 3 vendors hold over 60% market share in 2024), and tight integration plus data lock-in raise switching costs for ESR. ESR pursues open architectures and APIs to dilute supplier power, but mandatory upgrades, annual licenses and certified installer networks still give incumbents leverage and recurring revenue streams.
- Concentration: top 3 >60% (2024)
- Switching costs: integration + data lock-in
- Mitigation: open architectures, API-first
- Residual risk: upgrades/licenses = vendor leverage
Suppliers squeeze: land +15-25%, power/fiber backlogs, steel ~800 USD/ton
Suppliers hold elevated leverage: land scarcity and zoning drove entitlement delays and +15–25% costs in 2024. Power/fiber bottlenecks (data centres ~200 TWh in 2022; US interconnection ~1,100 GW backlog in 2023) raise capex and timelines. Concentrated vendors (top3 BMS >60% in 2024) and materials volatility (steel ~800 USD/ton 2024) sustain pricing power.
| Supplier | Metric | Impact |
|---|---|---|
| Land | Entitlement +15–25% (2024) | Acquisition premiums |
| Power/Fiber | 200 TWh (2022); 1,100 GW backlog (2023) | Multi-year queues |
| Materials | Steel ~800 USD/ton (2024) | Higher capex |
| BMS | Top3 >60% (2024) | High switching costs |
What is included in the product
Detailed Word Document
Tailored Porter's Five Forces analysis for ESR that uncovers competitive drivers, supplier and buyer power, threats from substitutes and new entrants, and strategic levers to protect market share; fully editable Word format for integration into investor materials, business plans, and internal strategy decks.
Customizable Excel Spreadsheet
Relieves analysis bottlenecks with a single-sheet ESR Porter's Five Forces summary—quantify and customize competitive pressures, switch scenarios, view instant radar visualization, and export-ready layouts without macros for seamless inclusion in decks, dashboards, or stakeholder reports.
Customers Bargaining Power
Concentrated anchor tenants
Concentrated anchor tenants—large e-commerce players, 3PLs and hyperscalers—lease megasites, concentrating demand and using scale to negotiate rent, incentives and bespoke specs. Public cloud end‑user spending topped about US$608bn in 2024, underpinning hyperscalers' footprint growth and bargaining leverage. ESR mitigates this by diversifying tenant mix and offering multi‑asset portfolios. Nonetheless anchors can still command favorable terms.
Long leases but price sensitive
Long, multi-year leases (typically 5+ years for logistics and even longer for data centres) reduce churn but intensify pre-lease negotiations as tenants benchmark across competing parks and markets; ESR’s scale, locations and service levels preserve pricing power, yet 2024 macro softness increased tenant leverage and expanded concession requests during renewals.
Build-to-suit requirements
Tenants demanding build-to-suit specs for automation, temperature control or higher megawatt density exert strong leverage over design, often requiring bespoke electrical and HVAC that lengthen approvals. Fit-out and ramp timelines — commonly 12–24 weeks for major industrial builds in 2024 — intensify negotiating power as speed-to-operation matters. ESR monetizes via premiums, often up to 20% on bespoke solutions, though customization can compress development margins.
Switching and relocation costs
Operational disruption, capex and latency needs make switching costly for tenants, moderating buyer power post-occupancy; in logistics, network redesign is nontrivial, and in data centers migration risk is high, so ESR leverages high renewal rates and long lease tenors to lock-in customers, though new nearby supply can reopen negotiations.
Institutional investor clients
Institutional LPs exert strong capital-side bargaining power by comparing managers on fees, net IRR and pipeline, pressing fees down and seeking co-invest or mandate rights; top-tier LPs can renegotiate economics and governance despite ESR’s scale and track record. ESR reported approximately US$101.7bn AUM by mid-2024, which supports favorable terms but does not eliminate LP leverage.
- Fees: LP benchmarking drives fee compression
- Co-invest: competitive and often demanded
- Scale: US$101.7bn AUM (mid-2024) strengthens ESR
- Top LPs: can secure enhanced economics/governance
Scale drives lease leverage as cloud spend US$608bn boosts hyperscaler bargaining
Concentrated anchor tenants (e‑commerce, 3PLs, hyperscalers) use scale to secure rent, incentives and bespoke specs; public cloud spend ~US$608bn in 2024 boosts hyperscaler leverage. Long leases lower churn but intensify pre-lease bargaining; 2024 softness raised concession requests. Build-to-suit premiums (~up to 20%) offset customization but compress margins; switching costs sustain renewals.
| Metric | 2024 |
|---|---|
| Public cloud spend | US$608bn |
| ESR AUM (mid‑2024) | US$101.7bn |
| Bespoke premium | ~up to 20% |
What You See Is What You Get
ESR Porter's Five Forces Analysis
This ESR Porter's Five Forces Analysis provides a concise, actionable assessment of competitive dynamics—threat of entrants, supplier and buyer power, substitute pressures, and industry rivalry—tailored to ESR's market context. The document shown is the same professionally written analysis you'll receive—fully formatted and ready to use.
Original: $10.00
-65%$10.00
$3.50Description
Elevate Your Analysis with the Complete Porter's Five Forces Analysis
ESR’s Porter's Five Forces snapshot highlights competitive intensity, supplier and buyer leverage, threat of new entrants, and substitute pressures shaping its logistics and real estate platform. This concise view reveals key strategic vulnerabilities and strengths but only scratches the surface. Unlock the full Porter's Five Forces Analysis for force-by-force ratings, visuals, and actionable recommendations to guide investment or strategy decisions.
Suppliers Bargaining Power
Land and zoning scarcity
Prime industrial and data‑center land near tier‑1 APAC cities is scarce and tightly zoned, giving landowners and governments strong leverage; entitlements and permits in 2024 added months and elevated costs by up to 15–25% in many markets. ESR mitigates via a c.60m sqm GFA landbank and local JV partners, but scarcity still inflates acquisition premiums and slows pipeline.
Power and fiber dependencies
Data centres require high-capacity, reliable power and diverse fiber often controlled by utilities and a few carriers; data centres used about 200 TWh (~1% of global electricity) in 2022, per IEA, underpinning rising grid demand. US transmission interconnection backlogs topped ~1,100 GW in 2023, creating multi-year connection queues and 12–36 month substation lead times that raise supplier bargaining power. Long-term offtake agreements and early utility engagement reduce risk, but persistent grid and fiber bottlenecks can cap growth or force higher capex for dedicated substations and dark fiber buildouts.
Specialized contractors and OEMs
Design-build firms, MEP specialists and OEMs for generators, chillers and switchgear remain concentrated, giving suppliers outsized leverage; 2024 lead times of up to six months and bespoke specifications further strengthen pricing power and contract terms. Framework agreements and multi-sourcing have reduced single-vendor exposure and schedule risk. Nevertheless, ESR remains dependent on top-tier providers for performance, warranties and lifecycle OPEX certainty.
Construction materials volatility
- Steel ~800 USD/ton (2024)
- Cement 90–110 USD/ton (2024)
- Insulation volatility 15–25%
- Escalation clauses common
Facility management tech
BMS/DCIM, automation and security platforms are concentrated among a few global vendors (top 3 vendors hold over 60% market share in 2024), and tight integration plus data lock-in raise switching costs for ESR. ESR pursues open architectures and APIs to dilute supplier power, but mandatory upgrades, annual licenses and certified installer networks still give incumbents leverage and recurring revenue streams.
- Concentration: top 3 >60% (2024)
- Switching costs: integration + data lock-in
- Mitigation: open architectures, API-first
- Residual risk: upgrades/licenses = vendor leverage
Suppliers squeeze: land +15-25%, power/fiber backlogs, steel ~800 USD/ton
Suppliers hold elevated leverage: land scarcity and zoning drove entitlement delays and +15–25% costs in 2024. Power/fiber bottlenecks (data centres ~200 TWh in 2022; US interconnection ~1,100 GW backlog in 2023) raise capex and timelines. Concentrated vendors (top3 BMS >60% in 2024) and materials volatility (steel ~800 USD/ton 2024) sustain pricing power.
| Supplier | Metric | Impact |
|---|---|---|
| Land | Entitlement +15–25% (2024) | Acquisition premiums |
| Power/Fiber | 200 TWh (2022); 1,100 GW backlog (2023) | Multi-year queues |
| Materials | Steel ~800 USD/ton (2024) | Higher capex |
| BMS | Top3 >60% (2024) | High switching costs |
What is included in the product
Detailed Word Document
Tailored Porter's Five Forces analysis for ESR that uncovers competitive drivers, supplier and buyer power, threats from substitutes and new entrants, and strategic levers to protect market share; fully editable Word format for integration into investor materials, business plans, and internal strategy decks.
Customizable Excel Spreadsheet
Relieves analysis bottlenecks with a single-sheet ESR Porter's Five Forces summary—quantify and customize competitive pressures, switch scenarios, view instant radar visualization, and export-ready layouts without macros for seamless inclusion in decks, dashboards, or stakeholder reports.
Customers Bargaining Power
Concentrated anchor tenants
Concentrated anchor tenants—large e-commerce players, 3PLs and hyperscalers—lease megasites, concentrating demand and using scale to negotiate rent, incentives and bespoke specs. Public cloud end‑user spending topped about US$608bn in 2024, underpinning hyperscalers' footprint growth and bargaining leverage. ESR mitigates this by diversifying tenant mix and offering multi‑asset portfolios. Nonetheless anchors can still command favorable terms.
Long leases but price sensitive
Long, multi-year leases (typically 5+ years for logistics and even longer for data centres) reduce churn but intensify pre-lease negotiations as tenants benchmark across competing parks and markets; ESR’s scale, locations and service levels preserve pricing power, yet 2024 macro softness increased tenant leverage and expanded concession requests during renewals.
Build-to-suit requirements
Tenants demanding build-to-suit specs for automation, temperature control or higher megawatt density exert strong leverage over design, often requiring bespoke electrical and HVAC that lengthen approvals. Fit-out and ramp timelines — commonly 12–24 weeks for major industrial builds in 2024 — intensify negotiating power as speed-to-operation matters. ESR monetizes via premiums, often up to 20% on bespoke solutions, though customization can compress development margins.
Switching and relocation costs
Operational disruption, capex and latency needs make switching costly for tenants, moderating buyer power post-occupancy; in logistics, network redesign is nontrivial, and in data centers migration risk is high, so ESR leverages high renewal rates and long lease tenors to lock-in customers, though new nearby supply can reopen negotiations.
Institutional investor clients
Institutional LPs exert strong capital-side bargaining power by comparing managers on fees, net IRR and pipeline, pressing fees down and seeking co-invest or mandate rights; top-tier LPs can renegotiate economics and governance despite ESR’s scale and track record. ESR reported approximately US$101.7bn AUM by mid-2024, which supports favorable terms but does not eliminate LP leverage.
- Fees: LP benchmarking drives fee compression
- Co-invest: competitive and often demanded
- Scale: US$101.7bn AUM (mid-2024) strengthens ESR
- Top LPs: can secure enhanced economics/governance
Scale drives lease leverage as cloud spend US$608bn boosts hyperscaler bargaining
Concentrated anchor tenants (e‑commerce, 3PLs, hyperscalers) use scale to secure rent, incentives and bespoke specs; public cloud spend ~US$608bn in 2024 boosts hyperscaler leverage. Long leases lower churn but intensify pre-lease bargaining; 2024 softness raised concession requests. Build-to-suit premiums (~up to 20%) offset customization but compress margins; switching costs sustain renewals.
| Metric | 2024 |
|---|---|
| Public cloud spend | US$608bn |
| ESR AUM (mid‑2024) | US$101.7bn |
| Bespoke premium | ~up to 20% |
What You See Is What You Get
ESR Porter's Five Forces Analysis
This ESR Porter's Five Forces Analysis provides a concise, actionable assessment of competitive dynamics—threat of entrants, supplier and buyer power, substitute pressures, and industry rivalry—tailored to ESR's market context. The document shown is the same professionally written analysis you'll receive—fully formatted and ready to use.











