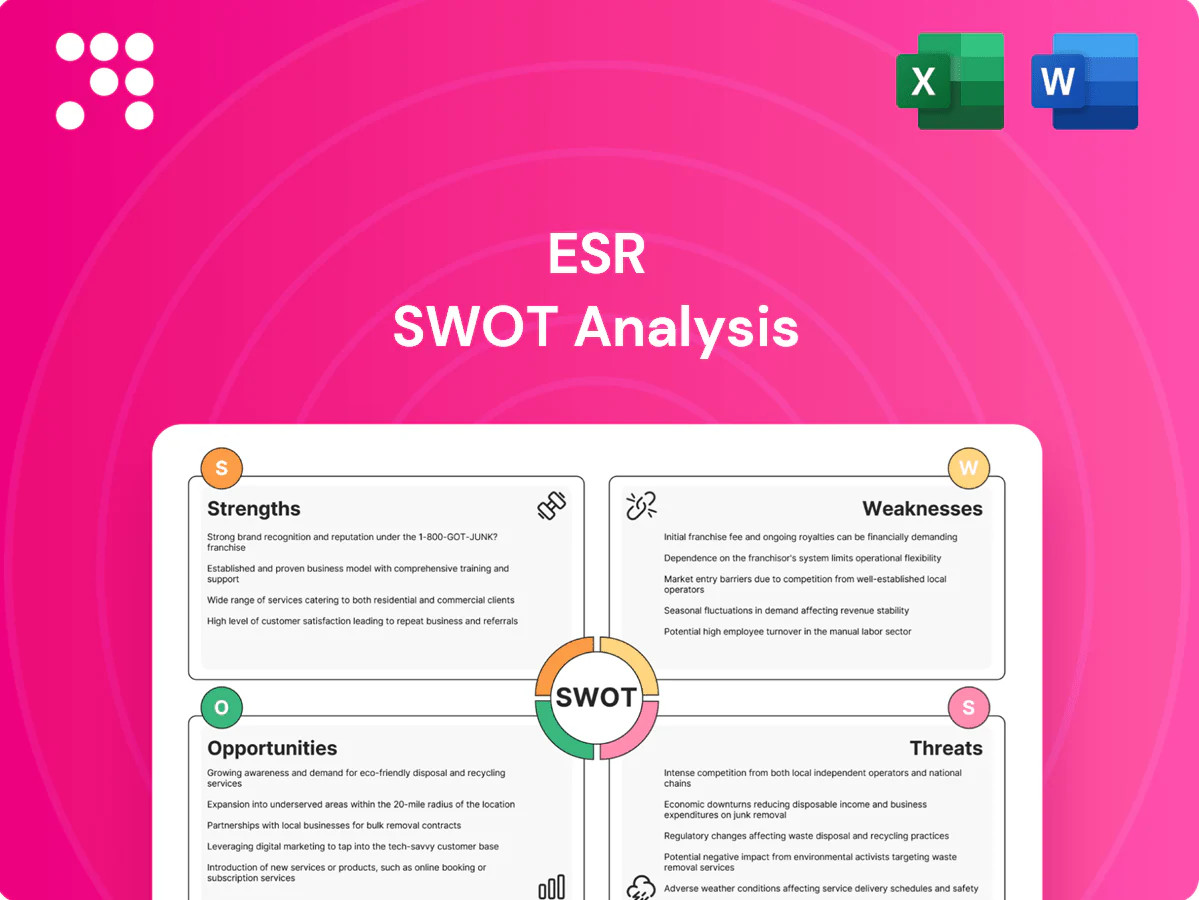
ESR SWOT Analysis

Dive Deeper Into the Company’s Strategic Blueprint
ESR’s SWOT snapshot reveals robust logistics assets, scalable platform advantages, and market tailwinds — but also exposure to cyclical property markets and capital intensity. Want the full strategic view? Purchase the complete SWOT for a research-backed, editable Word + Excel package with actionable recommendations for investors and planners.
Strengths

APAC scale and leadership
ESR is the largest New Economy real estate manager in APAC, leveraging scale economies across development, leasing and operations and managing over US$120 billion AUM following the ARA integration as of 2024.
Its extensive footprint across key logistics and data‑centre markets expands tenant reach and portfolio diversification, supporting cross‑selling to global occupiers.
Scale also secures more favorable financing and stronger bargaining power with contractors and suppliers, reinforcing cost efficiency and margins, and drives strong brand recognition among institutional investors and global tenants.
Integrated investment and fund management platform
The firm combines development, asset management and fund management to capture fees across the asset lifecycle, aligning capital solutions with tenant-led development to boost returns and speed capital deployment. Its vertically integrated model produces recurring management fees that stabilize income relative to pure development profits. This structure enables bespoke strategies for diverse institutional LPs, enhancing fundraising and allocation flexibility.

Blue-chip tenant and investor base
Serving e-commerce, logistics and tech tenants anchors ESR’s high occupancy (96.2% as of Dec 31, 2024) and rental resilience; long-term leases (WALE ~4.8 years) with strong credits cut cash‑flow volatility and support financing. A diversified global institutional investor base (about 85% of capital commitments) underpins fund-raising and improves visibility on pipelines and take-up risk, aiding predictable growth.

Proven development and asset enhancement capabilities
ESR has a proven track record delivering modern logistics parks and hyperscale-ready data center shells, underpinning its development strength; the group reported assets under management of approximately US$89.8 billion as of September 2024. In-house capabilities enable rapid land sourcing, design, and value-add repositioning, while operating know-how drives higher utilization, yields, and better sustainability metrics. These factors support superior risk-adjusted returns across market cycles.
- Development scale: large, repeatable logistics and data center platform
- Integrated model: end-to-end land sourcing to operations
- Performance: higher utilization and yield optimization
- Resilience: supports risk-adjusted returns through cycles
Data- and sustainability-enabled operations
Data-enabled leasing, energy monitoring and portfolio analytics drive 10–20% energy reductions and materially improve margins and tenant experience, while green building standards and on-site renewables increase occupier demand and support 3–7% rent premiums. Sustainability-linked financing has tightened spreads, lowering borrowing costs by notable basis points and attracting ESG-focused LPs, future-proofing assets versus rising regulatory and occupier requirements.
- Energy saving: 10–20% via IoT/EMS
- Rent premium: 3–7% for green-certified assets
- Financing: sustainability-linked spreads compress by bps, boosting LP demand
- Regulatory resilience: reduces retrofit and compliance risk
APAC's largest New Economy real estate manager, ≈US$120bn AUM & 96.2% occupancy
ESR is APAC's largest New Economy real estate manager (≈US$120bn AUM post-ARA, 2024), with integrated development-to-operations scale driving fee diversification and bargaining power. Global logistics/data‑centre footprint supports 96.2% occupancy (Dec 31, 2024) and ~4.8‑year WALE, underpinning rental resilience. Data-enabled sustainability cuts energy 10–20% and supports 3–7% green rent premiums.
| Metric | Value |
|---|---|
| AUM | ≈US$120bn (2024) |
| Occupancy | 96.2% (Dec 31, 2024) |
| WALE | ~4.8 years |
| Energy reduction | 10–20% |
| Green rent premium | 3–7% |
What is included in the product
 Detailed Word Document
Provides a concise SWOT analysis of ESR, mapping internal strengths and weaknesses alongside external opportunities and threats to assess its strategic position, growth drivers, and key risks.

 Customizable Excel Spreadsheet
Provides a focused ESR SWOT matrix that highlights environmental, social, and regulatory pain points for rapid stakeholder alignment. Ideal for executives and analysts needing a concise, actionable snapshot to prioritize mitigation and strategic responses.
Weaknesses

Exposure concentration in APAC
Concentration of ESR's portfolio in APAC (over 80% of assets under management as of 2024) heightens correlation to regional macro and policy risks; China, Japan, Australia and Southeast Asia can move asynchronously, complicating capital allocation across cycles. Currency volatility—USD/CNY and AUD swings of 5–8% in 2023–24—adds translation risk for USD or HKD investors. Diversification outside APAC remains limited.
Interest rate and cap rate sensitivity
Logistics and data centers are long-duration assets highly sensitive to discount-rate shifts; US 10-year yields near 4.2% (July 2025) have driven cap rates wider by roughly 100–200 bps since 2021, pressuring valuations and development feasibility. Higher rates raise refinancing costs and slow deal flow—global CRE transactions remain ~30–40% below 2021 peaks—so rental growth often lags yield expansion. Slower transactions compress fee-bearing AUM growth and management fees as acquisitions decline.

Development intensity and execution risk
Data center and large-scale logistics projects require heavy capex and specialist execution; industry estimates in 2024 put data center construction costs around $7–12m per MW, magnifying exposure to delays and overruns. Delays, power or permitting bottlenecks and insufficient pre-leasing can materially impair returns and extend payback. Power procurement and pre-lease thresholds are critical gating factors; pipeline slippage also reduces fee-bearing AUM and can force crystallization events.

Complex multi-vehicle structure
- Governance complexity
- Fee pressure ~45% LP concessions
- Sponsor/co-investor friction
- Higher compliance/reporting burden
Tenant sector cyclicality
ESR exposure to e-commerce and 3PL is vulnerable if consumer spending or trade slows; global e-commerce was about $6.3 trillion in 2023 and major platforms (Amazon ~38% US share 2023) drive demand. Data center take-up follows tech cycles, lengthening leasing timing. Strong credit quality contrasts with concentration in a few large tenants, raising renewal and backfill risk in weak markets.
- e-commerce exposure: $6.3T (2023)
- platform concentration: Amazon ~38% US e‑commerce (2023)
- tech cycle risk: affects data center take‑up timing
- renewal/backfill risk: elevated with tenant concentration
APAC-heavy logistics and data center funds face FX, rate and capex shocks
ESR is >80% APAC-concentrated (AUM ~US$124bn mid-2024), raising regional policy and FX risk; USD/CNY and AUD swings 2023–24 were ~5–8%. Long-duration logistics/data centers face higher rates (US 10yr ~4.2% Jul 2025), widening cap rates and compressing valuations. Heavy capex (data centers $7–12m/MW 2024), LP fee pressure (~45% demand concessions) and complex governance raise execution and reporting risk.
| Metric | Value |
|---|---|
| APAC share | >80% |
| AUM | US$124bn (mid-2024) |
| US 10yr | ~4.2% (Jul 2025) |
| DC cost | $7–12m/MW (2024) |
| LP fee pressure | ~45% |
What You See Is What You Get
ESR SWOT Analysis
This is the actual ESR SWOT analysis document you’ll receive upon purchase—no surprises, just professional quality. The preview below is taken directly from the full SWOT report you'll get, and it reflects the real, structured analysis of ESR's strengths, weaknesses, opportunities, and threats. Buy now to unlock the complete, editable version.

Dive Deeper Into the Company’s Strategic Blueprint
ESR’s SWOT snapshot reveals robust logistics assets, scalable platform advantages, and market tailwinds — but also exposure to cyclical property markets and capital intensity. Want the full strategic view? Purchase the complete SWOT for a research-backed, editable Word + Excel package with actionable recommendations for investors and planners.
Strengths
APAC scale and leadership
ESR is the largest New Economy real estate manager in APAC, leveraging scale economies across development, leasing and operations and managing over US$120 billion AUM following the ARA integration as of 2024.
Its extensive footprint across key logistics and data‑centre markets expands tenant reach and portfolio diversification, supporting cross‑selling to global occupiers.
Scale also secures more favorable financing and stronger bargaining power with contractors and suppliers, reinforcing cost efficiency and margins, and drives strong brand recognition among institutional investors and global tenants.
Integrated investment and fund management platform
The firm combines development, asset management and fund management to capture fees across the asset lifecycle, aligning capital solutions with tenant-led development to boost returns and speed capital deployment. Its vertically integrated model produces recurring management fees that stabilize income relative to pure development profits. This structure enables bespoke strategies for diverse institutional LPs, enhancing fundraising and allocation flexibility.
Blue-chip tenant and investor base
Serving e-commerce, logistics and tech tenants anchors ESR’s high occupancy (96.2% as of Dec 31, 2024) and rental resilience; long-term leases (WALE ~4.8 years) with strong credits cut cash‑flow volatility and support financing. A diversified global institutional investor base (about 85% of capital commitments) underpins fund-raising and improves visibility on pipelines and take-up risk, aiding predictable growth.
Proven development and asset enhancement capabilities
ESR has a proven track record delivering modern logistics parks and hyperscale-ready data center shells, underpinning its development strength; the group reported assets under management of approximately US$89.8 billion as of September 2024. In-house capabilities enable rapid land sourcing, design, and value-add repositioning, while operating know-how drives higher utilization, yields, and better sustainability metrics. These factors support superior risk-adjusted returns across market cycles.
- Development scale: large, repeatable logistics and data center platform
- Integrated model: end-to-end land sourcing to operations
- Performance: higher utilization and yield optimization
- Resilience: supports risk-adjusted returns through cycles
Data- and sustainability-enabled operations
Data-enabled leasing, energy monitoring and portfolio analytics drive 10–20% energy reductions and materially improve margins and tenant experience, while green building standards and on-site renewables increase occupier demand and support 3–7% rent premiums. Sustainability-linked financing has tightened spreads, lowering borrowing costs by notable basis points and attracting ESG-focused LPs, future-proofing assets versus rising regulatory and occupier requirements.
- Energy saving: 10–20% via IoT/EMS
- Rent premium: 3–7% for green-certified assets
- Financing: sustainability-linked spreads compress by bps, boosting LP demand
- Regulatory resilience: reduces retrofit and compliance risk
APAC's largest New Economy real estate manager, ≈US$120bn AUM & 96.2% occupancy
ESR is APAC's largest New Economy real estate manager (≈US$120bn AUM post-ARA, 2024), with integrated development-to-operations scale driving fee diversification and bargaining power. Global logistics/data‑centre footprint supports 96.2% occupancy (Dec 31, 2024) and ~4.8‑year WALE, underpinning rental resilience. Data-enabled sustainability cuts energy 10–20% and supports 3–7% green rent premiums.
| Metric | Value |
|---|---|
| AUM | ≈US$120bn (2024) |
| Occupancy | 96.2% (Dec 31, 2024) |
| WALE | ~4.8 years |
| Energy reduction | 10–20% |
| Green rent premium | 3–7% |
What is included in the product
Detailed Word Document
Provides a concise SWOT analysis of ESR, mapping internal strengths and weaknesses alongside external opportunities and threats to assess its strategic position, growth drivers, and key risks.
Customizable Excel Spreadsheet
Provides a focused ESR SWOT matrix that highlights environmental, social, and regulatory pain points for rapid stakeholder alignment. Ideal for executives and analysts needing a concise, actionable snapshot to prioritize mitigation and strategic responses.
Weaknesses
Exposure concentration in APAC
Concentration of ESR's portfolio in APAC (over 80% of assets under management as of 2024) heightens correlation to regional macro and policy risks; China, Japan, Australia and Southeast Asia can move asynchronously, complicating capital allocation across cycles. Currency volatility—USD/CNY and AUD swings of 5–8% in 2023–24—adds translation risk for USD or HKD investors. Diversification outside APAC remains limited.
Interest rate and cap rate sensitivity
Logistics and data centers are long-duration assets highly sensitive to discount-rate shifts; US 10-year yields near 4.2% (July 2025) have driven cap rates wider by roughly 100–200 bps since 2021, pressuring valuations and development feasibility. Higher rates raise refinancing costs and slow deal flow—global CRE transactions remain ~30–40% below 2021 peaks—so rental growth often lags yield expansion. Slower transactions compress fee-bearing AUM growth and management fees as acquisitions decline.
Development intensity and execution risk
Data center and large-scale logistics projects require heavy capex and specialist execution; industry estimates in 2024 put data center construction costs around $7–12m per MW, magnifying exposure to delays and overruns. Delays, power or permitting bottlenecks and insufficient pre-leasing can materially impair returns and extend payback. Power procurement and pre-lease thresholds are critical gating factors; pipeline slippage also reduces fee-bearing AUM and can force crystallization events.
Complex multi-vehicle structure
- Governance complexity
- Fee pressure ~45% LP concessions
- Sponsor/co-investor friction
- Higher compliance/reporting burden
Tenant sector cyclicality
ESR exposure to e-commerce and 3PL is vulnerable if consumer spending or trade slows; global e-commerce was about $6.3 trillion in 2023 and major platforms (Amazon ~38% US share 2023) drive demand. Data center take-up follows tech cycles, lengthening leasing timing. Strong credit quality contrasts with concentration in a few large tenants, raising renewal and backfill risk in weak markets.
- e-commerce exposure: $6.3T (2023)
- platform concentration: Amazon ~38% US e‑commerce (2023)
- tech cycle risk: affects data center take‑up timing
- renewal/backfill risk: elevated with tenant concentration
APAC-heavy logistics and data center funds face FX, rate and capex shocks
ESR is >80% APAC-concentrated (AUM ~US$124bn mid-2024), raising regional policy and FX risk; USD/CNY and AUD swings 2023–24 were ~5–8%. Long-duration logistics/data centers face higher rates (US 10yr ~4.2% Jul 2025), widening cap rates and compressing valuations. Heavy capex (data centers $7–12m/MW 2024), LP fee pressure (~45% demand concessions) and complex governance raise execution and reporting risk.
| Metric | Value |
|---|---|
| APAC share | >80% |
| AUM | US$124bn (mid-2024) |
| US 10yr | ~4.2% (Jul 2025) |
| DC cost | $7–12m/MW (2024) |
| LP fee pressure | ~45% |
What You See Is What You Get
ESR SWOT Analysis
This is the actual ESR SWOT analysis document you’ll receive upon purchase—no surprises, just professional quality. The preview below is taken directly from the full SWOT report you'll get, and it reflects the real, structured analysis of ESR's strengths, weaknesses, opportunities, and threats. Buy now to unlock the complete, editable version.
Description
Dive Deeper Into the Company’s Strategic Blueprint
ESR’s SWOT snapshot reveals robust logistics assets, scalable platform advantages, and market tailwinds — but also exposure to cyclical property markets and capital intensity. Want the full strategic view? Purchase the complete SWOT for a research-backed, editable Word + Excel package with actionable recommendations for investors and planners.
Strengths
APAC scale and leadership
ESR is the largest New Economy real estate manager in APAC, leveraging scale economies across development, leasing and operations and managing over US$120 billion AUM following the ARA integration as of 2024.
Its extensive footprint across key logistics and data‑centre markets expands tenant reach and portfolio diversification, supporting cross‑selling to global occupiers.
Scale also secures more favorable financing and stronger bargaining power with contractors and suppliers, reinforcing cost efficiency and margins, and drives strong brand recognition among institutional investors and global tenants.
Integrated investment and fund management platform
The firm combines development, asset management and fund management to capture fees across the asset lifecycle, aligning capital solutions with tenant-led development to boost returns and speed capital deployment. Its vertically integrated model produces recurring management fees that stabilize income relative to pure development profits. This structure enables bespoke strategies for diverse institutional LPs, enhancing fundraising and allocation flexibility.
Blue-chip tenant and investor base
Serving e-commerce, logistics and tech tenants anchors ESR’s high occupancy (96.2% as of Dec 31, 2024) and rental resilience; long-term leases (WALE ~4.8 years) with strong credits cut cash‑flow volatility and support financing. A diversified global institutional investor base (about 85% of capital commitments) underpins fund-raising and improves visibility on pipelines and take-up risk, aiding predictable growth.
Proven development and asset enhancement capabilities
ESR has a proven track record delivering modern logistics parks and hyperscale-ready data center shells, underpinning its development strength; the group reported assets under management of approximately US$89.8 billion as of September 2024. In-house capabilities enable rapid land sourcing, design, and value-add repositioning, while operating know-how drives higher utilization, yields, and better sustainability metrics. These factors support superior risk-adjusted returns across market cycles.
- Development scale: large, repeatable logistics and data center platform
- Integrated model: end-to-end land sourcing to operations
- Performance: higher utilization and yield optimization
- Resilience: supports risk-adjusted returns through cycles
Data- and sustainability-enabled operations
Data-enabled leasing, energy monitoring and portfolio analytics drive 10–20% energy reductions and materially improve margins and tenant experience, while green building standards and on-site renewables increase occupier demand and support 3–7% rent premiums. Sustainability-linked financing has tightened spreads, lowering borrowing costs by notable basis points and attracting ESG-focused LPs, future-proofing assets versus rising regulatory and occupier requirements.
- Energy saving: 10–20% via IoT/EMS
- Rent premium: 3–7% for green-certified assets
- Financing: sustainability-linked spreads compress by bps, boosting LP demand
- Regulatory resilience: reduces retrofit and compliance risk
APAC's largest New Economy real estate manager, ≈US$120bn AUM & 96.2% occupancy
ESR is APAC's largest New Economy real estate manager (≈US$120bn AUM post-ARA, 2024), with integrated development-to-operations scale driving fee diversification and bargaining power. Global logistics/data‑centre footprint supports 96.2% occupancy (Dec 31, 2024) and ~4.8‑year WALE, underpinning rental resilience. Data-enabled sustainability cuts energy 10–20% and supports 3–7% green rent premiums.
| Metric | Value |
|---|---|
| AUM | ≈US$120bn (2024) |
| Occupancy | 96.2% (Dec 31, 2024) |
| WALE | ~4.8 years |
| Energy reduction | 10–20% |
| Green rent premium | 3–7% |
What is included in the product
Detailed Word Document
Provides a concise SWOT analysis of ESR, mapping internal strengths and weaknesses alongside external opportunities and threats to assess its strategic position, growth drivers, and key risks.
Customizable Excel Spreadsheet
Provides a focused ESR SWOT matrix that highlights environmental, social, and regulatory pain points for rapid stakeholder alignment. Ideal for executives and analysts needing a concise, actionable snapshot to prioritize mitigation and strategic responses.
Weaknesses
Exposure concentration in APAC
Concentration of ESR's portfolio in APAC (over 80% of assets under management as of 2024) heightens correlation to regional macro and policy risks; China, Japan, Australia and Southeast Asia can move asynchronously, complicating capital allocation across cycles. Currency volatility—USD/CNY and AUD swings of 5–8% in 2023–24—adds translation risk for USD or HKD investors. Diversification outside APAC remains limited.
Interest rate and cap rate sensitivity
Logistics and data centers are long-duration assets highly sensitive to discount-rate shifts; US 10-year yields near 4.2% (July 2025) have driven cap rates wider by roughly 100–200 bps since 2021, pressuring valuations and development feasibility. Higher rates raise refinancing costs and slow deal flow—global CRE transactions remain ~30–40% below 2021 peaks—so rental growth often lags yield expansion. Slower transactions compress fee-bearing AUM growth and management fees as acquisitions decline.
Development intensity and execution risk
Data center and large-scale logistics projects require heavy capex and specialist execution; industry estimates in 2024 put data center construction costs around $7–12m per MW, magnifying exposure to delays and overruns. Delays, power or permitting bottlenecks and insufficient pre-leasing can materially impair returns and extend payback. Power procurement and pre-lease thresholds are critical gating factors; pipeline slippage also reduces fee-bearing AUM and can force crystallization events.
Complex multi-vehicle structure
- Governance complexity
- Fee pressure ~45% LP concessions
- Sponsor/co-investor friction
- Higher compliance/reporting burden
Tenant sector cyclicality
ESR exposure to e-commerce and 3PL is vulnerable if consumer spending or trade slows; global e-commerce was about $6.3 trillion in 2023 and major platforms (Amazon ~38% US share 2023) drive demand. Data center take-up follows tech cycles, lengthening leasing timing. Strong credit quality contrasts with concentration in a few large tenants, raising renewal and backfill risk in weak markets.
- e-commerce exposure: $6.3T (2023)
- platform concentration: Amazon ~38% US e‑commerce (2023)
- tech cycle risk: affects data center take‑up timing
- renewal/backfill risk: elevated with tenant concentration
APAC-heavy logistics and data center funds face FX, rate and capex shocks
ESR is >80% APAC-concentrated (AUM ~US$124bn mid-2024), raising regional policy and FX risk; USD/CNY and AUD swings 2023–24 were ~5–8%. Long-duration logistics/data centers face higher rates (US 10yr ~4.2% Jul 2025), widening cap rates and compressing valuations. Heavy capex (data centers $7–12m/MW 2024), LP fee pressure (~45% demand concessions) and complex governance raise execution and reporting risk.
| Metric | Value |
|---|---|
| APAC share | >80% |
| AUM | US$124bn (mid-2024) |
| US 10yr | ~4.2% (Jul 2025) |
| DC cost | $7–12m/MW (2024) |
| LP fee pressure | ~45% |
What You See Is What You Get
ESR SWOT Analysis
This is the actual ESR SWOT analysis document you’ll receive upon purchase—no surprises, just professional quality. The preview below is taken directly from the full SWOT report you'll get, and it reflects the real, structured analysis of ESR's strengths, weaknesses, opportunities, and threats. Buy now to unlock the complete, editable version.











