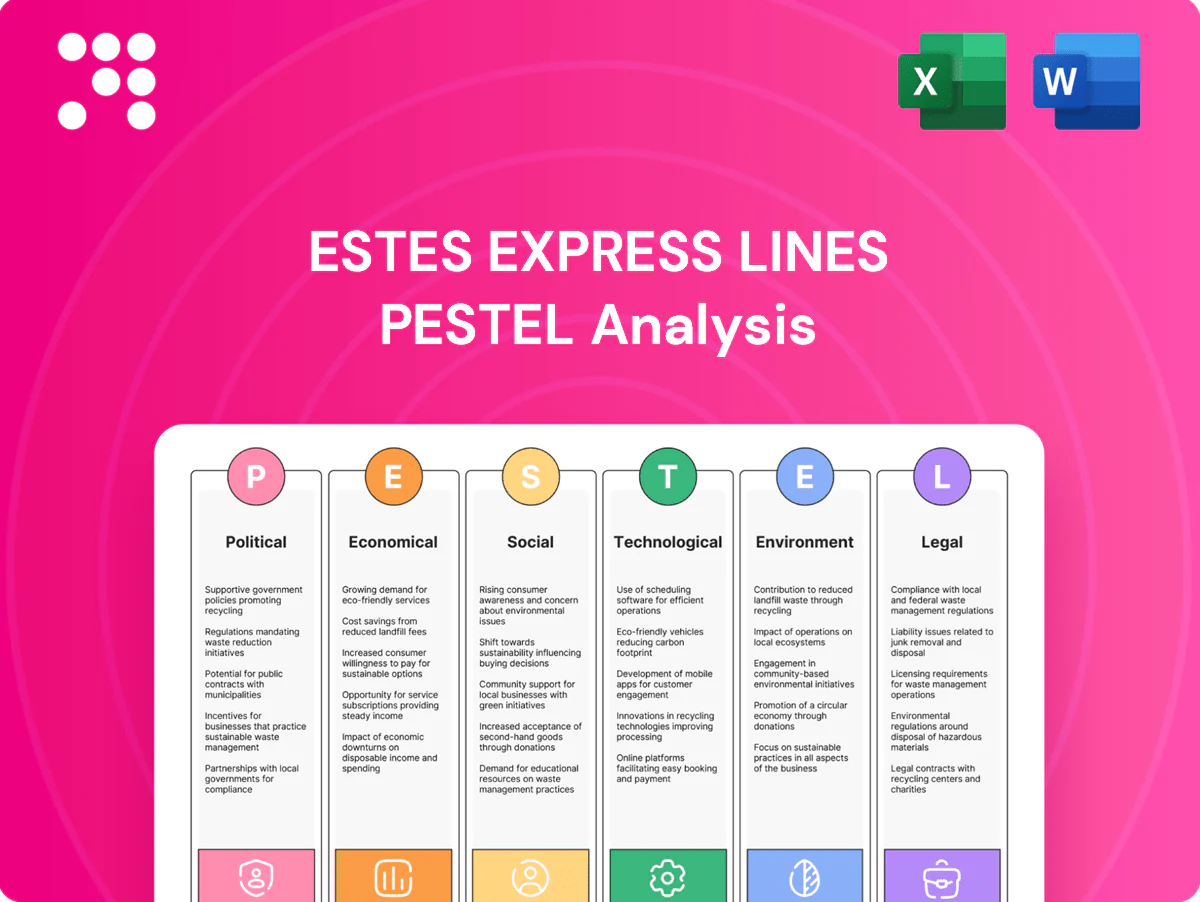
Estes Express Lines PESTLE Analysis

Your Competitive Advantage Starts with This Report
Discover how political, economic, social, technological, legal, and environmental forces are reshaping Estes Express Lines and uncover the risks and growth levers that matter most to investors and strategists. This concise PESTLE preview highlights key external trends and strategic implications to save you research time. Purchase the full, editable PESTLE analysis for a complete, actionable breakdown you can deploy immediately.
Political factors

Infrastructure funding and policy
Federal infrastructure programs—notably the 2021 IIJA totaling 1.2 trillion with roughly 110 billion for roads and bridges and about 17 billion for ports—directly shape Estes Express Lines transit times and LTL reliability. While projects can reduce bottlenecks long-term, lane closures during construction periodically disrupt schedules and raise operating costs. Estes must sync terminal investments and linehaul routing to evolving project timelines and pursue active advocacy to protect freight corridors critical to service consistency.
Trade policy and cross-border dynamics
USMCA, in force since July 1, 2020, underpins predictable cross-border flows crucial for North American LTL, supporting consistent lane planning and pricing. Tariffs or retaliatory measures can rapidly re-route commodity flows and change volume balances across lanes, pressuring margins. Customs modernizations and security programs influence border dwell times and require Estes to sustain precise documentation, real-time tracking, and flexible cross-border capacity to avoid service disruptions.

Fuel taxation and road pricing
Federal diesel excise tax stands at 24.4 cents per gallon and urban schemes such as New York City congestion pricing (launched June 2024) plus expanding toll networks raise per-mile costs and force route optimization. Varied state toll and tax regimes complicate network-wide cost management for Estes. Shippers often resist frequent fuel-surcharge hikes during price volatility. Precise pass-through mechanisms preserve margins without eroding demand.

Labor and workforce policies
Local permitting and zoning
Municipal approvals for Estes terminals, cross-docks and last-mile sites remain slow and politically sensitive, with site permits commonly adding months to timelines and increasing capex risk for 270+ terminal network (company filings 2024).
Noise, traffic and land-use concerns drive intense community scrutiny; early stakeholder outreach has reduced opposition-related delays in recent projects and is essential to balance access, cost and regulatory risk.
- Permitting delays: months to >1 year
- Network scale: 270+ terminals (2024)
- Mitigation: early stakeholder engagement
- Trade-offs: access vs. land cost vs. regulatory exposure
IIJA improves lanes; diesel tax, congestion pricing and 80k driver shortfall squeeze LTL
Federal IIJA funding (1.2T; ~$110B roads, $17B ports) reshapes lane reliability but causes intermittent construction delays; USMCA and tariff shifts affect cross-border LTL volumes; diesel tax 24.4¢/gal, congestion pricing (NYC Jun 2024) raise per-mile costs; driver pool 1.6M with ~80k shortage (2023–24).
| Factor | Key Data |
|---|---|
| Infrastructure | IIJA $1.2T; $110B roads; $17B ports |
| Labor | Drivers 1.6M; shortage ~80k (2023–24) |
| Costs | Diesel tax 24.4¢/gal; NYC congestion pricing Jun 2024 |
| Network | 270+ terminals (2024) |
What is included in the product
 Detailed Word Document
Explores how external macro-environmental factors uniquely affect Estes Express Lines across six dimensions—Political, Economic, Social, Technological, Environmental, and Legal—each backed by current data and trends to reveal threats and opportunities. Designed for executives and investors, the analysis is forward-looking, regionally grounded, and ready for inclusion in plans or decks.

 Customizable Excel Spreadsheet
A concise, PESTLE-segmented summary of Estes Express Lines that highlights external risks, regulatory and market drivers for quick inclusion in presentations or planning sessions, easily annotated for regional context and shareable across teams for fast alignment.
Economic factors

Freight cycle and industrial production
LTL demand tracks manufacturing output, retail inventories and PMI trends; ISM manufacturing PMI was below 50 for most of 2024, signaling soft demand while retail inventories remained elevated versus sales through 2024. Downcycles compress yields and asset utilization; upcycles strain capacity and service. Estes must calibrate headcount and equipment to load factors, using agile pricing and mix management to stabilize revenue per hundredweight.
Fuel price volatility
Diesel swings materially alter operating expenses; U.S. retail diesel averaged about $4.00/gal in mid‑2025, pushing fuel surcharges and cost per mile. Timing mismatches between spot diesel spikes and monthly surcharge collections can compress margins by several percentage points. Routing optimization and aerodynamic retrofits have cut fuel burn 5–10% in carrier case studies. Transparent, real‑time surcharge reporting to shippers preserves trust during rapid moves.

Interest rates and capital intensity
Higher financing costs tied to the U.S. federal funds rate at 5.25–5.50% increase the expense of tractors, trailers, terminals and tech investments, tightening lease-versus-buy calculus and shortening asset-refresh windows. Estes must raise internal hurdle rates and enforce cash-flow discipline with staggered capex to protect balance-sheet flexibility. Prioritizing high-ROI automation and network densification can preserve margins and capacity under a higher-rate regime.

E-commerce and B2B mix shifts
Rising e-commerce (US online retail ~16.4% of sales in 2023, ~18% by 2024) drives higher frequency of smaller shipments and greater final-mile demand, where last-mile can account for up to ~50% of total delivery cost. Residential surcharges of roughly $4–$8 per stop and lower delivery density compress LTL margins. Estes can bundle LTL with last-mile and time-critical services and use data-driven segmentation to align pricing to cost-to-serve.
- e-commerce share: ~16.4% (2023), ~18% (2024)
- last-mile cost: up to ~50%
- residential surcharge: ~$4–$8 (2024)
- strategy: bundle LTL + last-mile; segment pricing by cost-to-serve
Shipper consolidation and pricing power
Larger shippers and 3PLs increasingly negotiate aggressive contract terms, pressuring LTL carriers like Estes on rates and service commitments; volume concentration raises exposure to swings when a single account cuts volume or shifts lanes. Estes mitigates yield pressure through value-added services and reliability, which support pricing defense, while diversification across industries smooths demand volatility.
- Negotiation pressure: large shippers/3PLs
- Concentration risk: exposure to single accounts
- Yield defense: services + reliability
- Diversification: industry mix reduces volatility
IIJA improves lanes; diesel tax, congestion pricing and 80k driver shortfall squeeze LTL
LTL demand softened as ISM manufacturing PMI was below 50 for most of 2024, reducing shipment volumes and yield.
U.S. retail diesel averaged about $4.00/gal mid‑2025, with surcharge timing able to compress margins several percentage points.
Federal funds at 5.25–5.50% raised financing costs, forcing higher hurdle rates and staggered capex.
E‑commerce ~18% (2024) increases small‑parcel frequency and last‑mile cost (up to ~50%); residential surcharges ~$4–$8.
| Metric | Value |
|---|---|
| ISM PMI (2024) | <50 |
| Diesel (mid‑2025) | $4.00/gal |
| Fed funds (mid‑2025) | 5.25–5.50% |
| E‑commerce (2024) | ~18% |
| Last‑mile cost | up to ~50% |
| Residential surcharge (2024) | $4–$8 |
Preview the Actual Deliverable
Estes Express Lines PESTLE Analysis
The preview shown here is the exact Estes Express Lines PESTLE Analysis you’ll receive after purchase—fully formatted and ready to use. It contains the same structured Political, Economic, Social, Technological, Legal and Environmental insights as the downloadable file. No placeholders or teasers; this is the final, professional document. After payment you’ll instantly receive this exact file.

Your Competitive Advantage Starts with This Report
Discover how political, economic, social, technological, legal, and environmental forces are reshaping Estes Express Lines and uncover the risks and growth levers that matter most to investors and strategists. This concise PESTLE preview highlights key external trends and strategic implications to save you research time. Purchase the full, editable PESTLE analysis for a complete, actionable breakdown you can deploy immediately.
Political factors
Infrastructure funding and policy
Federal infrastructure programs—notably the 2021 IIJA totaling 1.2 trillion with roughly 110 billion for roads and bridges and about 17 billion for ports—directly shape Estes Express Lines transit times and LTL reliability. While projects can reduce bottlenecks long-term, lane closures during construction periodically disrupt schedules and raise operating costs. Estes must sync terminal investments and linehaul routing to evolving project timelines and pursue active advocacy to protect freight corridors critical to service consistency.
Trade policy and cross-border dynamics
USMCA, in force since July 1, 2020, underpins predictable cross-border flows crucial for North American LTL, supporting consistent lane planning and pricing. Tariffs or retaliatory measures can rapidly re-route commodity flows and change volume balances across lanes, pressuring margins. Customs modernizations and security programs influence border dwell times and require Estes to sustain precise documentation, real-time tracking, and flexible cross-border capacity to avoid service disruptions.
Fuel taxation and road pricing
Federal diesel excise tax stands at 24.4 cents per gallon and urban schemes such as New York City congestion pricing (launched June 2024) plus expanding toll networks raise per-mile costs and force route optimization. Varied state toll and tax regimes complicate network-wide cost management for Estes. Shippers often resist frequent fuel-surcharge hikes during price volatility. Precise pass-through mechanisms preserve margins without eroding demand.
Labor and workforce policies
Local permitting and zoning
Municipal approvals for Estes terminals, cross-docks and last-mile sites remain slow and politically sensitive, with site permits commonly adding months to timelines and increasing capex risk for 270+ terminal network (company filings 2024).
Noise, traffic and land-use concerns drive intense community scrutiny; early stakeholder outreach has reduced opposition-related delays in recent projects and is essential to balance access, cost and regulatory risk.
- Permitting delays: months to >1 year
- Network scale: 270+ terminals (2024)
- Mitigation: early stakeholder engagement
- Trade-offs: access vs. land cost vs. regulatory exposure
IIJA improves lanes; diesel tax, congestion pricing and 80k driver shortfall squeeze LTL
Federal IIJA funding (1.2T; ~$110B roads, $17B ports) reshapes lane reliability but causes intermittent construction delays; USMCA and tariff shifts affect cross-border LTL volumes; diesel tax 24.4¢/gal, congestion pricing (NYC Jun 2024) raise per-mile costs; driver pool 1.6M with ~80k shortage (2023–24).
| Factor | Key Data |
|---|---|
| Infrastructure | IIJA $1.2T; $110B roads; $17B ports |
| Labor | Drivers 1.6M; shortage ~80k (2023–24) |
| Costs | Diesel tax 24.4¢/gal; NYC congestion pricing Jun 2024 |
| Network | 270+ terminals (2024) |
What is included in the product
Detailed Word Document
Explores how external macro-environmental factors uniquely affect Estes Express Lines across six dimensions—Political, Economic, Social, Technological, Environmental, and Legal—each backed by current data and trends to reveal threats and opportunities. Designed for executives and investors, the analysis is forward-looking, regionally grounded, and ready for inclusion in plans or decks.
Customizable Excel Spreadsheet
A concise, PESTLE-segmented summary of Estes Express Lines that highlights external risks, regulatory and market drivers for quick inclusion in presentations or planning sessions, easily annotated for regional context and shareable across teams for fast alignment.
Economic factors
Freight cycle and industrial production
LTL demand tracks manufacturing output, retail inventories and PMI trends; ISM manufacturing PMI was below 50 for most of 2024, signaling soft demand while retail inventories remained elevated versus sales through 2024. Downcycles compress yields and asset utilization; upcycles strain capacity and service. Estes must calibrate headcount and equipment to load factors, using agile pricing and mix management to stabilize revenue per hundredweight.
Fuel price volatility
Diesel swings materially alter operating expenses; U.S. retail diesel averaged about $4.00/gal in mid‑2025, pushing fuel surcharges and cost per mile. Timing mismatches between spot diesel spikes and monthly surcharge collections can compress margins by several percentage points. Routing optimization and aerodynamic retrofits have cut fuel burn 5–10% in carrier case studies. Transparent, real‑time surcharge reporting to shippers preserves trust during rapid moves.
Interest rates and capital intensity
Higher financing costs tied to the U.S. federal funds rate at 5.25–5.50% increase the expense of tractors, trailers, terminals and tech investments, tightening lease-versus-buy calculus and shortening asset-refresh windows. Estes must raise internal hurdle rates and enforce cash-flow discipline with staggered capex to protect balance-sheet flexibility. Prioritizing high-ROI automation and network densification can preserve margins and capacity under a higher-rate regime.
E-commerce and B2B mix shifts
Rising e-commerce (US online retail ~16.4% of sales in 2023, ~18% by 2024) drives higher frequency of smaller shipments and greater final-mile demand, where last-mile can account for up to ~50% of total delivery cost. Residential surcharges of roughly $4–$8 per stop and lower delivery density compress LTL margins. Estes can bundle LTL with last-mile and time-critical services and use data-driven segmentation to align pricing to cost-to-serve.
- e-commerce share: ~16.4% (2023), ~18% (2024)
- last-mile cost: up to ~50%
- residential surcharge: ~$4–$8 (2024)
- strategy: bundle LTL + last-mile; segment pricing by cost-to-serve
Shipper consolidation and pricing power
Larger shippers and 3PLs increasingly negotiate aggressive contract terms, pressuring LTL carriers like Estes on rates and service commitments; volume concentration raises exposure to swings when a single account cuts volume or shifts lanes. Estes mitigates yield pressure through value-added services and reliability, which support pricing defense, while diversification across industries smooths demand volatility.
- Negotiation pressure: large shippers/3PLs
- Concentration risk: exposure to single accounts
- Yield defense: services + reliability
- Diversification: industry mix reduces volatility
IIJA improves lanes; diesel tax, congestion pricing and 80k driver shortfall squeeze LTL
LTL demand softened as ISM manufacturing PMI was below 50 for most of 2024, reducing shipment volumes and yield.
U.S. retail diesel averaged about $4.00/gal mid‑2025, with surcharge timing able to compress margins several percentage points.
Federal funds at 5.25–5.50% raised financing costs, forcing higher hurdle rates and staggered capex.
E‑commerce ~18% (2024) increases small‑parcel frequency and last‑mile cost (up to ~50%); residential surcharges ~$4–$8.
| Metric | Value |
|---|---|
| ISM PMI (2024) | <50 |
| Diesel (mid‑2025) | $4.00/gal |
| Fed funds (mid‑2025) | 5.25–5.50% |
| E‑commerce (2024) | ~18% |
| Last‑mile cost | up to ~50% |
| Residential surcharge (2024) | $4–$8 |
Preview the Actual Deliverable
Estes Express Lines PESTLE Analysis
The preview shown here is the exact Estes Express Lines PESTLE Analysis you’ll receive after purchase—fully formatted and ready to use. It contains the same structured Political, Economic, Social, Technological, Legal and Environmental insights as the downloadable file. No placeholders or teasers; this is the final, professional document. After payment you’ll instantly receive this exact file.
Original: $10.00
-65%$10.00
$3.50Description
Your Competitive Advantage Starts with This Report
Discover how political, economic, social, technological, legal, and environmental forces are reshaping Estes Express Lines and uncover the risks and growth levers that matter most to investors and strategists. This concise PESTLE preview highlights key external trends and strategic implications to save you research time. Purchase the full, editable PESTLE analysis for a complete, actionable breakdown you can deploy immediately.
Political factors
Infrastructure funding and policy
Federal infrastructure programs—notably the 2021 IIJA totaling 1.2 trillion with roughly 110 billion for roads and bridges and about 17 billion for ports—directly shape Estes Express Lines transit times and LTL reliability. While projects can reduce bottlenecks long-term, lane closures during construction periodically disrupt schedules and raise operating costs. Estes must sync terminal investments and linehaul routing to evolving project timelines and pursue active advocacy to protect freight corridors critical to service consistency.
Trade policy and cross-border dynamics
USMCA, in force since July 1, 2020, underpins predictable cross-border flows crucial for North American LTL, supporting consistent lane planning and pricing. Tariffs or retaliatory measures can rapidly re-route commodity flows and change volume balances across lanes, pressuring margins. Customs modernizations and security programs influence border dwell times and require Estes to sustain precise documentation, real-time tracking, and flexible cross-border capacity to avoid service disruptions.
Fuel taxation and road pricing
Federal diesel excise tax stands at 24.4 cents per gallon and urban schemes such as New York City congestion pricing (launched June 2024) plus expanding toll networks raise per-mile costs and force route optimization. Varied state toll and tax regimes complicate network-wide cost management for Estes. Shippers often resist frequent fuel-surcharge hikes during price volatility. Precise pass-through mechanisms preserve margins without eroding demand.
Labor and workforce policies
Local permitting and zoning
Municipal approvals for Estes terminals, cross-docks and last-mile sites remain slow and politically sensitive, with site permits commonly adding months to timelines and increasing capex risk for 270+ terminal network (company filings 2024).
Noise, traffic and land-use concerns drive intense community scrutiny; early stakeholder outreach has reduced opposition-related delays in recent projects and is essential to balance access, cost and regulatory risk.
- Permitting delays: months to >1 year
- Network scale: 270+ terminals (2024)
- Mitigation: early stakeholder engagement
- Trade-offs: access vs. land cost vs. regulatory exposure
IIJA improves lanes; diesel tax, congestion pricing and 80k driver shortfall squeeze LTL
Federal IIJA funding (1.2T; ~$110B roads, $17B ports) reshapes lane reliability but causes intermittent construction delays; USMCA and tariff shifts affect cross-border LTL volumes; diesel tax 24.4¢/gal, congestion pricing (NYC Jun 2024) raise per-mile costs; driver pool 1.6M with ~80k shortage (2023–24).
| Factor | Key Data |
|---|---|
| Infrastructure | IIJA $1.2T; $110B roads; $17B ports |
| Labor | Drivers 1.6M; shortage ~80k (2023–24) |
| Costs | Diesel tax 24.4¢/gal; NYC congestion pricing Jun 2024 |
| Network | 270+ terminals (2024) |
What is included in the product
Detailed Word Document
Explores how external macro-environmental factors uniquely affect Estes Express Lines across six dimensions—Political, Economic, Social, Technological, Environmental, and Legal—each backed by current data and trends to reveal threats and opportunities. Designed for executives and investors, the analysis is forward-looking, regionally grounded, and ready for inclusion in plans or decks.
Customizable Excel Spreadsheet
A concise, PESTLE-segmented summary of Estes Express Lines that highlights external risks, regulatory and market drivers for quick inclusion in presentations or planning sessions, easily annotated for regional context and shareable across teams for fast alignment.
Economic factors
Freight cycle and industrial production
LTL demand tracks manufacturing output, retail inventories and PMI trends; ISM manufacturing PMI was below 50 for most of 2024, signaling soft demand while retail inventories remained elevated versus sales through 2024. Downcycles compress yields and asset utilization; upcycles strain capacity and service. Estes must calibrate headcount and equipment to load factors, using agile pricing and mix management to stabilize revenue per hundredweight.
Fuel price volatility
Diesel swings materially alter operating expenses; U.S. retail diesel averaged about $4.00/gal in mid‑2025, pushing fuel surcharges and cost per mile. Timing mismatches between spot diesel spikes and monthly surcharge collections can compress margins by several percentage points. Routing optimization and aerodynamic retrofits have cut fuel burn 5–10% in carrier case studies. Transparent, real‑time surcharge reporting to shippers preserves trust during rapid moves.
Interest rates and capital intensity
Higher financing costs tied to the U.S. federal funds rate at 5.25–5.50% increase the expense of tractors, trailers, terminals and tech investments, tightening lease-versus-buy calculus and shortening asset-refresh windows. Estes must raise internal hurdle rates and enforce cash-flow discipline with staggered capex to protect balance-sheet flexibility. Prioritizing high-ROI automation and network densification can preserve margins and capacity under a higher-rate regime.
E-commerce and B2B mix shifts
Rising e-commerce (US online retail ~16.4% of sales in 2023, ~18% by 2024) drives higher frequency of smaller shipments and greater final-mile demand, where last-mile can account for up to ~50% of total delivery cost. Residential surcharges of roughly $4–$8 per stop and lower delivery density compress LTL margins. Estes can bundle LTL with last-mile and time-critical services and use data-driven segmentation to align pricing to cost-to-serve.
- e-commerce share: ~16.4% (2023), ~18% (2024)
- last-mile cost: up to ~50%
- residential surcharge: ~$4–$8 (2024)
- strategy: bundle LTL + last-mile; segment pricing by cost-to-serve
Shipper consolidation and pricing power
Larger shippers and 3PLs increasingly negotiate aggressive contract terms, pressuring LTL carriers like Estes on rates and service commitments; volume concentration raises exposure to swings when a single account cuts volume or shifts lanes. Estes mitigates yield pressure through value-added services and reliability, which support pricing defense, while diversification across industries smooths demand volatility.
- Negotiation pressure: large shippers/3PLs
- Concentration risk: exposure to single accounts
- Yield defense: services + reliability
- Diversification: industry mix reduces volatility
IIJA improves lanes; diesel tax, congestion pricing and 80k driver shortfall squeeze LTL
LTL demand softened as ISM manufacturing PMI was below 50 for most of 2024, reducing shipment volumes and yield.
U.S. retail diesel averaged about $4.00/gal mid‑2025, with surcharge timing able to compress margins several percentage points.
Federal funds at 5.25–5.50% raised financing costs, forcing higher hurdle rates and staggered capex.
E‑commerce ~18% (2024) increases small‑parcel frequency and last‑mile cost (up to ~50%); residential surcharges ~$4–$8.
| Metric | Value |
|---|---|
| ISM PMI (2024) | <50 |
| Diesel (mid‑2025) | $4.00/gal |
| Fed funds (mid‑2025) | 5.25–5.50% |
| E‑commerce (2024) | ~18% |
| Last‑mile cost | up to ~50% |
| Residential surcharge (2024) | $4–$8 |
Preview the Actual Deliverable
Estes Express Lines PESTLE Analysis
The preview shown here is the exact Estes Express Lines PESTLE Analysis you’ll receive after purchase—fully formatted and ready to use. It contains the same structured Political, Economic, Social, Technological, Legal and Environmental insights as the downloadable file. No placeholders or teasers; this is the final, professional document. After payment you’ll instantly receive this exact file.











