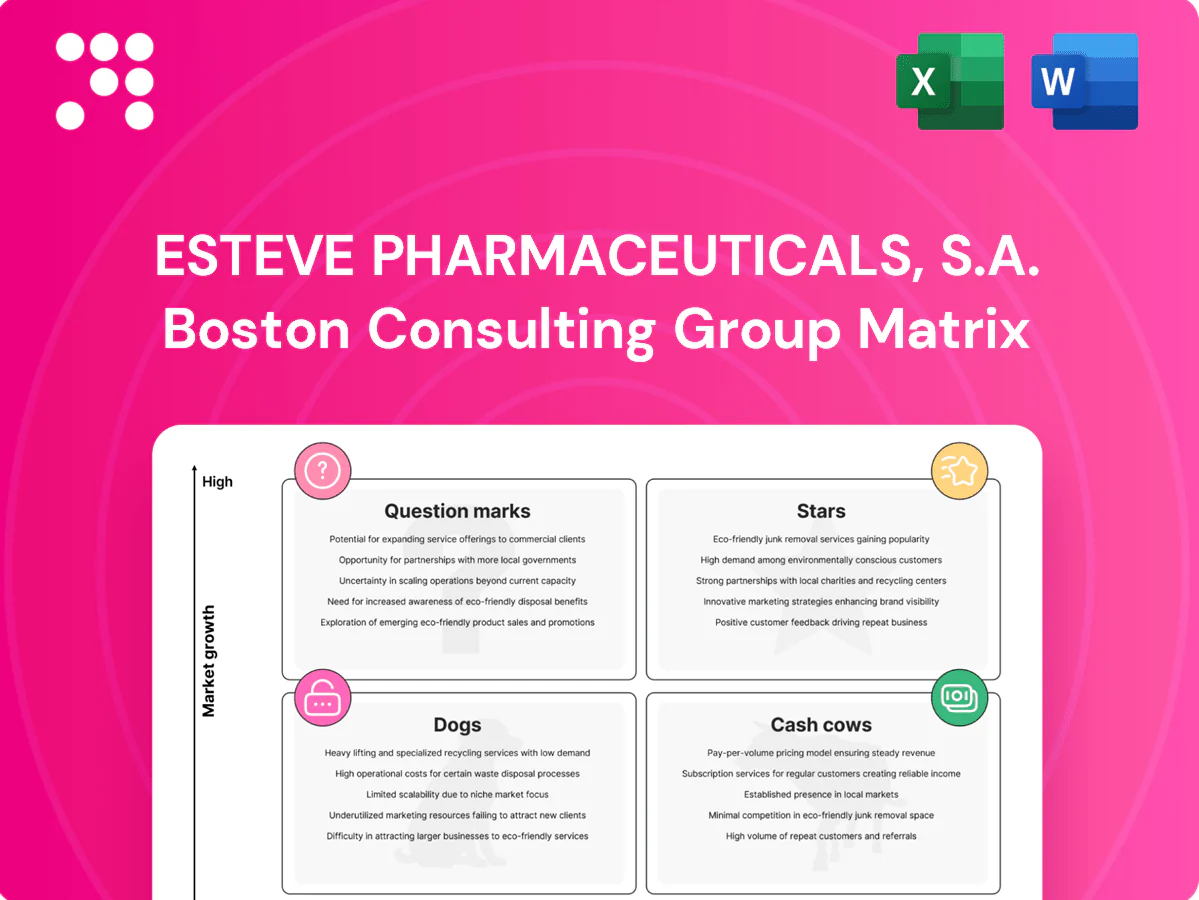
Esteve Pharmaceuticals, S.A. Boston Consulting Group Matrix

See the Bigger Picture
Curious where Esteve Pharmaceuticals sits in the marketplace? This quick BCG Matrix snapshot hints at which drugs are Stars, which are Cash Cows, and which need tough choices— but the full report gives the quadrant-by-quadrant clarity you actually need. Purchase the complete BCG Matrix for a detailed Word report plus a high-level Excel summary, data-backed recommendations, and ready-to-use visuals to guide investment and product decisions. Get instant access and save yourself hours of research.
Stars

Innovative pain therapies (branded, specialty)
Innovative branded specialty pain therapies sit in a high-growth segment—global non-opioid pain therapeutics market exceeded $60 billion in 2024—where Esteve leans into pain science and targeted modalities. Uptake is accelerating as clinical guidelines shift toward safer, targeted options, but adoption still requires heavy field education and strong market-access efforts. Esteve should keep investing to lock leadership before the curve flattens.
Emerging CNS launches in priority markets
CNS demand is rising: 1 in 5 US adults (~52 million) had a mental illness in 2023 (SAMHSA), and payers are increasingly receptive to products that demonstrably reduce total cost of care via outcomes-based approaches. Early commercial wins amplify with robust real-world outcomes, turning initial uptake into durable share. Promotion and placement are not optional—they drive traction now so Esteve can nail share today and harvest later.

International expansion of branded specialties
International expansion of branded specialties can drive steep growth and visibility: IQVIA estimated the global pharmaceutical market at about $1.6 trillion in 2024, creating major upside for successful new-country rollouts. Share often ramps quickly if access and supply are flawless, but launches typically consume $10–50 million upfront for regulatory, pricing dossiers and field teams. Investment is justified only if the ramp sustains and competitors lag.

Respiratory specialty offerings in faster-growing subsegments
Respiratory offerings targeting asthma/COPD with tech-enabled devices and differentiated delivery can outpace the broader inhaler market, valued at about $22B in 2024 with ~5% CAGR to 2028; real-world adherence near 50% (2024) means when adherence improves, share follows. Early promotion to clinicians, payers and patient programs is heavy; sustained share gains migrate Stars into Cash Cows.
Data-driven support (RWE, adherence, patient programs)
Data-driven support (RWE, adherence, patient programs) supercharges adoption in growth markets by sustaining prescriptions and market share despite not booking as products; IQVIA 2024 shows RWE-linked launches can accelerate uptake ~12% and patient-support programs lift persistence 15–20%. Spend is front-loaded—60–80% in year 0–1—so continue while ROI remains positive.
- RWE uplift ~12% (IQVIA 2024)
- Adherence +15–20% (2024 program metrics)
- Front-loaded spend 60–80% year 0–1
- Drives prescriptions, not P&L booking
Front-load to win: $60B pain, $22B inhaler markets
Stars: Esteve’s branded specialty pain, CNS and respiratory assets sit in high-growth pockets—non-opioid pain ~$60B (2024), global pharma ~$1.6T (2024), inhaler ~$22B (2024); RWE lifts launches ~12% (IQVIA 2024) and adherence programs +15–20% (2024). Continue front-loaded investment (60–80% year 0–1) to convert fast uptake into durable share.
| Metric | Value (2024) |
|---|---|
| Non-opioid pain market | $60B |
| Global pharma | $1.6T |
| Inhaler market | $22B |
| RWE uplift | ~12% |
| Adherence lift | 15–20% |
| Front-loaded spend | 60–80% |
What is included in the product
 Detailed Word Document
Comprehensive BCG Matrix for Esteve: identifies Stars, Cash Cows, Question Marks, Dogs with strategic invest/hold/divest guidance.

 Customizable Excel Spreadsheet
One-page overview placing each Esteve Pharmaceuticals business unit in a quadrant, easing strategic pain points.
Cash Cows

Core OTC analgesics in home markets
Core OTC analgesics in home markets occupy mature shelves with strong brand recall and predictable turns; in 2024 they show low growth but retain high market share, fitting a classic milk-the-margin cash cow profile. Light promotional investment preserves velocity and gross margins. Generated cash funds new product launches and clinical trials across the portfolio.
Established generics in pain and respiratory
Established generics in pain and respiratory remain the cash cow: stable public tenders and efficient production runs delivered steady volumes in 2024 (roughly +1% YoY), supporting service levels while limiting commercial detailing. Price pressure persists, but strict operational discipline preserved margins (gross margin ~28% in 2024) and kept these lines as a cash engine rather than growth plays. Cash generation funds R&D and strategic investments across the group.

Hospital-present analgesic lines
Hospital-present analgesic lines function as cash cows for Esteve, with entrenched protocols and long clinical relationships keeping orders steady and representing the majority of line sales in 2024. Utilization is consistent across seasons, supporting predictable monthly demand and inventory planning. Operations focus on flawless supply and tight cost control to protect margins, while surplus cash bankrolls bolder R&D and M&A bets.

Legacy regional brands with loyal prescribers
Legacy regional brands with loyal prescribers show low-growth scripts but high familiarity; in 2024 they remain stable revenue contributors for Esteve, where big campaigns yield little incremental lift and stock-outs carry outsized risk. Maintain regular pack refreshes and strict quality controls; these brands quietly throw off cash.
- Low growth, steady scripts
- High prescriber loyalty
- Low ROI on mass marketing
- High risk from stock-outs
- Maintain packaging refresh & quality
- Reliable cash-generator
Standard oral solid doses with optimized manufacturing
Standard oral solid doses leverage Esteve’s process know-how and scale to drive low unit costs; flat market demand in 2024 makes predictable volumes and supply continuity particularly valuable for margins and planning.
Targeted incremental capex on continuous manufacturing and automation in 2024 squeezes incremental margin, reinforcing oral solids as the reliability layer under the portfolio.
- Unit-cost advantage from scale
- Flat, predictable 2024 demand = operational certainty
- Incremental capex boosts margin via automation
- Core reliability layer in portfolio
2024 cash engines: generics +1% (GM ~28%), OTC steady, capex lifts oral solids margins
Esteve cash cows: OTC analgesics, established generics, hospital analgesics and legacy regional brands produced stable cash in 2024—generics +1% YoY and gross margin ~28%—supporting R&D, clinical trials and M&A. Targeted 2024 capex on automation improved oral solids margins and supply reliability. Inventory discipline limits stock-out risk while marketing ROI remains low.
| Line | 2024 %YoY | Gross margin | Role |
|---|---|---|---|
| Generics | +1% | ~28% | Cash engine |
| OTC analgesics | 0% | High | Milk margin |
Delivered as Shown
Esteve Pharmaceuticals, S.A. BCG Matrix
The file you're previewing here is the exact Esteve Pharmaceuticals, S.A. BCG Matrix report you'll get after purchase — no watermarks, no demo text, just the finished, professionally formatted analysis. It’s built for clarity and action, with market context and strategic positioning ready to plug into your planning. After purchase the full, editable file is delivered instantly to your inbox for printing, presenting, or updating as needed.

See the Bigger Picture
Curious where Esteve Pharmaceuticals sits in the marketplace? This quick BCG Matrix snapshot hints at which drugs are Stars, which are Cash Cows, and which need tough choices— but the full report gives the quadrant-by-quadrant clarity you actually need. Purchase the complete BCG Matrix for a detailed Word report plus a high-level Excel summary, data-backed recommendations, and ready-to-use visuals to guide investment and product decisions. Get instant access and save yourself hours of research.
Stars
Innovative pain therapies (branded, specialty)
Innovative branded specialty pain therapies sit in a high-growth segment—global non-opioid pain therapeutics market exceeded $60 billion in 2024—where Esteve leans into pain science and targeted modalities. Uptake is accelerating as clinical guidelines shift toward safer, targeted options, but adoption still requires heavy field education and strong market-access efforts. Esteve should keep investing to lock leadership before the curve flattens.
Emerging CNS launches in priority markets
CNS demand is rising: 1 in 5 US adults (~52 million) had a mental illness in 2023 (SAMHSA), and payers are increasingly receptive to products that demonstrably reduce total cost of care via outcomes-based approaches. Early commercial wins amplify with robust real-world outcomes, turning initial uptake into durable share. Promotion and placement are not optional—they drive traction now so Esteve can nail share today and harvest later.
International expansion of branded specialties
International expansion of branded specialties can drive steep growth and visibility: IQVIA estimated the global pharmaceutical market at about $1.6 trillion in 2024, creating major upside for successful new-country rollouts. Share often ramps quickly if access and supply are flawless, but launches typically consume $10–50 million upfront for regulatory, pricing dossiers and field teams. Investment is justified only if the ramp sustains and competitors lag.
Respiratory specialty offerings in faster-growing subsegments
Respiratory offerings targeting asthma/COPD with tech-enabled devices and differentiated delivery can outpace the broader inhaler market, valued at about $22B in 2024 with ~5% CAGR to 2028; real-world adherence near 50% (2024) means when adherence improves, share follows. Early promotion to clinicians, payers and patient programs is heavy; sustained share gains migrate Stars into Cash Cows.
Data-driven support (RWE, adherence, patient programs)
Data-driven support (RWE, adherence, patient programs) supercharges adoption in growth markets by sustaining prescriptions and market share despite not booking as products; IQVIA 2024 shows RWE-linked launches can accelerate uptake ~12% and patient-support programs lift persistence 15–20%. Spend is front-loaded—60–80% in year 0–1—so continue while ROI remains positive.
- RWE uplift ~12% (IQVIA 2024)
- Adherence +15–20% (2024 program metrics)
- Front-loaded spend 60–80% year 0–1
- Drives prescriptions, not P&L booking
Front-load to win: $60B pain, $22B inhaler markets
Stars: Esteve’s branded specialty pain, CNS and respiratory assets sit in high-growth pockets—non-opioid pain ~$60B (2024), global pharma ~$1.6T (2024), inhaler ~$22B (2024); RWE lifts launches ~12% (IQVIA 2024) and adherence programs +15–20% (2024). Continue front-loaded investment (60–80% year 0–1) to convert fast uptake into durable share.
| Metric | Value (2024) |
|---|---|
| Non-opioid pain market | $60B |
| Global pharma | $1.6T |
| Inhaler market | $22B |
| RWE uplift | ~12% |
| Adherence lift | 15–20% |
| Front-loaded spend | 60–80% |
What is included in the product
Detailed Word Document
Comprehensive BCG Matrix for Esteve: identifies Stars, Cash Cows, Question Marks, Dogs with strategic invest/hold/divest guidance.
Customizable Excel Spreadsheet
One-page overview placing each Esteve Pharmaceuticals business unit in a quadrant, easing strategic pain points.
Cash Cows
Core OTC analgesics in home markets
Core OTC analgesics in home markets occupy mature shelves with strong brand recall and predictable turns; in 2024 they show low growth but retain high market share, fitting a classic milk-the-margin cash cow profile. Light promotional investment preserves velocity and gross margins. Generated cash funds new product launches and clinical trials across the portfolio.
Established generics in pain and respiratory
Established generics in pain and respiratory remain the cash cow: stable public tenders and efficient production runs delivered steady volumes in 2024 (roughly +1% YoY), supporting service levels while limiting commercial detailing. Price pressure persists, but strict operational discipline preserved margins (gross margin ~28% in 2024) and kept these lines as a cash engine rather than growth plays. Cash generation funds R&D and strategic investments across the group.
Hospital-present analgesic lines
Hospital-present analgesic lines function as cash cows for Esteve, with entrenched protocols and long clinical relationships keeping orders steady and representing the majority of line sales in 2024. Utilization is consistent across seasons, supporting predictable monthly demand and inventory planning. Operations focus on flawless supply and tight cost control to protect margins, while surplus cash bankrolls bolder R&D and M&A bets.
Legacy regional brands with loyal prescribers
Legacy regional brands with loyal prescribers show low-growth scripts but high familiarity; in 2024 they remain stable revenue contributors for Esteve, where big campaigns yield little incremental lift and stock-outs carry outsized risk. Maintain regular pack refreshes and strict quality controls; these brands quietly throw off cash.
- Low growth, steady scripts
- High prescriber loyalty
- Low ROI on mass marketing
- High risk from stock-outs
- Maintain packaging refresh & quality
- Reliable cash-generator
Standard oral solid doses with optimized manufacturing
Standard oral solid doses leverage Esteve’s process know-how and scale to drive low unit costs; flat market demand in 2024 makes predictable volumes and supply continuity particularly valuable for margins and planning.
Targeted incremental capex on continuous manufacturing and automation in 2024 squeezes incremental margin, reinforcing oral solids as the reliability layer under the portfolio.
- Unit-cost advantage from scale
- Flat, predictable 2024 demand = operational certainty
- Incremental capex boosts margin via automation
- Core reliability layer in portfolio
2024 cash engines: generics +1% (GM ~28%), OTC steady, capex lifts oral solids margins
Esteve cash cows: OTC analgesics, established generics, hospital analgesics and legacy regional brands produced stable cash in 2024—generics +1% YoY and gross margin ~28%—supporting R&D, clinical trials and M&A. Targeted 2024 capex on automation improved oral solids margins and supply reliability. Inventory discipline limits stock-out risk while marketing ROI remains low.
| Line | 2024 %YoY | Gross margin | Role |
|---|---|---|---|
| Generics | +1% | ~28% | Cash engine |
| OTC analgesics | 0% | High | Milk margin |
Delivered as Shown
Esteve Pharmaceuticals, S.A. BCG Matrix
The file you're previewing here is the exact Esteve Pharmaceuticals, S.A. BCG Matrix report you'll get after purchase — no watermarks, no demo text, just the finished, professionally formatted analysis. It’s built for clarity and action, with market context and strategic positioning ready to plug into your planning. After purchase the full, editable file is delivered instantly to your inbox for printing, presenting, or updating as needed.
Description
See the Bigger Picture
Curious where Esteve Pharmaceuticals sits in the marketplace? This quick BCG Matrix snapshot hints at which drugs are Stars, which are Cash Cows, and which need tough choices— but the full report gives the quadrant-by-quadrant clarity you actually need. Purchase the complete BCG Matrix for a detailed Word report plus a high-level Excel summary, data-backed recommendations, and ready-to-use visuals to guide investment and product decisions. Get instant access and save yourself hours of research.
Stars
Innovative pain therapies (branded, specialty)
Innovative branded specialty pain therapies sit in a high-growth segment—global non-opioid pain therapeutics market exceeded $60 billion in 2024—where Esteve leans into pain science and targeted modalities. Uptake is accelerating as clinical guidelines shift toward safer, targeted options, but adoption still requires heavy field education and strong market-access efforts. Esteve should keep investing to lock leadership before the curve flattens.
Emerging CNS launches in priority markets
CNS demand is rising: 1 in 5 US adults (~52 million) had a mental illness in 2023 (SAMHSA), and payers are increasingly receptive to products that demonstrably reduce total cost of care via outcomes-based approaches. Early commercial wins amplify with robust real-world outcomes, turning initial uptake into durable share. Promotion and placement are not optional—they drive traction now so Esteve can nail share today and harvest later.
International expansion of branded specialties
International expansion of branded specialties can drive steep growth and visibility: IQVIA estimated the global pharmaceutical market at about $1.6 trillion in 2024, creating major upside for successful new-country rollouts. Share often ramps quickly if access and supply are flawless, but launches typically consume $10–50 million upfront for regulatory, pricing dossiers and field teams. Investment is justified only if the ramp sustains and competitors lag.
Respiratory specialty offerings in faster-growing subsegments
Respiratory offerings targeting asthma/COPD with tech-enabled devices and differentiated delivery can outpace the broader inhaler market, valued at about $22B in 2024 with ~5% CAGR to 2028; real-world adherence near 50% (2024) means when adherence improves, share follows. Early promotion to clinicians, payers and patient programs is heavy; sustained share gains migrate Stars into Cash Cows.
Data-driven support (RWE, adherence, patient programs)
Data-driven support (RWE, adherence, patient programs) supercharges adoption in growth markets by sustaining prescriptions and market share despite not booking as products; IQVIA 2024 shows RWE-linked launches can accelerate uptake ~12% and patient-support programs lift persistence 15–20%. Spend is front-loaded—60–80% in year 0–1—so continue while ROI remains positive.
- RWE uplift ~12% (IQVIA 2024)
- Adherence +15–20% (2024 program metrics)
- Front-loaded spend 60–80% year 0–1
- Drives prescriptions, not P&L booking
Front-load to win: $60B pain, $22B inhaler markets
Stars: Esteve’s branded specialty pain, CNS and respiratory assets sit in high-growth pockets—non-opioid pain ~$60B (2024), global pharma ~$1.6T (2024), inhaler ~$22B (2024); RWE lifts launches ~12% (IQVIA 2024) and adherence programs +15–20% (2024). Continue front-loaded investment (60–80% year 0–1) to convert fast uptake into durable share.
| Metric | Value (2024) |
|---|---|
| Non-opioid pain market | $60B |
| Global pharma | $1.6T |
| Inhaler market | $22B |
| RWE uplift | ~12% |
| Adherence lift | 15–20% |
| Front-loaded spend | 60–80% |
What is included in the product
Detailed Word Document
Comprehensive BCG Matrix for Esteve: identifies Stars, Cash Cows, Question Marks, Dogs with strategic invest/hold/divest guidance.
Customizable Excel Spreadsheet
One-page overview placing each Esteve Pharmaceuticals business unit in a quadrant, easing strategic pain points.
Cash Cows
Core OTC analgesics in home markets
Core OTC analgesics in home markets occupy mature shelves with strong brand recall and predictable turns; in 2024 they show low growth but retain high market share, fitting a classic milk-the-margin cash cow profile. Light promotional investment preserves velocity and gross margins. Generated cash funds new product launches and clinical trials across the portfolio.
Established generics in pain and respiratory
Established generics in pain and respiratory remain the cash cow: stable public tenders and efficient production runs delivered steady volumes in 2024 (roughly +1% YoY), supporting service levels while limiting commercial detailing. Price pressure persists, but strict operational discipline preserved margins (gross margin ~28% in 2024) and kept these lines as a cash engine rather than growth plays. Cash generation funds R&D and strategic investments across the group.
Hospital-present analgesic lines
Hospital-present analgesic lines function as cash cows for Esteve, with entrenched protocols and long clinical relationships keeping orders steady and representing the majority of line sales in 2024. Utilization is consistent across seasons, supporting predictable monthly demand and inventory planning. Operations focus on flawless supply and tight cost control to protect margins, while surplus cash bankrolls bolder R&D and M&A bets.
Legacy regional brands with loyal prescribers
Legacy regional brands with loyal prescribers show low-growth scripts but high familiarity; in 2024 they remain stable revenue contributors for Esteve, where big campaigns yield little incremental lift and stock-outs carry outsized risk. Maintain regular pack refreshes and strict quality controls; these brands quietly throw off cash.
- Low growth, steady scripts
- High prescriber loyalty
- Low ROI on mass marketing
- High risk from stock-outs
- Maintain packaging refresh & quality
- Reliable cash-generator
Standard oral solid doses with optimized manufacturing
Standard oral solid doses leverage Esteve’s process know-how and scale to drive low unit costs; flat market demand in 2024 makes predictable volumes and supply continuity particularly valuable for margins and planning.
Targeted incremental capex on continuous manufacturing and automation in 2024 squeezes incremental margin, reinforcing oral solids as the reliability layer under the portfolio.
- Unit-cost advantage from scale
- Flat, predictable 2024 demand = operational certainty
- Incremental capex boosts margin via automation
- Core reliability layer in portfolio
2024 cash engines: generics +1% (GM ~28%), OTC steady, capex lifts oral solids margins
Esteve cash cows: OTC analgesics, established generics, hospital analgesics and legacy regional brands produced stable cash in 2024—generics +1% YoY and gross margin ~28%—supporting R&D, clinical trials and M&A. Targeted 2024 capex on automation improved oral solids margins and supply reliability. Inventory discipline limits stock-out risk while marketing ROI remains low.
| Line | 2024 %YoY | Gross margin | Role |
|---|---|---|---|
| Generics | +1% | ~28% | Cash engine |
| OTC analgesics | 0% | High | Milk margin |
Delivered as Shown
Esteve Pharmaceuticals, S.A. BCG Matrix
The file you're previewing here is the exact Esteve Pharmaceuticals, S.A. BCG Matrix report you'll get after purchase — no watermarks, no demo text, just the finished, professionally formatted analysis. It’s built for clarity and action, with market context and strategic positioning ready to plug into your planning. After purchase the full, editable file is delivered instantly to your inbox for printing, presenting, or updating as needed.











