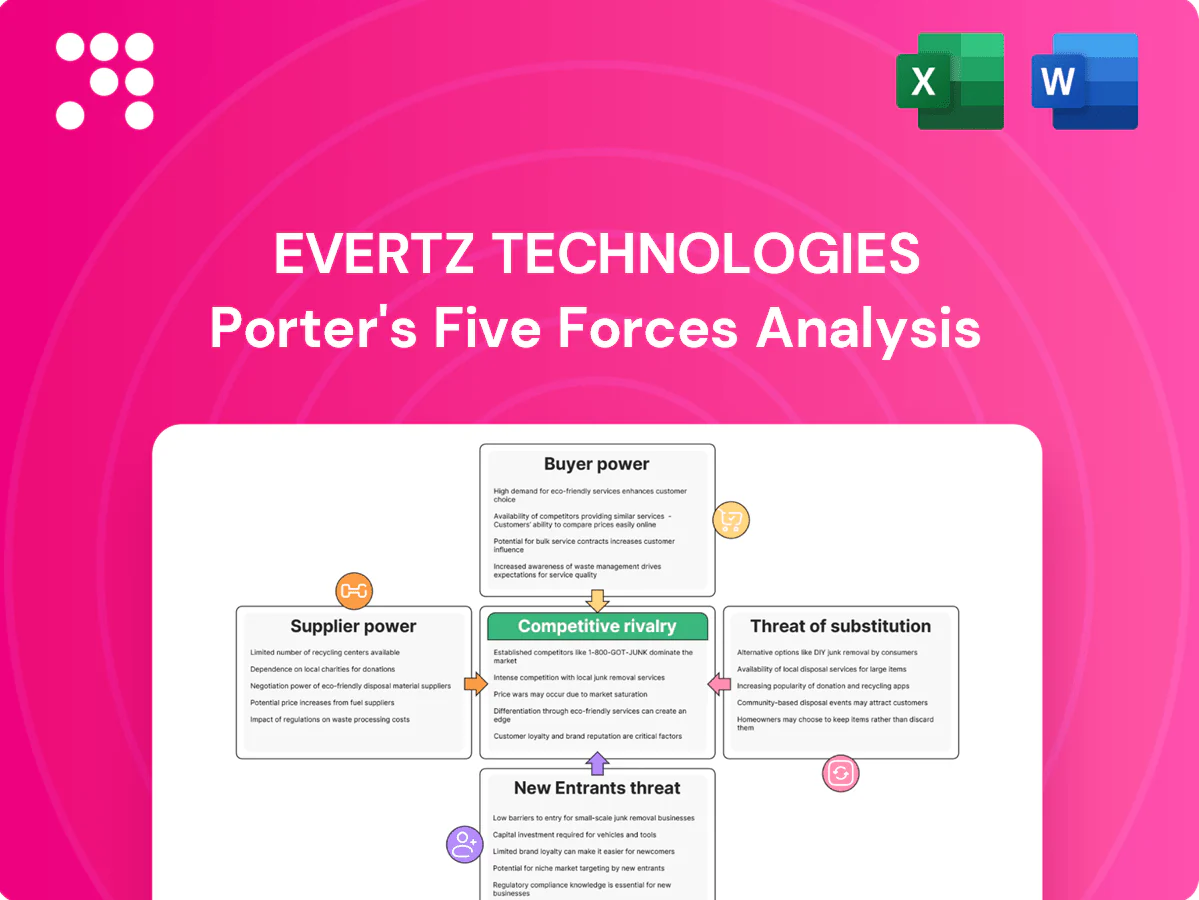
Evertz Technologies Porter's Five Forces Analysis

A Must-Have Tool for Decision-Makers
Evertz Technologies faces moderate supplier power, niche buyer leverage, and evolving substitute threats as broadcast tech shifts to IP and cloud workflows. Competitive rivalry is high among specialized vendors while barriers to entry remain significant for scale-sensitive hardware providers. This brief snapshot only scratches the surface — unlock the full Porter's Five Forces Analysis to explore Evertz’s competitive dynamics, market pressures, and strategic advantages in detail.
Suppliers Bargaining Power

Concentrated chip suppliers
Core components—FPGAs (Xilinx/AMD and Intel ~70–80% share), datacenter GPUs (NVIDIA >80% share) and high‑speed NICs (Mellanox/NVIDIA ~60%)—are concentrated among few vendors; limited substitutes raise switching costs and 12–30 week lead times in 2024, enabling supplier pricing power that can compress Evertz gross margins, so strategic multi‑sourcing and 3–6 months of inventory buffers are essential.
Specialized optics and RF parts
Broadcast-grade optics, SDI and RF modules are sourced from niche manufacturers, creating supplier concentration that amplifies bargaining power. Qualification and compliance cycles often span months, creating customer lock-in and switching costs. Industry lead times commonly run 12–24 weeks, so component shortages can materially delay deliveries. Long-term agreements and volume commitments have been used to temper supply volatility.

Standards-driven dependencies
Compliance with SMPTE 2110, NMOS and 4K/8K HDR ties Evertz product roadmaps directly to supplier silicon and module capabilities, making supplier roadmaps strategic constraints. Firmware and driver support timing from vendors determines feature availability and integration windows. Delays in supplier deliveries and firmware rollouts cascade into customer deployments and SLAs. Co-development and joint test programs with suppliers reduce time-to-market and lower integration risk.

Software stacks and middleware
OS, codecs and middleware licensing materially affect Evertz cost base and deployment flexibility, with shifts to per-seat or consumption licensing able to compress margins; security patch cycles create recurring engineering overhead for broadcast software stacks, and building select in-house alternatives has reduced third-party exposure and accelerated time-to-market.
- OS/codecs licensing pressure on margins
- Security patches add engineering load
- In-house stacks lower supplier risk
Cloud and network partners
Reliance on hyperscalers (AWS, Azure, GCP hold >50% of global IaaS/PaaS in 2024) and IP-switch vendors materially influences Evertz performance and cost, with egress fees (often up to $0.09/GB) and compute pricing shaping TCO. Support SLAs (commonly 99.9–99.99%) and managed-support terms affect solution economics and uptime obligations. Vendor ecosystems create soft lock-in, while multi-cloud strategies and open APIs can restore negotiating leverage.
- hyperscaler share: >50% (2024)
- egress: up to $0.09/GB
- SLAs: 99.9–99.99%
- mitigation: multi-cloud + open APIs
Concentrated FPGA/GPU/NIC suppliers create pricing power; multi-sourcing and LTAs mitigate
Concentrated suppliers (FPGAs: Xilinx/AMD+Intel 70–80%; GPUs: NVIDIA >80%; NICs: Mellanox/NVIDIA ~60%) create pricing power, 12–30 week lead times and high switching costs that can compress Evertz margins; mitigations include multi‑sourcing, 3–6 month inventory, long‑term agreements and co‑development.
| Component | Market share (2024) | Lead time | Mitigation |
|---|---|---|---|
| FPGAs | 70–80% | 12–24 wks | multi‑source, stock |
| GPUs | >80% | 12–30 wks | co‑dev, LTAs |
| NICs | ~60% | 12–20 wks | qualification, backups |
What is included in the product
 Detailed Word Document
Uncovers key drivers of competition, customer influence, and market entry risks tailored exclusively for Evertz Technologies. Evaluates supplier and buyer power, substitutes, new entrant threats, and competitive rivalry to identify disruptive forces and strategic defenses.

 Customizable Excel Spreadsheet
Clear one-sheet Porter's Five Forces for Evertz Technologies that highlights competitive pressures at a glance and soothes decision fatigue; customizable pressure levels and a ready-to-copy spider chart let teams update scenarios, swap in your own data, and drop directly into decks or dashboards without complex tools.
Customers Bargaining Power

Concentrated enterprise buyers
Tier-1 broadcasters, streamers and telcos buy Evertz solutions in large volumes, running formal RFPs and extracting price and support concessions; single account wins or losses can materially swing quarterly backlog and revenue recognition, while marquee reference accounts shape market perception and procurement decisions.
High switching costs yet negotiable
Integrations across hardware, software and workflows create strong stickiness for Evertz, supported by its CAD 451M revenue in 2024 which underpins long-term client projects. Buyers nevertheless use upgrade cycles to negotiate discounts, keeping price pressure moderate. Increasing interoperability standards reduce absolute vendor lock-in, while Evertz’s robust support and services lower churn risk substantially.

Total cost of ownership focus
Customers push total cost of ownership analysis across capex, opex, power (typical broadcast racks 1–3 kW) and space, prioritizing solutions with remote ops and automation that deliver payback often targeted within 12–24 months. Vendors must quantify ROI and show SLA uptime (commonly >99.9%) trade-offs versus price to win deals.

Standards and openness demands
Buyers now demand SMPTE 2110, NMOS and open APIs; major broadcasters and cloud playout providers push back on proprietary lock-in. Proof-of-interoperability (NMOS testbeds, multi-vendor demos active in 2024) is table stakes, raising switching pressure. Open integration increases buyers' bargaining leverage and forces feature-for-compatibility trade-offs for vendors like Evertz.
- Standards: SMPTE 2110/NMOS
- Pushback: reduced tolerance for proprietary lock-in
- 2024: NMOS testbeds/proofs required
- Leverage: open APIs expand buyer negotiation power
Multi-vendor procurement
In 2024, Evertz faces strong customer bargaining as systems are assembled from multiple vendors, making modules readily substitutable and intensifying price pressure. Preferred vendor lists and certification programs still steer procurement decisions, while strong vendor ecosystems capture bundled share and reduce churn.
- Multi-vendor assembly
- Module substitutability
- Preferred vendor influence
- Ecosystem bundle advantage
Tier-1 buyers press broadcast vendors for 12-24 month payback and SMPTE 2110 agility
Tier-1 broadcasters, streamers and telcos exert strong bargaining power over Evertz, with single-account wins affecting backlog and CAD 451M 2024 revenue. Open standards (SMPTE 2110, NMOS testbeds 2024) and multi-vendor assemblies raise switching pressure despite >99.9% SLA and 12–24 month payback demands. Module substitutability and preferred-vendor lists moderate leverage.
| Metric | 2024 |
|---|---|
| Revenue | CAD 451M |
| SLA | >99.9% |
| Rack power | 1–3 kW |
| Payback target | 12–24 months |
What You See Is What You Get
Evertz Technologies Porter's Five Forces Analysis
This preview shows the exact Evertz Technologies Porter's Five Forces Analysis you'll receive—no placeholders or samples. The full document is fully formatted, professionally written, and ready for immediate download upon purchase. What you see here is precisely the deliverable you'll get, complete and usable. No surprises, instant access after payment.

A Must-Have Tool for Decision-Makers
Evertz Technologies faces moderate supplier power, niche buyer leverage, and evolving substitute threats as broadcast tech shifts to IP and cloud workflows. Competitive rivalry is high among specialized vendors while barriers to entry remain significant for scale-sensitive hardware providers. This brief snapshot only scratches the surface — unlock the full Porter's Five Forces Analysis to explore Evertz’s competitive dynamics, market pressures, and strategic advantages in detail.
Suppliers Bargaining Power
Concentrated chip suppliers
Core components—FPGAs (Xilinx/AMD and Intel ~70–80% share), datacenter GPUs (NVIDIA >80% share) and high‑speed NICs (Mellanox/NVIDIA ~60%)—are concentrated among few vendors; limited substitutes raise switching costs and 12–30 week lead times in 2024, enabling supplier pricing power that can compress Evertz gross margins, so strategic multi‑sourcing and 3–6 months of inventory buffers are essential.
Specialized optics and RF parts
Broadcast-grade optics, SDI and RF modules are sourced from niche manufacturers, creating supplier concentration that amplifies bargaining power. Qualification and compliance cycles often span months, creating customer lock-in and switching costs. Industry lead times commonly run 12–24 weeks, so component shortages can materially delay deliveries. Long-term agreements and volume commitments have been used to temper supply volatility.
Standards-driven dependencies
Compliance with SMPTE 2110, NMOS and 4K/8K HDR ties Evertz product roadmaps directly to supplier silicon and module capabilities, making supplier roadmaps strategic constraints. Firmware and driver support timing from vendors determines feature availability and integration windows. Delays in supplier deliveries and firmware rollouts cascade into customer deployments and SLAs. Co-development and joint test programs with suppliers reduce time-to-market and lower integration risk.
Software stacks and middleware
OS, codecs and middleware licensing materially affect Evertz cost base and deployment flexibility, with shifts to per-seat or consumption licensing able to compress margins; security patch cycles create recurring engineering overhead for broadcast software stacks, and building select in-house alternatives has reduced third-party exposure and accelerated time-to-market.
- OS/codecs licensing pressure on margins
- Security patches add engineering load
- In-house stacks lower supplier risk
Cloud and network partners
Reliance on hyperscalers (AWS, Azure, GCP hold >50% of global IaaS/PaaS in 2024) and IP-switch vendors materially influences Evertz performance and cost, with egress fees (often up to $0.09/GB) and compute pricing shaping TCO. Support SLAs (commonly 99.9–99.99%) and managed-support terms affect solution economics and uptime obligations. Vendor ecosystems create soft lock-in, while multi-cloud strategies and open APIs can restore negotiating leverage.
- hyperscaler share: >50% (2024)
- egress: up to $0.09/GB
- SLAs: 99.9–99.99%
- mitigation: multi-cloud + open APIs
Concentrated FPGA/GPU/NIC suppliers create pricing power; multi-sourcing and LTAs mitigate
Concentrated suppliers (FPGAs: Xilinx/AMD+Intel 70–80%; GPUs: NVIDIA >80%; NICs: Mellanox/NVIDIA ~60%) create pricing power, 12–30 week lead times and high switching costs that can compress Evertz margins; mitigations include multi‑sourcing, 3–6 month inventory, long‑term agreements and co‑development.
| Component | Market share (2024) | Lead time | Mitigation |
|---|---|---|---|
| FPGAs | 70–80% | 12–24 wks | multi‑source, stock |
| GPUs | >80% | 12–30 wks | co‑dev, LTAs |
| NICs | ~60% | 12–20 wks | qualification, backups |
What is included in the product
Detailed Word Document
Uncovers key drivers of competition, customer influence, and market entry risks tailored exclusively for Evertz Technologies. Evaluates supplier and buyer power, substitutes, new entrant threats, and competitive rivalry to identify disruptive forces and strategic defenses.
Customizable Excel Spreadsheet
Clear one-sheet Porter's Five Forces for Evertz Technologies that highlights competitive pressures at a glance and soothes decision fatigue; customizable pressure levels and a ready-to-copy spider chart let teams update scenarios, swap in your own data, and drop directly into decks or dashboards without complex tools.
Customers Bargaining Power
Concentrated enterprise buyers
Tier-1 broadcasters, streamers and telcos buy Evertz solutions in large volumes, running formal RFPs and extracting price and support concessions; single account wins or losses can materially swing quarterly backlog and revenue recognition, while marquee reference accounts shape market perception and procurement decisions.
High switching costs yet negotiable
Integrations across hardware, software and workflows create strong stickiness for Evertz, supported by its CAD 451M revenue in 2024 which underpins long-term client projects. Buyers nevertheless use upgrade cycles to negotiate discounts, keeping price pressure moderate. Increasing interoperability standards reduce absolute vendor lock-in, while Evertz’s robust support and services lower churn risk substantially.
Total cost of ownership focus
Customers push total cost of ownership analysis across capex, opex, power (typical broadcast racks 1–3 kW) and space, prioritizing solutions with remote ops and automation that deliver payback often targeted within 12–24 months. Vendors must quantify ROI and show SLA uptime (commonly >99.9%) trade-offs versus price to win deals.
Standards and openness demands
Buyers now demand SMPTE 2110, NMOS and open APIs; major broadcasters and cloud playout providers push back on proprietary lock-in. Proof-of-interoperability (NMOS testbeds, multi-vendor demos active in 2024) is table stakes, raising switching pressure. Open integration increases buyers' bargaining leverage and forces feature-for-compatibility trade-offs for vendors like Evertz.
- Standards: SMPTE 2110/NMOS
- Pushback: reduced tolerance for proprietary lock-in
- 2024: NMOS testbeds/proofs required
- Leverage: open APIs expand buyer negotiation power
Multi-vendor procurement
In 2024, Evertz faces strong customer bargaining as systems are assembled from multiple vendors, making modules readily substitutable and intensifying price pressure. Preferred vendor lists and certification programs still steer procurement decisions, while strong vendor ecosystems capture bundled share and reduce churn.
- Multi-vendor assembly
- Module substitutability
- Preferred vendor influence
- Ecosystem bundle advantage
Tier-1 buyers press broadcast vendors for 12-24 month payback and SMPTE 2110 agility
Tier-1 broadcasters, streamers and telcos exert strong bargaining power over Evertz, with single-account wins affecting backlog and CAD 451M 2024 revenue. Open standards (SMPTE 2110, NMOS testbeds 2024) and multi-vendor assemblies raise switching pressure despite >99.9% SLA and 12–24 month payback demands. Module substitutability and preferred-vendor lists moderate leverage.
| Metric | 2024 |
|---|---|
| Revenue | CAD 451M |
| SLA | >99.9% |
| Rack power | 1–3 kW |
| Payback target | 12–24 months |
What You See Is What You Get
Evertz Technologies Porter's Five Forces Analysis
This preview shows the exact Evertz Technologies Porter's Five Forces Analysis you'll receive—no placeholders or samples. The full document is fully formatted, professionally written, and ready for immediate download upon purchase. What you see here is precisely the deliverable you'll get, complete and usable. No surprises, instant access after payment.
Description
A Must-Have Tool for Decision-Makers
Evertz Technologies faces moderate supplier power, niche buyer leverage, and evolving substitute threats as broadcast tech shifts to IP and cloud workflows. Competitive rivalry is high among specialized vendors while barriers to entry remain significant for scale-sensitive hardware providers. This brief snapshot only scratches the surface — unlock the full Porter's Five Forces Analysis to explore Evertz’s competitive dynamics, market pressures, and strategic advantages in detail.
Suppliers Bargaining Power
Concentrated chip suppliers
Core components—FPGAs (Xilinx/AMD and Intel ~70–80% share), datacenter GPUs (NVIDIA >80% share) and high‑speed NICs (Mellanox/NVIDIA ~60%)—are concentrated among few vendors; limited substitutes raise switching costs and 12–30 week lead times in 2024, enabling supplier pricing power that can compress Evertz gross margins, so strategic multi‑sourcing and 3–6 months of inventory buffers are essential.
Specialized optics and RF parts
Broadcast-grade optics, SDI and RF modules are sourced from niche manufacturers, creating supplier concentration that amplifies bargaining power. Qualification and compliance cycles often span months, creating customer lock-in and switching costs. Industry lead times commonly run 12–24 weeks, so component shortages can materially delay deliveries. Long-term agreements and volume commitments have been used to temper supply volatility.
Standards-driven dependencies
Compliance with SMPTE 2110, NMOS and 4K/8K HDR ties Evertz product roadmaps directly to supplier silicon and module capabilities, making supplier roadmaps strategic constraints. Firmware and driver support timing from vendors determines feature availability and integration windows. Delays in supplier deliveries and firmware rollouts cascade into customer deployments and SLAs. Co-development and joint test programs with suppliers reduce time-to-market and lower integration risk.
Software stacks and middleware
OS, codecs and middleware licensing materially affect Evertz cost base and deployment flexibility, with shifts to per-seat or consumption licensing able to compress margins; security patch cycles create recurring engineering overhead for broadcast software stacks, and building select in-house alternatives has reduced third-party exposure and accelerated time-to-market.
- OS/codecs licensing pressure on margins
- Security patches add engineering load
- In-house stacks lower supplier risk
Cloud and network partners
Reliance on hyperscalers (AWS, Azure, GCP hold >50% of global IaaS/PaaS in 2024) and IP-switch vendors materially influences Evertz performance and cost, with egress fees (often up to $0.09/GB) and compute pricing shaping TCO. Support SLAs (commonly 99.9–99.99%) and managed-support terms affect solution economics and uptime obligations. Vendor ecosystems create soft lock-in, while multi-cloud strategies and open APIs can restore negotiating leverage.
- hyperscaler share: >50% (2024)
- egress: up to $0.09/GB
- SLAs: 99.9–99.99%
- mitigation: multi-cloud + open APIs
Concentrated FPGA/GPU/NIC suppliers create pricing power; multi-sourcing and LTAs mitigate
Concentrated suppliers (FPGAs: Xilinx/AMD+Intel 70–80%; GPUs: NVIDIA >80%; NICs: Mellanox/NVIDIA ~60%) create pricing power, 12–30 week lead times and high switching costs that can compress Evertz margins; mitigations include multi‑sourcing, 3–6 month inventory, long‑term agreements and co‑development.
| Component | Market share (2024) | Lead time | Mitigation |
|---|---|---|---|
| FPGAs | 70–80% | 12–24 wks | multi‑source, stock |
| GPUs | >80% | 12–30 wks | co‑dev, LTAs |
| NICs | ~60% | 12–20 wks | qualification, backups |
What is included in the product
Detailed Word Document
Uncovers key drivers of competition, customer influence, and market entry risks tailored exclusively for Evertz Technologies. Evaluates supplier and buyer power, substitutes, new entrant threats, and competitive rivalry to identify disruptive forces and strategic defenses.
Customizable Excel Spreadsheet
Clear one-sheet Porter's Five Forces for Evertz Technologies that highlights competitive pressures at a glance and soothes decision fatigue; customizable pressure levels and a ready-to-copy spider chart let teams update scenarios, swap in your own data, and drop directly into decks or dashboards without complex tools.
Customers Bargaining Power
Concentrated enterprise buyers
Tier-1 broadcasters, streamers and telcos buy Evertz solutions in large volumes, running formal RFPs and extracting price and support concessions; single account wins or losses can materially swing quarterly backlog and revenue recognition, while marquee reference accounts shape market perception and procurement decisions.
High switching costs yet negotiable
Integrations across hardware, software and workflows create strong stickiness for Evertz, supported by its CAD 451M revenue in 2024 which underpins long-term client projects. Buyers nevertheless use upgrade cycles to negotiate discounts, keeping price pressure moderate. Increasing interoperability standards reduce absolute vendor lock-in, while Evertz’s robust support and services lower churn risk substantially.
Total cost of ownership focus
Customers push total cost of ownership analysis across capex, opex, power (typical broadcast racks 1–3 kW) and space, prioritizing solutions with remote ops and automation that deliver payback often targeted within 12–24 months. Vendors must quantify ROI and show SLA uptime (commonly >99.9%) trade-offs versus price to win deals.
Standards and openness demands
Buyers now demand SMPTE 2110, NMOS and open APIs; major broadcasters and cloud playout providers push back on proprietary lock-in. Proof-of-interoperability (NMOS testbeds, multi-vendor demos active in 2024) is table stakes, raising switching pressure. Open integration increases buyers' bargaining leverage and forces feature-for-compatibility trade-offs for vendors like Evertz.
- Standards: SMPTE 2110/NMOS
- Pushback: reduced tolerance for proprietary lock-in
- 2024: NMOS testbeds/proofs required
- Leverage: open APIs expand buyer negotiation power
Multi-vendor procurement
In 2024, Evertz faces strong customer bargaining as systems are assembled from multiple vendors, making modules readily substitutable and intensifying price pressure. Preferred vendor lists and certification programs still steer procurement decisions, while strong vendor ecosystems capture bundled share and reduce churn.
- Multi-vendor assembly
- Module substitutability
- Preferred vendor influence
- Ecosystem bundle advantage
Tier-1 buyers press broadcast vendors for 12-24 month payback and SMPTE 2110 agility
Tier-1 broadcasters, streamers and telcos exert strong bargaining power over Evertz, with single-account wins affecting backlog and CAD 451M 2024 revenue. Open standards (SMPTE 2110, NMOS testbeds 2024) and multi-vendor assemblies raise switching pressure despite >99.9% SLA and 12–24 month payback demands. Module substitutability and preferred-vendor lists moderate leverage.
| Metric | 2024 |
|---|---|
| Revenue | CAD 451M |
| SLA | >99.9% |
| Rack power | 1–3 kW |
| Payback target | 12–24 months |
What You See Is What You Get
Evertz Technologies Porter's Five Forces Analysis
This preview shows the exact Evertz Technologies Porter's Five Forces Analysis you'll receive—no placeholders or samples. The full document is fully formatted, professionally written, and ready for immediate download upon purchase. What you see here is precisely the deliverable you'll get, complete and usable. No surprises, instant access after payment.











