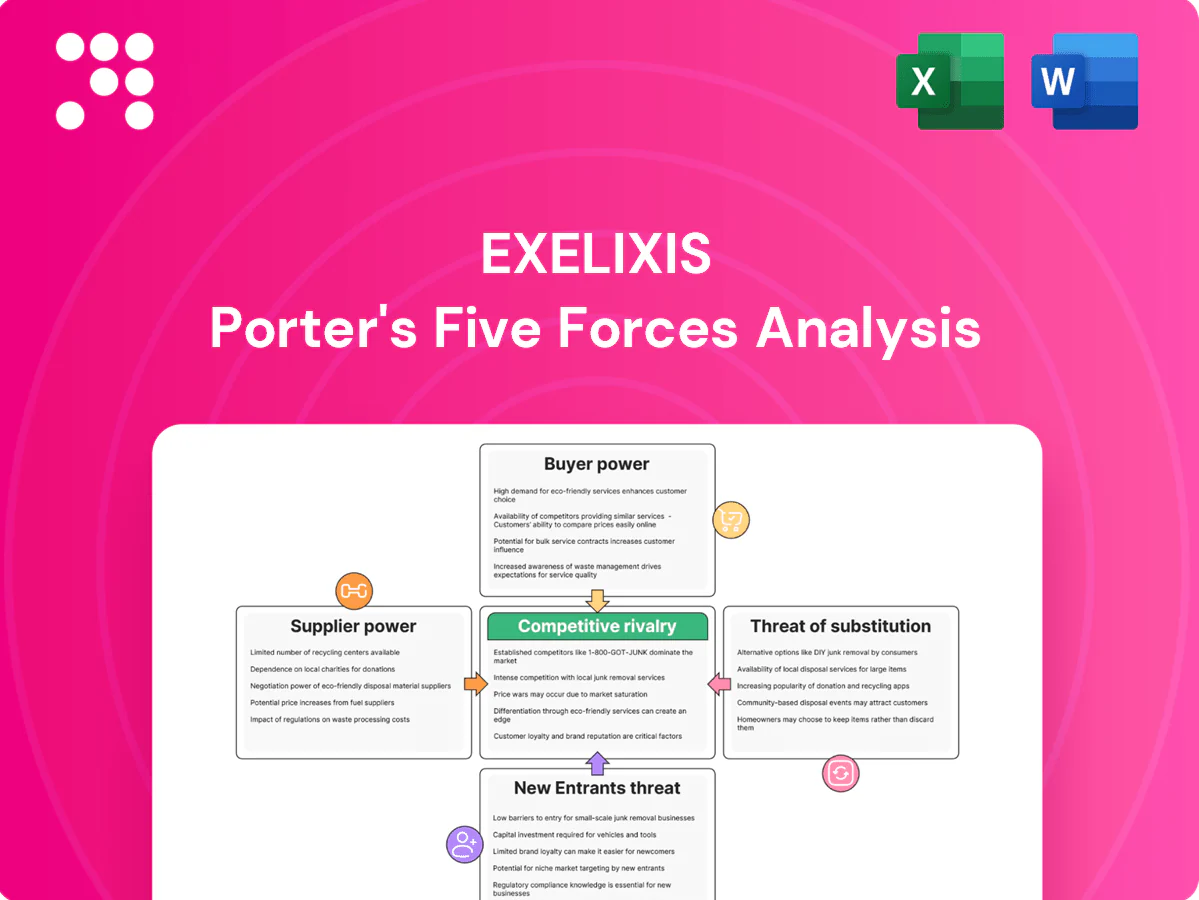
Exelixis Porter's Five Forces Analysis

Go Beyond the Preview—Access the Full Strategic Report
Exelixis faces intense rivalry from established oncology peers, high buyer scrutiny from payers and providers, and moderate supplier power tied to specialty manufacturing; patent portfolios and clinical pipeline shape barriers to entry and substitute threats. This snapshot highlights strategic pressures on pricing, R&D priorities, and partnership choices.
This preview is just the beginning. The full Porter's Five Forces Analysis provides force-by-force ratings, visuals, and business implications tailored to Exelixis.
Suppliers Bargaining Power

Concentrated specialty CMOs
Exelixis depends on a limited pool of GMP-qualified CMOs for small-molecule APIs and finished doses, concentrating supplier power and raising switching costs, validation burdens, and lead-time risk. Long-term agreements reduce supply risk but can lock in vendor pricing power. Dual-sourcing and inventory buffers partially mitigate disruptions.
Biologics and assay dependencies
Immunotherapy workstreams for Exelixis depend on specialized biologics, assays and companion diagnostics where only a handful of validated providers meet 2024 regulatory and commercial quality standards; this consolidation raises supplier leverage. Lead times and complex tech transfers extend timelines and increase switching costs, giving suppliers negotiating advantage. Co-development of diagnostics often creates supplier lock-in through proprietary assays and data sharing arrangements.

CROs and clinical site capacity
R&D for Exelixis relies heavily on CROs and high-performing oncology sites, with the global CRO market reaching about $64 billion in 2024 and oncology representing roughly 30% of trial volume, creating concentrated demand for limited site capacity.
Competing sponsors vie for the same investigators and patients, pushing site fees and per-patient costs up—site activation now often takes 90–120 days—so performance-based contracts mitigate but do not eliminate bottlenecks.
Geographic diversification across North America, Europe and select APAC centers reduces enrollment risk and shortens median enrollment timelines by improving patient access and investigator availability.

Proprietary platform/tool vendors
Access to niche discovery tools, bioinformatics and cell models often requires proprietary licenses (Illumina held ~70% NGS market share in 2024), creating vendor uniqueness and data lock-in that raise dependency and switching costs.
Negotiating broad-use rights can be costly; reliance on AWS (≈33% cloud IaaS share in 2024) or specialized vendors increases bargaining power, while building internal capabilities reduces dependence but needs sustained R&D investment.
Regulated quality and compliance costs
Regulated quality shifts validation burdens onto Exelixis suppliers, who pass through higher compliance costs into contracts; audit findings often force remediation or requalification, delaying programs and reprioritizing production schedules.
Preferred-supplier status improves priority but brings higher baseline pricing; rigorous quality-by-design narrows acceptable vendor alternatives, concentrating supplier power and raising switching costs.
- Suppliers absorb validation then pass costs
- Audits can trigger remediation and delays
- Preferred status = higher price, faster priority
- Quality-by-design shrinks vendor pool
Supplier concentration in GMP CMOs, CROs and diagnostics amplifies pricing and timing leverage
High supplier concentration for GMP CMOs, CROs and diagnostics gives suppliers pricing and timing leverage over Exelixis.
CRO market ≈$64B (2024) with oncology ≈30% increases site/capacity pressure and costs.
Key vendors: Illumina ≈70% NGS share (2024); AWS ≈33% IaaS (2024) — raises lock-in and switching costs.
Long-term contracts reduce disruption risk but preserve supplier pricing power.
| Metric | 2024 |
|---|---|
| CRO market | $64B |
| Oncology share | ~30% |
| Illumina NGS | ~70% |
| AWS IaaS | ~33% |
What is included in the product
 Detailed Word Document
Tailored Porter's Five Forces analysis for Exelixis that uncovers competitive intensity, buyer/supplier power, threat of substitutes and new entrants, and highlights disruptive forces and market dynamics shaping its profitability.

 Customizable Excel Spreadsheet
One-sheet Porter's Five Forces for Exelixis that distills competitive pressures into a radar chart for instant strategic clarity, with editable pressure levels and labels to model scenarios (e.g., new drug entrants or regulatory shifts) and no macros—ready to drop into decks or Excel dashboards.
Customers Bargaining Power

Payers and PBMs’ formulary control
US payers and PBMs exert outsized leverage over oncology pricing and access, with the three largest PBMs covering roughly 70–80% of prescription drug lives, enabling broad use of step therapy, prior authorization, and rebate-driven formulary placement that compresses Exelixis’s net price realization. Robust overall survival or quality-of-life data for a drug reduces buyer bargaining power by increasing clinical indispensability. Value-based contracts can align incentives but typically limit upside by linking payment to outcomes and sharing risk.
Oncologist and center-of-excellence influence
Prescribing in oncology is concentrated among specialists at leading centers—there are 72 NCI-designated cancer centers in 2024 that drive referral patterns and adoption. KOL preferences and guideline inclusion meaningfully steer uptake, often determining formulary placement and prescribing habits. Differentiated efficacy in defined subpopulations reduces buyer sensitivity by creating niche demand. Real-world outcomes can reinforce or erode physician leverage through post-marketing effectiveness signals.

International HTA and tender pressure
Ex-US markets rely on HTA bodies and national tenders to set drug prices, with tenders often producing double-digit discounts (commonly 20–60%) and reference pricing used by over 50 countries, intensifying buyer leverage. Budget caps and affordability thresholds force payers to limit uptake; demonstrable cost-effectiveness is essential to defend value. Local commercial partners ease access but share pricing and margins, reducing Exelixis net revenue per region.

Patient advocacy and access programs
Patient advocacy and access programs push for broader, affordable access to Exelixis therapies; co-pay support and free-drug programs ease patient resistance but compress net revenues, while strong safety data for Cabometyx and other agents supports price retention; higher toxicity increases bargaining for discounts or switches to lower-toxicity alternatives.
- Patient groups: broader access and affordability
- Assistance programs: lower patient costs, reduce net revenue
- Safety profile: enables higher pricing
- Toxicity: drives discount demands or therapy substitution
Availability of therapeutic alternatives
Availability of multiple approved first-line combos (three major competing regimens in metastatic RCC as of 2024) strengthens buyer negotiating leverage over Exelixis on price and formulary placement; cabozantinib (Cabometyx) retains countervailing power through unique VEGFR/MET/AXL inhibition and demonstrated combo synergies with nivolumab that reduce direct substitutability. Label breadth across RCC, HCC and differentiated thyroid cancer expands placement options, but post-patent generic entry typically shifts pricing power decisively to buyers, often causing innovators to face steep price erosion.
- Three major 1L RCC combos (2024)
- Cabozantinib approved in RCC, HCC, DTC
- Unique mechanism + nivolumab synergy lowers substitutability
- Post-patent generic entry often triggers substantial price erosion
Top-3 PBMs drive ~75% drug lives; ex-US tenders cut prices 20-60%
Top-3 US PBMs cover ~75% of drug lives in 2024, using rebates/step therapy that compress Exelixis net price. HTA bodies and tenders drive 20–60% discounts ex‑US; reference pricing used by 50+ countries. Strong OS/QoL data and label breadth (RCC, HCC, DTC) reduce buyer leverage, but post‑patent generics trigger steep price erosion.
| Metric | 2024 | Impact |
|---|---|---|
| Top‑3 PBM share | ~75% | High pricing pressure |
| Ex‑US tender discounts | 20–60% | Revenue reduction |
Full Version Awaits
Exelixis Porter's Five Forces Analysis
This preview shows the exact Exelixis Porter’s Five Forces analysis you’ll receive—fully written, formatted, and ready for use. No placeholders, mockups, or truncated samples are included. Purchase grants immediate access to this identical file for download. What you see here is the final deliverable.

Go Beyond the Preview—Access the Full Strategic Report
Exelixis faces intense rivalry from established oncology peers, high buyer scrutiny from payers and providers, and moderate supplier power tied to specialty manufacturing; patent portfolios and clinical pipeline shape barriers to entry and substitute threats. This snapshot highlights strategic pressures on pricing, R&D priorities, and partnership choices.
This preview is just the beginning. The full Porter's Five Forces Analysis provides force-by-force ratings, visuals, and business implications tailored to Exelixis.
Suppliers Bargaining Power
Concentrated specialty CMOs
Exelixis depends on a limited pool of GMP-qualified CMOs for small-molecule APIs and finished doses, concentrating supplier power and raising switching costs, validation burdens, and lead-time risk. Long-term agreements reduce supply risk but can lock in vendor pricing power. Dual-sourcing and inventory buffers partially mitigate disruptions.
Biologics and assay dependencies
Immunotherapy workstreams for Exelixis depend on specialized biologics, assays and companion diagnostics where only a handful of validated providers meet 2024 regulatory and commercial quality standards; this consolidation raises supplier leverage. Lead times and complex tech transfers extend timelines and increase switching costs, giving suppliers negotiating advantage. Co-development of diagnostics often creates supplier lock-in through proprietary assays and data sharing arrangements.
CROs and clinical site capacity
R&D for Exelixis relies heavily on CROs and high-performing oncology sites, with the global CRO market reaching about $64 billion in 2024 and oncology representing roughly 30% of trial volume, creating concentrated demand for limited site capacity.
Competing sponsors vie for the same investigators and patients, pushing site fees and per-patient costs up—site activation now often takes 90–120 days—so performance-based contracts mitigate but do not eliminate bottlenecks.
Geographic diversification across North America, Europe and select APAC centers reduces enrollment risk and shortens median enrollment timelines by improving patient access and investigator availability.
Proprietary platform/tool vendors
Access to niche discovery tools, bioinformatics and cell models often requires proprietary licenses (Illumina held ~70% NGS market share in 2024), creating vendor uniqueness and data lock-in that raise dependency and switching costs.
Negotiating broad-use rights can be costly; reliance on AWS (≈33% cloud IaaS share in 2024) or specialized vendors increases bargaining power, while building internal capabilities reduces dependence but needs sustained R&D investment.
Regulated quality and compliance costs
Regulated quality shifts validation burdens onto Exelixis suppliers, who pass through higher compliance costs into contracts; audit findings often force remediation or requalification, delaying programs and reprioritizing production schedules.
Preferred-supplier status improves priority but brings higher baseline pricing; rigorous quality-by-design narrows acceptable vendor alternatives, concentrating supplier power and raising switching costs.
- Suppliers absorb validation then pass costs
- Audits can trigger remediation and delays
- Preferred status = higher price, faster priority
- Quality-by-design shrinks vendor pool
Supplier concentration in GMP CMOs, CROs and diagnostics amplifies pricing and timing leverage
High supplier concentration for GMP CMOs, CROs and diagnostics gives suppliers pricing and timing leverage over Exelixis.
CRO market ≈$64B (2024) with oncology ≈30% increases site/capacity pressure and costs.
Key vendors: Illumina ≈70% NGS share (2024); AWS ≈33% IaaS (2024) — raises lock-in and switching costs.
Long-term contracts reduce disruption risk but preserve supplier pricing power.
| Metric | 2024 |
|---|---|
| CRO market | $64B |
| Oncology share | ~30% |
| Illumina NGS | ~70% |
| AWS IaaS | ~33% |
What is included in the product
Detailed Word Document
Tailored Porter's Five Forces analysis for Exelixis that uncovers competitive intensity, buyer/supplier power, threat of substitutes and new entrants, and highlights disruptive forces and market dynamics shaping its profitability.
Customizable Excel Spreadsheet
One-sheet Porter's Five Forces for Exelixis that distills competitive pressures into a radar chart for instant strategic clarity, with editable pressure levels and labels to model scenarios (e.g., new drug entrants or regulatory shifts) and no macros—ready to drop into decks or Excel dashboards.
Customers Bargaining Power
Payers and PBMs’ formulary control
US payers and PBMs exert outsized leverage over oncology pricing and access, with the three largest PBMs covering roughly 70–80% of prescription drug lives, enabling broad use of step therapy, prior authorization, and rebate-driven formulary placement that compresses Exelixis’s net price realization. Robust overall survival or quality-of-life data for a drug reduces buyer bargaining power by increasing clinical indispensability. Value-based contracts can align incentives but typically limit upside by linking payment to outcomes and sharing risk.
Oncologist and center-of-excellence influence
Prescribing in oncology is concentrated among specialists at leading centers—there are 72 NCI-designated cancer centers in 2024 that drive referral patterns and adoption. KOL preferences and guideline inclusion meaningfully steer uptake, often determining formulary placement and prescribing habits. Differentiated efficacy in defined subpopulations reduces buyer sensitivity by creating niche demand. Real-world outcomes can reinforce or erode physician leverage through post-marketing effectiveness signals.
International HTA and tender pressure
Ex-US markets rely on HTA bodies and national tenders to set drug prices, with tenders often producing double-digit discounts (commonly 20–60%) and reference pricing used by over 50 countries, intensifying buyer leverage. Budget caps and affordability thresholds force payers to limit uptake; demonstrable cost-effectiveness is essential to defend value. Local commercial partners ease access but share pricing and margins, reducing Exelixis net revenue per region.
Patient advocacy and access programs
Patient advocacy and access programs push for broader, affordable access to Exelixis therapies; co-pay support and free-drug programs ease patient resistance but compress net revenues, while strong safety data for Cabometyx and other agents supports price retention; higher toxicity increases bargaining for discounts or switches to lower-toxicity alternatives.
- Patient groups: broader access and affordability
- Assistance programs: lower patient costs, reduce net revenue
- Safety profile: enables higher pricing
- Toxicity: drives discount demands or therapy substitution
Availability of therapeutic alternatives
Availability of multiple approved first-line combos (three major competing regimens in metastatic RCC as of 2024) strengthens buyer negotiating leverage over Exelixis on price and formulary placement; cabozantinib (Cabometyx) retains countervailing power through unique VEGFR/MET/AXL inhibition and demonstrated combo synergies with nivolumab that reduce direct substitutability. Label breadth across RCC, HCC and differentiated thyroid cancer expands placement options, but post-patent generic entry typically shifts pricing power decisively to buyers, often causing innovators to face steep price erosion.
- Three major 1L RCC combos (2024)
- Cabozantinib approved in RCC, HCC, DTC
- Unique mechanism + nivolumab synergy lowers substitutability
- Post-patent generic entry often triggers substantial price erosion
Top-3 PBMs drive ~75% drug lives; ex-US tenders cut prices 20-60%
Top-3 US PBMs cover ~75% of drug lives in 2024, using rebates/step therapy that compress Exelixis net price. HTA bodies and tenders drive 20–60% discounts ex‑US; reference pricing used by 50+ countries. Strong OS/QoL data and label breadth (RCC, HCC, DTC) reduce buyer leverage, but post‑patent generics trigger steep price erosion.
| Metric | 2024 | Impact |
|---|---|---|
| Top‑3 PBM share | ~75% | High pricing pressure |
| Ex‑US tender discounts | 20–60% | Revenue reduction |
Full Version Awaits
Exelixis Porter's Five Forces Analysis
This preview shows the exact Exelixis Porter’s Five Forces analysis you’ll receive—fully written, formatted, and ready for use. No placeholders, mockups, or truncated samples are included. Purchase grants immediate access to this identical file for download. What you see here is the final deliverable.
Description
Go Beyond the Preview—Access the Full Strategic Report
Exelixis faces intense rivalry from established oncology peers, high buyer scrutiny from payers and providers, and moderate supplier power tied to specialty manufacturing; patent portfolios and clinical pipeline shape barriers to entry and substitute threats. This snapshot highlights strategic pressures on pricing, R&D priorities, and partnership choices.
This preview is just the beginning. The full Porter's Five Forces Analysis provides force-by-force ratings, visuals, and business implications tailored to Exelixis.
Suppliers Bargaining Power
Concentrated specialty CMOs
Exelixis depends on a limited pool of GMP-qualified CMOs for small-molecule APIs and finished doses, concentrating supplier power and raising switching costs, validation burdens, and lead-time risk. Long-term agreements reduce supply risk but can lock in vendor pricing power. Dual-sourcing and inventory buffers partially mitigate disruptions.
Biologics and assay dependencies
Immunotherapy workstreams for Exelixis depend on specialized biologics, assays and companion diagnostics where only a handful of validated providers meet 2024 regulatory and commercial quality standards; this consolidation raises supplier leverage. Lead times and complex tech transfers extend timelines and increase switching costs, giving suppliers negotiating advantage. Co-development of diagnostics often creates supplier lock-in through proprietary assays and data sharing arrangements.
CROs and clinical site capacity
R&D for Exelixis relies heavily on CROs and high-performing oncology sites, with the global CRO market reaching about $64 billion in 2024 and oncology representing roughly 30% of trial volume, creating concentrated demand for limited site capacity.
Competing sponsors vie for the same investigators and patients, pushing site fees and per-patient costs up—site activation now often takes 90–120 days—so performance-based contracts mitigate but do not eliminate bottlenecks.
Geographic diversification across North America, Europe and select APAC centers reduces enrollment risk and shortens median enrollment timelines by improving patient access and investigator availability.
Proprietary platform/tool vendors
Access to niche discovery tools, bioinformatics and cell models often requires proprietary licenses (Illumina held ~70% NGS market share in 2024), creating vendor uniqueness and data lock-in that raise dependency and switching costs.
Negotiating broad-use rights can be costly; reliance on AWS (≈33% cloud IaaS share in 2024) or specialized vendors increases bargaining power, while building internal capabilities reduces dependence but needs sustained R&D investment.
Regulated quality and compliance costs
Regulated quality shifts validation burdens onto Exelixis suppliers, who pass through higher compliance costs into contracts; audit findings often force remediation or requalification, delaying programs and reprioritizing production schedules.
Preferred-supplier status improves priority but brings higher baseline pricing; rigorous quality-by-design narrows acceptable vendor alternatives, concentrating supplier power and raising switching costs.
- Suppliers absorb validation then pass costs
- Audits can trigger remediation and delays
- Preferred status = higher price, faster priority
- Quality-by-design shrinks vendor pool
Supplier concentration in GMP CMOs, CROs and diagnostics amplifies pricing and timing leverage
High supplier concentration for GMP CMOs, CROs and diagnostics gives suppliers pricing and timing leverage over Exelixis.
CRO market ≈$64B (2024) with oncology ≈30% increases site/capacity pressure and costs.
Key vendors: Illumina ≈70% NGS share (2024); AWS ≈33% IaaS (2024) — raises lock-in and switching costs.
Long-term contracts reduce disruption risk but preserve supplier pricing power.
| Metric | 2024 |
|---|---|
| CRO market | $64B |
| Oncology share | ~30% |
| Illumina NGS | ~70% |
| AWS IaaS | ~33% |
What is included in the product
Detailed Word Document
Tailored Porter's Five Forces analysis for Exelixis that uncovers competitive intensity, buyer/supplier power, threat of substitutes and new entrants, and highlights disruptive forces and market dynamics shaping its profitability.
Customizable Excel Spreadsheet
One-sheet Porter's Five Forces for Exelixis that distills competitive pressures into a radar chart for instant strategic clarity, with editable pressure levels and labels to model scenarios (e.g., new drug entrants or regulatory shifts) and no macros—ready to drop into decks or Excel dashboards.
Customers Bargaining Power
Payers and PBMs’ formulary control
US payers and PBMs exert outsized leverage over oncology pricing and access, with the three largest PBMs covering roughly 70–80% of prescription drug lives, enabling broad use of step therapy, prior authorization, and rebate-driven formulary placement that compresses Exelixis’s net price realization. Robust overall survival or quality-of-life data for a drug reduces buyer bargaining power by increasing clinical indispensability. Value-based contracts can align incentives but typically limit upside by linking payment to outcomes and sharing risk.
Oncologist and center-of-excellence influence
Prescribing in oncology is concentrated among specialists at leading centers—there are 72 NCI-designated cancer centers in 2024 that drive referral patterns and adoption. KOL preferences and guideline inclusion meaningfully steer uptake, often determining formulary placement and prescribing habits. Differentiated efficacy in defined subpopulations reduces buyer sensitivity by creating niche demand. Real-world outcomes can reinforce or erode physician leverage through post-marketing effectiveness signals.
International HTA and tender pressure
Ex-US markets rely on HTA bodies and national tenders to set drug prices, with tenders often producing double-digit discounts (commonly 20–60%) and reference pricing used by over 50 countries, intensifying buyer leverage. Budget caps and affordability thresholds force payers to limit uptake; demonstrable cost-effectiveness is essential to defend value. Local commercial partners ease access but share pricing and margins, reducing Exelixis net revenue per region.
Patient advocacy and access programs
Patient advocacy and access programs push for broader, affordable access to Exelixis therapies; co-pay support and free-drug programs ease patient resistance but compress net revenues, while strong safety data for Cabometyx and other agents supports price retention; higher toxicity increases bargaining for discounts or switches to lower-toxicity alternatives.
- Patient groups: broader access and affordability
- Assistance programs: lower patient costs, reduce net revenue
- Safety profile: enables higher pricing
- Toxicity: drives discount demands or therapy substitution
Availability of therapeutic alternatives
Availability of multiple approved first-line combos (three major competing regimens in metastatic RCC as of 2024) strengthens buyer negotiating leverage over Exelixis on price and formulary placement; cabozantinib (Cabometyx) retains countervailing power through unique VEGFR/MET/AXL inhibition and demonstrated combo synergies with nivolumab that reduce direct substitutability. Label breadth across RCC, HCC and differentiated thyroid cancer expands placement options, but post-patent generic entry typically shifts pricing power decisively to buyers, often causing innovators to face steep price erosion.
- Three major 1L RCC combos (2024)
- Cabozantinib approved in RCC, HCC, DTC
- Unique mechanism + nivolumab synergy lowers substitutability
- Post-patent generic entry often triggers substantial price erosion
Top-3 PBMs drive ~75% drug lives; ex-US tenders cut prices 20-60%
Top-3 US PBMs cover ~75% of drug lives in 2024, using rebates/step therapy that compress Exelixis net price. HTA bodies and tenders drive 20–60% discounts ex‑US; reference pricing used by 50+ countries. Strong OS/QoL data and label breadth (RCC, HCC, DTC) reduce buyer leverage, but post‑patent generics trigger steep price erosion.
| Metric | 2024 | Impact |
|---|---|---|
| Top‑3 PBM share | ~75% | High pricing pressure |
| Ex‑US tender discounts | 20–60% | Revenue reduction |
Full Version Awaits
Exelixis Porter's Five Forces Analysis
This preview shows the exact Exelixis Porter’s Five Forces analysis you’ll receive—fully written, formatted, and ready for use. No placeholders, mockups, or truncated samples are included. Purchase grants immediate access to this identical file for download. What you see here is the final deliverable.











