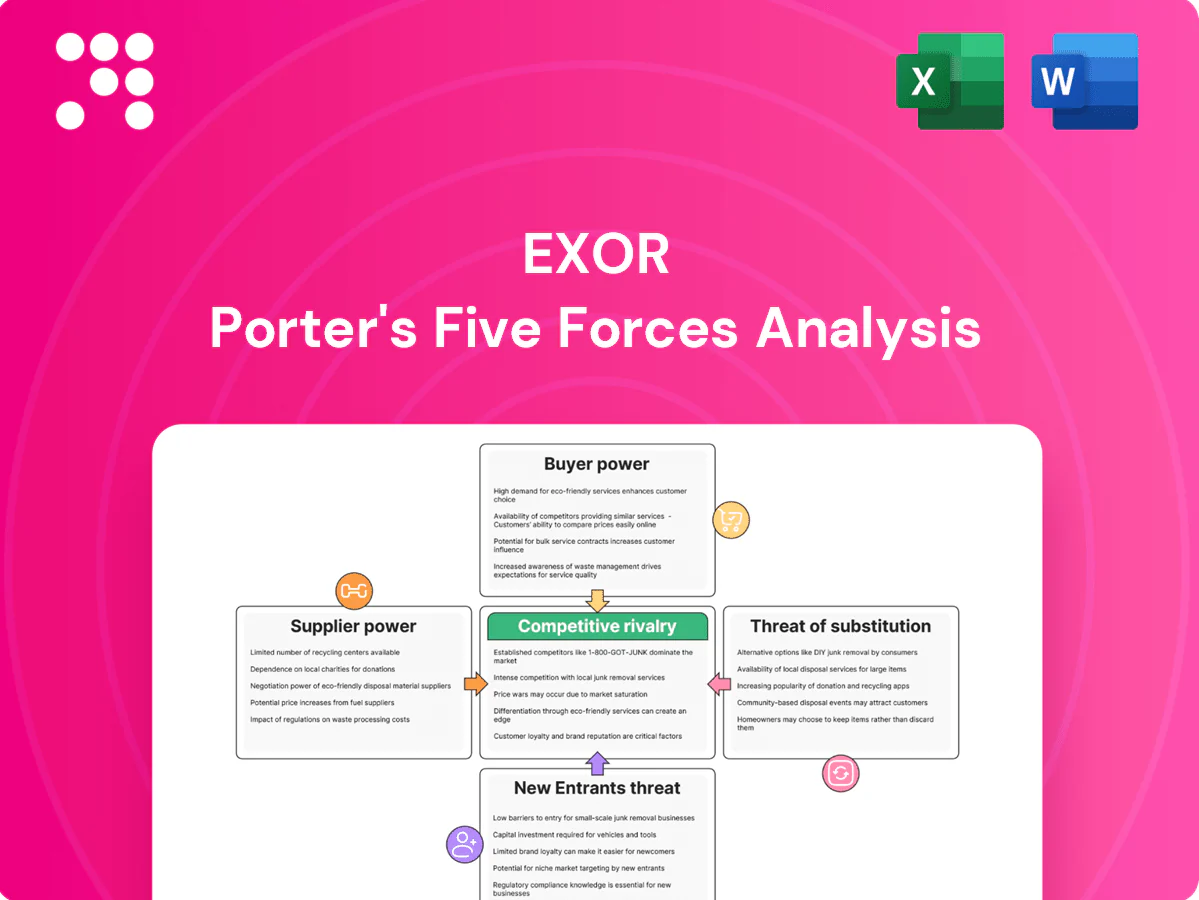
EXOR Porter's Five Forces Analysis

Don't Miss the Bigger Picture
EXOR's diversified portfolio and significant stakes in premium asset classes temper supplier and buyer power, but exposure to cyclical sectors and regulatory scrutiny elevates competitive tension; substitutes and new entrants remain moderate risks. Strategic positioning and ownership advantages create resilience, yet force-by-force nuances matter for valuation and risk. This brief snapshot only scratches the surface—unlock the full Porter's Five Forces Analysis to explore EXOR’s competitive dynamics, market pressures, and strategic advantages in detail.
Suppliers Bargaining Power

Diverse input base across sectors
Exor’s diversified 2024 portfolio across automotive, luxury, healthcare and financial services dilutes reliance on any single supplier group. Key inputs range from semiconductors and batteries to clinical services and data, creating varied procurement dynamics. This heterogeneity lowers systemic supplier leverage at the holding level, though local bottlenecks can still transmit material risk to individual portfolio companies.
Capital and deal-flow intermediaries
Investment banks, co-investors and private equity funds supply deal flow and financing, and in hot markets their fees and underwriting terms tighten, raising Exor’s transaction costs. Exor’s patient capital model and strong brand reduce urgency to accept stretched terms, limiting intermediaries’ leverage. Deep, long-term relationships with banks and co-investors further temper fee inflation and scarce-supply premiums.

Specialized tech and talent scarcity
High-end engineering, AI and biotech talent remain scarce, with Korn Ferry estimating a global shortfall of 85 million workers by 2030, reinforcing supplier bargaining power. Portfolio companies face wage inflation and longer hiring cycles, pressuring margins and time-to-market. Exor’s active ownership can centralize talent networks and share capabilities across holdings to mitigate costs, yet competition from Big Tech and pharma sustains supplier clout.

Regulatory and compliance gatekeepers
Licensing bodies, safety agencies and data regulators act as non-price suppliers of approvals, imposing procedural costs and delays that increase supplier power; EU regulatory shifts in 2024 (CSRD rollout and AI Act finalisation) have elevated compliance volatility. Exor’s scale, diversified governance and 2024 consolidated holdings ease cross-jurisdictional standardisation, but sudden EU/US rule changes can rapidly reset compliance burdens and costs.
- Regulatory approvals: non-price bottlenecks
- 2024: CSRD rollout, AI Act finalisation heighten change risk
- Exor strength: scale, governance, diversified portfolio
- Risk: rapid EU/US rule changes can spike compliance costs
Critical component concentration risk
Exor's auto and healthcare holdings face concentrated supplier risk—advanced semiconductors (TSMC ~53% foundry share in 2024), EV battery exposure (CATL ~35% global capacity) and API reliance (China ~70% of some APIs) can trigger price spikes, redesigns or dual-sourcing; Exor uses long-term contracts and diversification, but periodic capacity constraints shift bargaining power to suppliers.
- TSMC ~53% foundry share (2024)
- CATL ~35% EV battery share (2024)
- China ~70% share in key APIs
Diversification hides supplier concentration; critical vendors can dictate terms; use long-term deals
Exor’s diversification reduces aggregate supplier leverage, but pockets of concentration (semiconductors, batteries, APIs, talent, regulators) create material local power. Critical suppliers can force prices, delays or redesigns; Exor mitigates via long-term contracts, co-investing and shared capabilities.
| Supplier | 2024 Metric |
|---|---|
| TSMC (foundry) | ~53% share |
| CATL (batteries) | ~35% global capacity |
| APIs (China) | ~70% of some APIs |
| Talent gap | Korn Ferry: 85M shortfall by 2030 |
What is included in the product
 Detailed Word Document
Tailored Porter's Five Forces analysis for EXOR that uncovers key drivers of competition, buyer and supplier power, entry barriers and substitutes, identifies disruptive threats and strategic levers, and offers actionable insights for investors and management.

 Customizable Excel Spreadsheet
A concise, one-sheet EXOR Porter's Five Forces that visualizes and customizes competitive pressure via a ready-to-use radar chart—no macros, easy to edit, and copy-paste friendly for decks and dashboards.
Customers Bargaining Power

Public shareholders and valuation discipline
As a listed company (EXO.MI) Exor faces continuous pricing by public investors who impose valuation discipline; in 2024 Exor traded at an estimated 30–40% discount to reported NAV, signalling investor power. Shareholders exert pressure via required returns, discount compression and governance demands; Exor used transparent capital allocation and a c.€500m buyback program in 2024 to mitigate this. Persistent underperformance would intensify investor activism and governance scrutiny.
Portfolio companies as capital consumers
Operating subsidiaries buy capital and strategic support from Exor but their access to alternative funding — banks, public markets and a private equity sector holding roughly $2.4 trillion of dry powder in 2024 — moderates Exor’s pricing power. Exor’s operational value‑add and patient capital horizon lower switching incentives by providing long‑term stability and strategic alignment. Still, liquid and competitive capital markets preserve credible bargaining options for subsidiaries.

End-customers in cyclical markets
Auto and luxury demand is highly price-sensitive and cyclical; global light-vehicle sales dipped about 3–5% in 2023–24, boosting buyer leverage in downturns as consumers delay purchases or trade down, pressuring margins.
Luxury brand strength (premium pricing and loyalty) cushions margin erosion—luxury autos keep higher ASPs—while healthcare payers, with US healthcare spending above 4.5 trillion dollars range, exert structured bargaining that shapes EXOR-linked healthcare revenues.

Institutional co-investors’ terms
When partnering, institutional co-investors in 2024 negotiated governance, fees and exit rights aggressively, with fee discounts commonly of 50–100 basis points and co-investor allocations often 10–30% per deal, raising their bargaining leverage in frothy cycles. Exor’s long-term alignment and brand reduce friction and can secure more favorable governance and exit terms. Diversifying co-investors avoids overreliance on any single buyer of exposure.
- 2024 fee cuts: 50–100bp
- Typical allocation: 10–30% per deal
- Exor strength: reputation + alignment
Exit market counterparties
Strategic buyers and public markets largely set exit valuations; their risk appetite and cost of capital (10-yr US Treasury ~4.2% in 2024) create effective buyer power over realized returns. Staged exits and timing flexibility reduce this dependence; EXOR traded at roughly a 20% holding-company discount in 2024, reflecting market repricing risk. Weak market windows can delay or materially reprice divestments, extending holding periods and lowering realized IRR.
- Buyer power driven by public multiples and strategic acquirers
- Cost of capital (eg 10y ~4.2% in 2024) compresses achievable prices
- Staged exits and timing flexibility mitigate but do not eliminate repricing risk
Holding at 30-40% NAV discount; €500m buyback, auto -3-5%, 4.2% yields
Exor faces strong investor pricing power, trading at a c.30–40% NAV discount in 2024. Subsidiaries have alternative capital (PE dry powder ~$2.4T, banks, markets) which limits Exor’s pricing power; Exor used a c.€500m buyback in 2024. Auto demand fell ~3–5% in 2023–24, raising buyer leverage; US healthcare spend exceeded $4.5T. 10y US Treasury ~4.2% in 2024, pressuring exit multiples.
| Metric | 2024 figure |
|---|---|
| NAV discount | 30–40% |
| Buyback | c.€500m |
| PE dry powder | $2.4T |
| Auto sales change | -3–5% |
| US healthcare spend | >$4.5T |
| 10y US Treasury | ~4.2% |
Preview the Actual Deliverable
EXOR Porter's Five Forces Analysis
This preview shows the exact EXOR Porter's Five Forces Analysis you'll receive after purchase—no samples or placeholders. The file is fully formatted, professionally written, and ready for immediate download and use. What you see here is precisely the deliverable you’ll get instantly after payment.

Don't Miss the Bigger Picture
EXOR's diversified portfolio and significant stakes in premium asset classes temper supplier and buyer power, but exposure to cyclical sectors and regulatory scrutiny elevates competitive tension; substitutes and new entrants remain moderate risks. Strategic positioning and ownership advantages create resilience, yet force-by-force nuances matter for valuation and risk. This brief snapshot only scratches the surface—unlock the full Porter's Five Forces Analysis to explore EXOR’s competitive dynamics, market pressures, and strategic advantages in detail.
Suppliers Bargaining Power
Diverse input base across sectors
Exor’s diversified 2024 portfolio across automotive, luxury, healthcare and financial services dilutes reliance on any single supplier group. Key inputs range from semiconductors and batteries to clinical services and data, creating varied procurement dynamics. This heterogeneity lowers systemic supplier leverage at the holding level, though local bottlenecks can still transmit material risk to individual portfolio companies.
Capital and deal-flow intermediaries
Investment banks, co-investors and private equity funds supply deal flow and financing, and in hot markets their fees and underwriting terms tighten, raising Exor’s transaction costs. Exor’s patient capital model and strong brand reduce urgency to accept stretched terms, limiting intermediaries’ leverage. Deep, long-term relationships with banks and co-investors further temper fee inflation and scarce-supply premiums.
Specialized tech and talent scarcity
High-end engineering, AI and biotech talent remain scarce, with Korn Ferry estimating a global shortfall of 85 million workers by 2030, reinforcing supplier bargaining power. Portfolio companies face wage inflation and longer hiring cycles, pressuring margins and time-to-market. Exor’s active ownership can centralize talent networks and share capabilities across holdings to mitigate costs, yet competition from Big Tech and pharma sustains supplier clout.
Regulatory and compliance gatekeepers
Licensing bodies, safety agencies and data regulators act as non-price suppliers of approvals, imposing procedural costs and delays that increase supplier power; EU regulatory shifts in 2024 (CSRD rollout and AI Act finalisation) have elevated compliance volatility. Exor’s scale, diversified governance and 2024 consolidated holdings ease cross-jurisdictional standardisation, but sudden EU/US rule changes can rapidly reset compliance burdens and costs.
- Regulatory approvals: non-price bottlenecks
- 2024: CSRD rollout, AI Act finalisation heighten change risk
- Exor strength: scale, governance, diversified portfolio
- Risk: rapid EU/US rule changes can spike compliance costs
Critical component concentration risk
Exor's auto and healthcare holdings face concentrated supplier risk—advanced semiconductors (TSMC ~53% foundry share in 2024), EV battery exposure (CATL ~35% global capacity) and API reliance (China ~70% of some APIs) can trigger price spikes, redesigns or dual-sourcing; Exor uses long-term contracts and diversification, but periodic capacity constraints shift bargaining power to suppliers.
- TSMC ~53% foundry share (2024)
- CATL ~35% EV battery share (2024)
- China ~70% share in key APIs
Diversification hides supplier concentration; critical vendors can dictate terms; use long-term deals
Exor’s diversification reduces aggregate supplier leverage, but pockets of concentration (semiconductors, batteries, APIs, talent, regulators) create material local power. Critical suppliers can force prices, delays or redesigns; Exor mitigates via long-term contracts, co-investing and shared capabilities.
| Supplier | 2024 Metric |
|---|---|
| TSMC (foundry) | ~53% share |
| CATL (batteries) | ~35% global capacity |
| APIs (China) | ~70% of some APIs |
| Talent gap | Korn Ferry: 85M shortfall by 2030 |
What is included in the product
Detailed Word Document
Tailored Porter's Five Forces analysis for EXOR that uncovers key drivers of competition, buyer and supplier power, entry barriers and substitutes, identifies disruptive threats and strategic levers, and offers actionable insights for investors and management.
Customizable Excel Spreadsheet
A concise, one-sheet EXOR Porter's Five Forces that visualizes and customizes competitive pressure via a ready-to-use radar chart—no macros, easy to edit, and copy-paste friendly for decks and dashboards.
Customers Bargaining Power
Public shareholders and valuation discipline
As a listed company (EXO.MI) Exor faces continuous pricing by public investors who impose valuation discipline; in 2024 Exor traded at an estimated 30–40% discount to reported NAV, signalling investor power. Shareholders exert pressure via required returns, discount compression and governance demands; Exor used transparent capital allocation and a c.€500m buyback program in 2024 to mitigate this. Persistent underperformance would intensify investor activism and governance scrutiny.
Portfolio companies as capital consumers
Operating subsidiaries buy capital and strategic support from Exor but their access to alternative funding — banks, public markets and a private equity sector holding roughly $2.4 trillion of dry powder in 2024 — moderates Exor’s pricing power. Exor’s operational value‑add and patient capital horizon lower switching incentives by providing long‑term stability and strategic alignment. Still, liquid and competitive capital markets preserve credible bargaining options for subsidiaries.
End-customers in cyclical markets
Auto and luxury demand is highly price-sensitive and cyclical; global light-vehicle sales dipped about 3–5% in 2023–24, boosting buyer leverage in downturns as consumers delay purchases or trade down, pressuring margins.
Luxury brand strength (premium pricing and loyalty) cushions margin erosion—luxury autos keep higher ASPs—while healthcare payers, with US healthcare spending above 4.5 trillion dollars range, exert structured bargaining that shapes EXOR-linked healthcare revenues.
Institutional co-investors’ terms
When partnering, institutional co-investors in 2024 negotiated governance, fees and exit rights aggressively, with fee discounts commonly of 50–100 basis points and co-investor allocations often 10–30% per deal, raising their bargaining leverage in frothy cycles. Exor’s long-term alignment and brand reduce friction and can secure more favorable governance and exit terms. Diversifying co-investors avoids overreliance on any single buyer of exposure.
- 2024 fee cuts: 50–100bp
- Typical allocation: 10–30% per deal
- Exor strength: reputation + alignment
Exit market counterparties
Strategic buyers and public markets largely set exit valuations; their risk appetite and cost of capital (10-yr US Treasury ~4.2% in 2024) create effective buyer power over realized returns. Staged exits and timing flexibility reduce this dependence; EXOR traded at roughly a 20% holding-company discount in 2024, reflecting market repricing risk. Weak market windows can delay or materially reprice divestments, extending holding periods and lowering realized IRR.
- Buyer power driven by public multiples and strategic acquirers
- Cost of capital (eg 10y ~4.2% in 2024) compresses achievable prices
- Staged exits and timing flexibility mitigate but do not eliminate repricing risk
Holding at 30-40% NAV discount; €500m buyback, auto -3-5%, 4.2% yields
Exor faces strong investor pricing power, trading at a c.30–40% NAV discount in 2024. Subsidiaries have alternative capital (PE dry powder ~$2.4T, banks, markets) which limits Exor’s pricing power; Exor used a c.€500m buyback in 2024. Auto demand fell ~3–5% in 2023–24, raising buyer leverage; US healthcare spend exceeded $4.5T. 10y US Treasury ~4.2% in 2024, pressuring exit multiples.
| Metric | 2024 figure |
|---|---|
| NAV discount | 30–40% |
| Buyback | c.€500m |
| PE dry powder | $2.4T |
| Auto sales change | -3–5% |
| US healthcare spend | >$4.5T |
| 10y US Treasury | ~4.2% |
Preview the Actual Deliverable
EXOR Porter's Five Forces Analysis
This preview shows the exact EXOR Porter's Five Forces Analysis you'll receive after purchase—no samples or placeholders. The file is fully formatted, professionally written, and ready for immediate download and use. What you see here is precisely the deliverable you’ll get instantly after payment.
Original: $10.00
-65%$10.00
$3.50Description
Don't Miss the Bigger Picture
EXOR's diversified portfolio and significant stakes in premium asset classes temper supplier and buyer power, but exposure to cyclical sectors and regulatory scrutiny elevates competitive tension; substitutes and new entrants remain moderate risks. Strategic positioning and ownership advantages create resilience, yet force-by-force nuances matter for valuation and risk. This brief snapshot only scratches the surface—unlock the full Porter's Five Forces Analysis to explore EXOR’s competitive dynamics, market pressures, and strategic advantages in detail.
Suppliers Bargaining Power
Diverse input base across sectors
Exor’s diversified 2024 portfolio across automotive, luxury, healthcare and financial services dilutes reliance on any single supplier group. Key inputs range from semiconductors and batteries to clinical services and data, creating varied procurement dynamics. This heterogeneity lowers systemic supplier leverage at the holding level, though local bottlenecks can still transmit material risk to individual portfolio companies.
Capital and deal-flow intermediaries
Investment banks, co-investors and private equity funds supply deal flow and financing, and in hot markets their fees and underwriting terms tighten, raising Exor’s transaction costs. Exor’s patient capital model and strong brand reduce urgency to accept stretched terms, limiting intermediaries’ leverage. Deep, long-term relationships with banks and co-investors further temper fee inflation and scarce-supply premiums.
Specialized tech and talent scarcity
High-end engineering, AI and biotech talent remain scarce, with Korn Ferry estimating a global shortfall of 85 million workers by 2030, reinforcing supplier bargaining power. Portfolio companies face wage inflation and longer hiring cycles, pressuring margins and time-to-market. Exor’s active ownership can centralize talent networks and share capabilities across holdings to mitigate costs, yet competition from Big Tech and pharma sustains supplier clout.
Regulatory and compliance gatekeepers
Licensing bodies, safety agencies and data regulators act as non-price suppliers of approvals, imposing procedural costs and delays that increase supplier power; EU regulatory shifts in 2024 (CSRD rollout and AI Act finalisation) have elevated compliance volatility. Exor’s scale, diversified governance and 2024 consolidated holdings ease cross-jurisdictional standardisation, but sudden EU/US rule changes can rapidly reset compliance burdens and costs.
- Regulatory approvals: non-price bottlenecks
- 2024: CSRD rollout, AI Act finalisation heighten change risk
- Exor strength: scale, governance, diversified portfolio
- Risk: rapid EU/US rule changes can spike compliance costs
Critical component concentration risk
Exor's auto and healthcare holdings face concentrated supplier risk—advanced semiconductors (TSMC ~53% foundry share in 2024), EV battery exposure (CATL ~35% global capacity) and API reliance (China ~70% of some APIs) can trigger price spikes, redesigns or dual-sourcing; Exor uses long-term contracts and diversification, but periodic capacity constraints shift bargaining power to suppliers.
- TSMC ~53% foundry share (2024)
- CATL ~35% EV battery share (2024)
- China ~70% share in key APIs
Diversification hides supplier concentration; critical vendors can dictate terms; use long-term deals
Exor’s diversification reduces aggregate supplier leverage, but pockets of concentration (semiconductors, batteries, APIs, talent, regulators) create material local power. Critical suppliers can force prices, delays or redesigns; Exor mitigates via long-term contracts, co-investing and shared capabilities.
| Supplier | 2024 Metric |
|---|---|
| TSMC (foundry) | ~53% share |
| CATL (batteries) | ~35% global capacity |
| APIs (China) | ~70% of some APIs |
| Talent gap | Korn Ferry: 85M shortfall by 2030 |
What is included in the product
Detailed Word Document
Tailored Porter's Five Forces analysis for EXOR that uncovers key drivers of competition, buyer and supplier power, entry barriers and substitutes, identifies disruptive threats and strategic levers, and offers actionable insights for investors and management.
Customizable Excel Spreadsheet
A concise, one-sheet EXOR Porter's Five Forces that visualizes and customizes competitive pressure via a ready-to-use radar chart—no macros, easy to edit, and copy-paste friendly for decks and dashboards.
Customers Bargaining Power
Public shareholders and valuation discipline
As a listed company (EXO.MI) Exor faces continuous pricing by public investors who impose valuation discipline; in 2024 Exor traded at an estimated 30–40% discount to reported NAV, signalling investor power. Shareholders exert pressure via required returns, discount compression and governance demands; Exor used transparent capital allocation and a c.€500m buyback program in 2024 to mitigate this. Persistent underperformance would intensify investor activism and governance scrutiny.
Portfolio companies as capital consumers
Operating subsidiaries buy capital and strategic support from Exor but their access to alternative funding — banks, public markets and a private equity sector holding roughly $2.4 trillion of dry powder in 2024 — moderates Exor’s pricing power. Exor’s operational value‑add and patient capital horizon lower switching incentives by providing long‑term stability and strategic alignment. Still, liquid and competitive capital markets preserve credible bargaining options for subsidiaries.
End-customers in cyclical markets
Auto and luxury demand is highly price-sensitive and cyclical; global light-vehicle sales dipped about 3–5% in 2023–24, boosting buyer leverage in downturns as consumers delay purchases or trade down, pressuring margins.
Luxury brand strength (premium pricing and loyalty) cushions margin erosion—luxury autos keep higher ASPs—while healthcare payers, with US healthcare spending above 4.5 trillion dollars range, exert structured bargaining that shapes EXOR-linked healthcare revenues.
Institutional co-investors’ terms
When partnering, institutional co-investors in 2024 negotiated governance, fees and exit rights aggressively, with fee discounts commonly of 50–100 basis points and co-investor allocations often 10–30% per deal, raising their bargaining leverage in frothy cycles. Exor’s long-term alignment and brand reduce friction and can secure more favorable governance and exit terms. Diversifying co-investors avoids overreliance on any single buyer of exposure.
- 2024 fee cuts: 50–100bp
- Typical allocation: 10–30% per deal
- Exor strength: reputation + alignment
Exit market counterparties
Strategic buyers and public markets largely set exit valuations; their risk appetite and cost of capital (10-yr US Treasury ~4.2% in 2024) create effective buyer power over realized returns. Staged exits and timing flexibility reduce this dependence; EXOR traded at roughly a 20% holding-company discount in 2024, reflecting market repricing risk. Weak market windows can delay or materially reprice divestments, extending holding periods and lowering realized IRR.
- Buyer power driven by public multiples and strategic acquirers
- Cost of capital (eg 10y ~4.2% in 2024) compresses achievable prices
- Staged exits and timing flexibility mitigate but do not eliminate repricing risk
Holding at 30-40% NAV discount; €500m buyback, auto -3-5%, 4.2% yields
Exor faces strong investor pricing power, trading at a c.30–40% NAV discount in 2024. Subsidiaries have alternative capital (PE dry powder ~$2.4T, banks, markets) which limits Exor’s pricing power; Exor used a c.€500m buyback in 2024. Auto demand fell ~3–5% in 2023–24, raising buyer leverage; US healthcare spend exceeded $4.5T. 10y US Treasury ~4.2% in 2024, pressuring exit multiples.
| Metric | 2024 figure |
|---|---|
| NAV discount | 30–40% |
| Buyback | c.€500m |
| PE dry powder | $2.4T |
| Auto sales change | -3–5% |
| US healthcare spend | >$4.5T |
| 10y US Treasury | ~4.2% |
Preview the Actual Deliverable
EXOR Porter's Five Forces Analysis
This preview shows the exact EXOR Porter's Five Forces Analysis you'll receive after purchase—no samples or placeholders. The file is fully formatted, professionally written, and ready for immediate download and use. What you see here is precisely the deliverable you’ll get instantly after payment.











