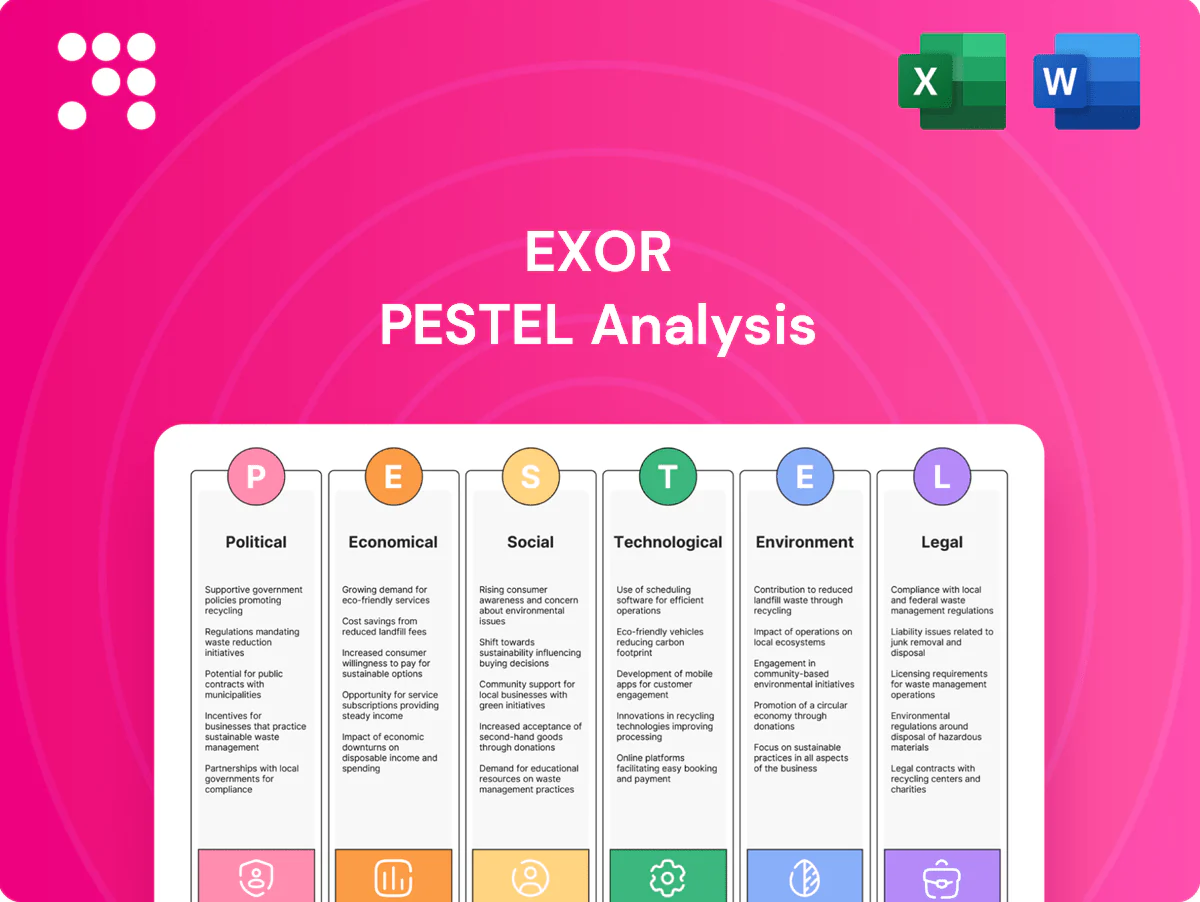
EXOR PESTLE Analysis

Make Smarter Strategic Decisions with a Complete PESTEL View
Gain a strategic edge with our PESTLE analysis of EXOR, revealing how macro forces shape its portfolio and long‑term outlook. We unpack political risks, regulatory shifts, economic cycles, social trends, technological disruption, and environmental pressures. This concise briefing highlights actionable risks and growth levers for investors and strategists. Purchase the full, editable report to access detailed evidence, forecasts, and strategic recommendations.
Political factors

EU industrial policy shifts
EU shifts in industrial strategy—notably the Chips Act aiming to mobilise up to €43 billion and the NextGenerationEU recovery fund of €806.9 billion—reshape capital flows affecting EXOR’s autos, healthcare and finance exposures.
Targeted subsidies for semiconductors, batteries and green tech can redirect investment priorities and require EXOR to realign portfolio roadmaps with EU strategic priorities.
Proactive engagement with Brussels and member states reduces policy risk and helps secure favourable allocations and regulatory clarity for EXOR assets.
Geopolitics and sanctions
US‑China tensions and sanctions regimes reshape supply chains and luxury demand: Chinese consumers accounted for roughly 35% of global personal luxury goods sales in 2023 (Bain), making policies there material to revenues.
Automotive and healthcare components face export controls and licensing hurdles after tightened US measures from 2022–24, raising compliance costs and lead‑time risk for suppliers.
Portfolio firms need de‑risking and friend‑shoring strategies; Exor’s cross‑border governance must anticipate rapid policy shifts and accelerate scenario planning.

Trade tariffs on autos
Tariff actions on EVs and traditional autos change pricing and margins, amplified by the IRA's $369 billion clean-energy package that conditions incentives on origin and assembly. US and EU anti-dumping probes launched in 2023 into Chinese EVs highlight risks that can redirect production footprints and supply chains. Exor-backed automakers (Stellantis, Ferrari) must optimize tariff-efficient manufacturing and product mix and run scenarios for tariff escalation and retaliation.

FDI screening regimes
Expanded EU FDI Screening Regulation (entered Oct 2020) and US FIRRMA reforms (2018) broaden scrutiny over tech, health and data assets; national security tests can force mitigation agreements that delay value realization by months. Pre-filing strategies and clean-team structures are proven to reduce friction; Exor must proactively structure deals to meet member-state and CFIUS concerns.
- Regulatory milestones: EU Oct 2020, US FIRRMA 2018
- Focus: tech, health, data
- Risk: mitigation agreements delay deals
- Mitigation: pre-filing + clean teams
Fiscal incentives and subsidies
Green transition and health-innovation incentives (US Inflation Reduction Act $369bn; EU Recovery and Resilience Facility €723.8bn) can lift project IRRs materially; competing national schemes force agile capital allocation while portfolio CFOs must maximize grants, tax credits and procurement access and monitor sunset clauses to avoid subsidy cliffs.
- Target IRA and RRF funds
- Prioritize tax credits and procurement
- Track sunset dates to prevent cliffs
EU and US funds reshape chips, green tech; China drove ~35% of luxury sales in 2023
EU strategic funds (Chips Act €43bn; NextGenerationEU €806.9bn) and US IRA $369bn reallocate capital toward semiconductors, batteries and green tech, forcing EXOR to realign portfolio priorities. Chinese consumers drove ~35% of global luxury sales in 2023 (Bain), making China policy and sanctions material to revenues. Expanded FDI/CFIUS scrutiny raises deal friction; pre‑filing reduces delay risk.
| Policy | Size | Immediate Impact |
|---|---|---|
| Chips Act | €43bn | Capex shift to semiconductors |
| NextGenerationEU | €806.9bn | Reallocation to green/health |
| IRA | $369bn | Incentives tied to US sourcing |
What is included in the product
 Detailed Word Document
Explores how macro-environmental forces uniquely affect EXOR across Political, Economic, Social, Technological, Environmental, and Legal dimensions, with data-driven subpoints and examples tailored to its portfolio exposures. Designed to support executives, investors, and strategists with forward-looking insights for scenario planning and risk mitigation.

 Customizable Excel Spreadsheet
A concise, visually segmented PESTLE of EXOR that condenses external risks and opportunities into a ready-to-use summary for meetings or presentations, easily shared and annotated to support cross-team alignment and strategic planning.
Economic factors

Rate cycle and liquidity
ECB deposit rate at 4.00% (June 2025) and 10‑yr Bund/US 10‑yr around 2.6%/4.3% tighten Exor’s WACC and push deal cadence; lower rates historically lift autos and luxury equity multiples, higher rates compress them. Exor reported net financial debt of about €4.5bn at end‑2024, so leverage and buyback capacity remain sensitive to credit spreads and bank funding. Staggered maturities and interest hedges preserve refinancing flexibility.
FX exposure EUR/USD/CNY
EUR/USD swings (EUR averaged ~1.09 vs USD in 2024) and USD/CNY (~7.20 in 2024) create revenue/cost mismatches that can materially alter EXOR's consolidated value through translation and demand effects; China drove roughly 36% of global personal luxury goods consumption in 2023, while China accounts for about 40% of global auto volumes, amplifying USD/CNY impact on Ferrari and Stellantis. Natural hedging and derivatives are used to stabilize cash flows, and capital allocation should be assessed on FX-adjusted returns to preserve economic value.

Cyclical auto demand
Autos are sensitive to employment, credit availability and fuel costs, and Stellantis, Exor’s largest holding, exposes Exor to these cycles.
Model mix and pricing power—premium vs mass-market—drive resilience in downturns, favoring higher-margin segments.
Inventory discipline and tighter incentives protect margins; Exor should hedge cyclical Stellantis exposure with countercyclical assets in its diversified portfolio.

Luxury consumption trends
- MarketSize: €390bn(2024)
- ChinaShare: ~35%
- TravelRetail: ~90% of 2019(2024)
- Pricing: scarcity/brand elevation
- RiskMitigation: channel/geography diversification
Inflation and input costs
Inflation and commodity volatility squeezed margins for Exor-owned industrials in 2024 as Brent averaged about $85/bl and global freight rates remained elevated, pressuring input costs; contract indexation and design-to-cost engineering have been used to offset spikes. Healthcare and services assets typically pass through increases faster than automotive segments, where price elasticity limited immediate recovery. Centralized procurement across Exor portfolio targeted double-digit savings through scale in 2024.
- Commodity pressure: Brent ~85 USD/bl (2024)
- Inflation backdrop: Eurozone ~2.4% (2024)
- Offset tools: contract indexation, design-to-cost
- Pass-through speed: healthcare/services > autos
- Procurement: centralized scale savings (double-digit target)
EU and US funds reshape chips, green tech; China drove ~35% of luxury sales in 2023
ECB deposit rate 4.00% (Jun 2025) and 10yr Bund/US10yr ~2.6%/4.3% tighten EXOR’s WACC, affecting buybacks and M&A. Net financial debt ~€4.5bn (end‑2024) keeps leverage sensitive to spreads; staggered maturities and hedges aid flexibility. FX (EUR/USD ~1.09 in 2024, USD/CNY ~7.20) and China exposure (~35% luxury) materially drive consolidated value.
| Metric | Value |
|---|---|
| ECB deposit | 4.00% (Jun 2025) |
| 10yr Bund/US | 2.6% / 4.3% |
| Net debt | €4.5bn (end‑2024) |
| Luxury market | €390bn (2024); China ~35% |
| EUR/USD | ~1.09 (2024) |
What You See Is What You Get
EXOR PESTLE Analysis
The EXOR PESTLE Analysis preview shown here is the exact document you’ll receive after purchase—fully formatted, professionally structured, and ready to use. This is a real representation of the final file with complete content and no placeholders or teasers. After payment you’ll download the identical, finished report shown in the preview.

Make Smarter Strategic Decisions with a Complete PESTEL View
Gain a strategic edge with our PESTLE analysis of EXOR, revealing how macro forces shape its portfolio and long‑term outlook. We unpack political risks, regulatory shifts, economic cycles, social trends, technological disruption, and environmental pressures. This concise briefing highlights actionable risks and growth levers for investors and strategists. Purchase the full, editable report to access detailed evidence, forecasts, and strategic recommendations.
Political factors
EU industrial policy shifts
EU shifts in industrial strategy—notably the Chips Act aiming to mobilise up to €43 billion and the NextGenerationEU recovery fund of €806.9 billion—reshape capital flows affecting EXOR’s autos, healthcare and finance exposures.
Targeted subsidies for semiconductors, batteries and green tech can redirect investment priorities and require EXOR to realign portfolio roadmaps with EU strategic priorities.
Proactive engagement with Brussels and member states reduces policy risk and helps secure favourable allocations and regulatory clarity for EXOR assets.
Geopolitics and sanctions
US‑China tensions and sanctions regimes reshape supply chains and luxury demand: Chinese consumers accounted for roughly 35% of global personal luxury goods sales in 2023 (Bain), making policies there material to revenues.
Automotive and healthcare components face export controls and licensing hurdles after tightened US measures from 2022–24, raising compliance costs and lead‑time risk for suppliers.
Portfolio firms need de‑risking and friend‑shoring strategies; Exor’s cross‑border governance must anticipate rapid policy shifts and accelerate scenario planning.
Trade tariffs on autos
Tariff actions on EVs and traditional autos change pricing and margins, amplified by the IRA's $369 billion clean-energy package that conditions incentives on origin and assembly. US and EU anti-dumping probes launched in 2023 into Chinese EVs highlight risks that can redirect production footprints and supply chains. Exor-backed automakers (Stellantis, Ferrari) must optimize tariff-efficient manufacturing and product mix and run scenarios for tariff escalation and retaliation.
FDI screening regimes
Expanded EU FDI Screening Regulation (entered Oct 2020) and US FIRRMA reforms (2018) broaden scrutiny over tech, health and data assets; national security tests can force mitigation agreements that delay value realization by months. Pre-filing strategies and clean-team structures are proven to reduce friction; Exor must proactively structure deals to meet member-state and CFIUS concerns.
- Regulatory milestones: EU Oct 2020, US FIRRMA 2018
- Focus: tech, health, data
- Risk: mitigation agreements delay deals
- Mitigation: pre-filing + clean teams
Fiscal incentives and subsidies
Green transition and health-innovation incentives (US Inflation Reduction Act $369bn; EU Recovery and Resilience Facility €723.8bn) can lift project IRRs materially; competing national schemes force agile capital allocation while portfolio CFOs must maximize grants, tax credits and procurement access and monitor sunset clauses to avoid subsidy cliffs.
- Target IRA and RRF funds
- Prioritize tax credits and procurement
- Track sunset dates to prevent cliffs
EU and US funds reshape chips, green tech; China drove ~35% of luxury sales in 2023
EU strategic funds (Chips Act €43bn; NextGenerationEU €806.9bn) and US IRA $369bn reallocate capital toward semiconductors, batteries and green tech, forcing EXOR to realign portfolio priorities. Chinese consumers drove ~35% of global luxury sales in 2023 (Bain), making China policy and sanctions material to revenues. Expanded FDI/CFIUS scrutiny raises deal friction; pre‑filing reduces delay risk.
| Policy | Size | Immediate Impact |
|---|---|---|
| Chips Act | €43bn | Capex shift to semiconductors |
| NextGenerationEU | €806.9bn | Reallocation to green/health |
| IRA | $369bn | Incentives tied to US sourcing |
What is included in the product
Detailed Word Document
Explores how macro-environmental forces uniquely affect EXOR across Political, Economic, Social, Technological, Environmental, and Legal dimensions, with data-driven subpoints and examples tailored to its portfolio exposures. Designed to support executives, investors, and strategists with forward-looking insights for scenario planning and risk mitigation.
Customizable Excel Spreadsheet
A concise, visually segmented PESTLE of EXOR that condenses external risks and opportunities into a ready-to-use summary for meetings or presentations, easily shared and annotated to support cross-team alignment and strategic planning.
Economic factors
Rate cycle and liquidity
ECB deposit rate at 4.00% (June 2025) and 10‑yr Bund/US 10‑yr around 2.6%/4.3% tighten Exor’s WACC and push deal cadence; lower rates historically lift autos and luxury equity multiples, higher rates compress them. Exor reported net financial debt of about €4.5bn at end‑2024, so leverage and buyback capacity remain sensitive to credit spreads and bank funding. Staggered maturities and interest hedges preserve refinancing flexibility.
FX exposure EUR/USD/CNY
EUR/USD swings (EUR averaged ~1.09 vs USD in 2024) and USD/CNY (~7.20 in 2024) create revenue/cost mismatches that can materially alter EXOR's consolidated value through translation and demand effects; China drove roughly 36% of global personal luxury goods consumption in 2023, while China accounts for about 40% of global auto volumes, amplifying USD/CNY impact on Ferrari and Stellantis. Natural hedging and derivatives are used to stabilize cash flows, and capital allocation should be assessed on FX-adjusted returns to preserve economic value.
Cyclical auto demand
Autos are sensitive to employment, credit availability and fuel costs, and Stellantis, Exor’s largest holding, exposes Exor to these cycles.
Model mix and pricing power—premium vs mass-market—drive resilience in downturns, favoring higher-margin segments.
Inventory discipline and tighter incentives protect margins; Exor should hedge cyclical Stellantis exposure with countercyclical assets in its diversified portfolio.
Luxury consumption trends
- MarketSize: €390bn(2024)
- ChinaShare: ~35%
- TravelRetail: ~90% of 2019(2024)
- Pricing: scarcity/brand elevation
- RiskMitigation: channel/geography diversification
Inflation and input costs
Inflation and commodity volatility squeezed margins for Exor-owned industrials in 2024 as Brent averaged about $85/bl and global freight rates remained elevated, pressuring input costs; contract indexation and design-to-cost engineering have been used to offset spikes. Healthcare and services assets typically pass through increases faster than automotive segments, where price elasticity limited immediate recovery. Centralized procurement across Exor portfolio targeted double-digit savings through scale in 2024.
- Commodity pressure: Brent ~85 USD/bl (2024)
- Inflation backdrop: Eurozone ~2.4% (2024)
- Offset tools: contract indexation, design-to-cost
- Pass-through speed: healthcare/services > autos
- Procurement: centralized scale savings (double-digit target)
EU and US funds reshape chips, green tech; China drove ~35% of luxury sales in 2023
ECB deposit rate 4.00% (Jun 2025) and 10yr Bund/US10yr ~2.6%/4.3% tighten EXOR’s WACC, affecting buybacks and M&A. Net financial debt ~€4.5bn (end‑2024) keeps leverage sensitive to spreads; staggered maturities and hedges aid flexibility. FX (EUR/USD ~1.09 in 2024, USD/CNY ~7.20) and China exposure (~35% luxury) materially drive consolidated value.
| Metric | Value |
|---|---|
| ECB deposit | 4.00% (Jun 2025) |
| 10yr Bund/US | 2.6% / 4.3% |
| Net debt | €4.5bn (end‑2024) |
| Luxury market | €390bn (2024); China ~35% |
| EUR/USD | ~1.09 (2024) |
What You See Is What You Get
EXOR PESTLE Analysis
The EXOR PESTLE Analysis preview shown here is the exact document you’ll receive after purchase—fully formatted, professionally structured, and ready to use. This is a real representation of the final file with complete content and no placeholders or teasers. After payment you’ll download the identical, finished report shown in the preview.
Original: $10.00
-65%$10.00
$3.50Description
Make Smarter Strategic Decisions with a Complete PESTEL View
Gain a strategic edge with our PESTLE analysis of EXOR, revealing how macro forces shape its portfolio and long‑term outlook. We unpack political risks, regulatory shifts, economic cycles, social trends, technological disruption, and environmental pressures. This concise briefing highlights actionable risks and growth levers for investors and strategists. Purchase the full, editable report to access detailed evidence, forecasts, and strategic recommendations.
Political factors
EU industrial policy shifts
EU shifts in industrial strategy—notably the Chips Act aiming to mobilise up to €43 billion and the NextGenerationEU recovery fund of €806.9 billion—reshape capital flows affecting EXOR’s autos, healthcare and finance exposures.
Targeted subsidies for semiconductors, batteries and green tech can redirect investment priorities and require EXOR to realign portfolio roadmaps with EU strategic priorities.
Proactive engagement with Brussels and member states reduces policy risk and helps secure favourable allocations and regulatory clarity for EXOR assets.
Geopolitics and sanctions
US‑China tensions and sanctions regimes reshape supply chains and luxury demand: Chinese consumers accounted for roughly 35% of global personal luxury goods sales in 2023 (Bain), making policies there material to revenues.
Automotive and healthcare components face export controls and licensing hurdles after tightened US measures from 2022–24, raising compliance costs and lead‑time risk for suppliers.
Portfolio firms need de‑risking and friend‑shoring strategies; Exor’s cross‑border governance must anticipate rapid policy shifts and accelerate scenario planning.
Trade tariffs on autos
Tariff actions on EVs and traditional autos change pricing and margins, amplified by the IRA's $369 billion clean-energy package that conditions incentives on origin and assembly. US and EU anti-dumping probes launched in 2023 into Chinese EVs highlight risks that can redirect production footprints and supply chains. Exor-backed automakers (Stellantis, Ferrari) must optimize tariff-efficient manufacturing and product mix and run scenarios for tariff escalation and retaliation.
FDI screening regimes
Expanded EU FDI Screening Regulation (entered Oct 2020) and US FIRRMA reforms (2018) broaden scrutiny over tech, health and data assets; national security tests can force mitigation agreements that delay value realization by months. Pre-filing strategies and clean-team structures are proven to reduce friction; Exor must proactively structure deals to meet member-state and CFIUS concerns.
- Regulatory milestones: EU Oct 2020, US FIRRMA 2018
- Focus: tech, health, data
- Risk: mitigation agreements delay deals
- Mitigation: pre-filing + clean teams
Fiscal incentives and subsidies
Green transition and health-innovation incentives (US Inflation Reduction Act $369bn; EU Recovery and Resilience Facility €723.8bn) can lift project IRRs materially; competing national schemes force agile capital allocation while portfolio CFOs must maximize grants, tax credits and procurement access and monitor sunset clauses to avoid subsidy cliffs.
- Target IRA and RRF funds
- Prioritize tax credits and procurement
- Track sunset dates to prevent cliffs
EU and US funds reshape chips, green tech; China drove ~35% of luxury sales in 2023
EU strategic funds (Chips Act €43bn; NextGenerationEU €806.9bn) and US IRA $369bn reallocate capital toward semiconductors, batteries and green tech, forcing EXOR to realign portfolio priorities. Chinese consumers drove ~35% of global luxury sales in 2023 (Bain), making China policy and sanctions material to revenues. Expanded FDI/CFIUS scrutiny raises deal friction; pre‑filing reduces delay risk.
| Policy | Size | Immediate Impact |
|---|---|---|
| Chips Act | €43bn | Capex shift to semiconductors |
| NextGenerationEU | €806.9bn | Reallocation to green/health |
| IRA | $369bn | Incentives tied to US sourcing |
What is included in the product
Detailed Word Document
Explores how macro-environmental forces uniquely affect EXOR across Political, Economic, Social, Technological, Environmental, and Legal dimensions, with data-driven subpoints and examples tailored to its portfolio exposures. Designed to support executives, investors, and strategists with forward-looking insights for scenario planning and risk mitigation.
Customizable Excel Spreadsheet
A concise, visually segmented PESTLE of EXOR that condenses external risks and opportunities into a ready-to-use summary for meetings or presentations, easily shared and annotated to support cross-team alignment and strategic planning.
Economic factors
Rate cycle and liquidity
ECB deposit rate at 4.00% (June 2025) and 10‑yr Bund/US 10‑yr around 2.6%/4.3% tighten Exor’s WACC and push deal cadence; lower rates historically lift autos and luxury equity multiples, higher rates compress them. Exor reported net financial debt of about €4.5bn at end‑2024, so leverage and buyback capacity remain sensitive to credit spreads and bank funding. Staggered maturities and interest hedges preserve refinancing flexibility.
FX exposure EUR/USD/CNY
EUR/USD swings (EUR averaged ~1.09 vs USD in 2024) and USD/CNY (~7.20 in 2024) create revenue/cost mismatches that can materially alter EXOR's consolidated value through translation and demand effects; China drove roughly 36% of global personal luxury goods consumption in 2023, while China accounts for about 40% of global auto volumes, amplifying USD/CNY impact on Ferrari and Stellantis. Natural hedging and derivatives are used to stabilize cash flows, and capital allocation should be assessed on FX-adjusted returns to preserve economic value.
Cyclical auto demand
Autos are sensitive to employment, credit availability and fuel costs, and Stellantis, Exor’s largest holding, exposes Exor to these cycles.
Model mix and pricing power—premium vs mass-market—drive resilience in downturns, favoring higher-margin segments.
Inventory discipline and tighter incentives protect margins; Exor should hedge cyclical Stellantis exposure with countercyclical assets in its diversified portfolio.
Luxury consumption trends
- MarketSize: €390bn(2024)
- ChinaShare: ~35%
- TravelRetail: ~90% of 2019(2024)
- Pricing: scarcity/brand elevation
- RiskMitigation: channel/geography diversification
Inflation and input costs
Inflation and commodity volatility squeezed margins for Exor-owned industrials in 2024 as Brent averaged about $85/bl and global freight rates remained elevated, pressuring input costs; contract indexation and design-to-cost engineering have been used to offset spikes. Healthcare and services assets typically pass through increases faster than automotive segments, where price elasticity limited immediate recovery. Centralized procurement across Exor portfolio targeted double-digit savings through scale in 2024.
- Commodity pressure: Brent ~85 USD/bl (2024)
- Inflation backdrop: Eurozone ~2.4% (2024)
- Offset tools: contract indexation, design-to-cost
- Pass-through speed: healthcare/services > autos
- Procurement: centralized scale savings (double-digit target)
EU and US funds reshape chips, green tech; China drove ~35% of luxury sales in 2023
ECB deposit rate 4.00% (Jun 2025) and 10yr Bund/US10yr ~2.6%/4.3% tighten EXOR’s WACC, affecting buybacks and M&A. Net financial debt ~€4.5bn (end‑2024) keeps leverage sensitive to spreads; staggered maturities and hedges aid flexibility. FX (EUR/USD ~1.09 in 2024, USD/CNY ~7.20) and China exposure (~35% luxury) materially drive consolidated value.
| Metric | Value |
|---|---|
| ECB deposit | 4.00% (Jun 2025) |
| 10yr Bund/US | 2.6% / 4.3% |
| Net debt | €4.5bn (end‑2024) |
| Luxury market | €390bn (2024); China ~35% |
| EUR/USD | ~1.09 (2024) |
What You See Is What You Get
EXOR PESTLE Analysis
The EXOR PESTLE Analysis preview shown here is the exact document you’ll receive after purchase—fully formatted, professionally structured, and ready to use. This is a real representation of the final file with complete content and no placeholders or teasers. After payment you’ll download the identical, finished report shown in the preview.











