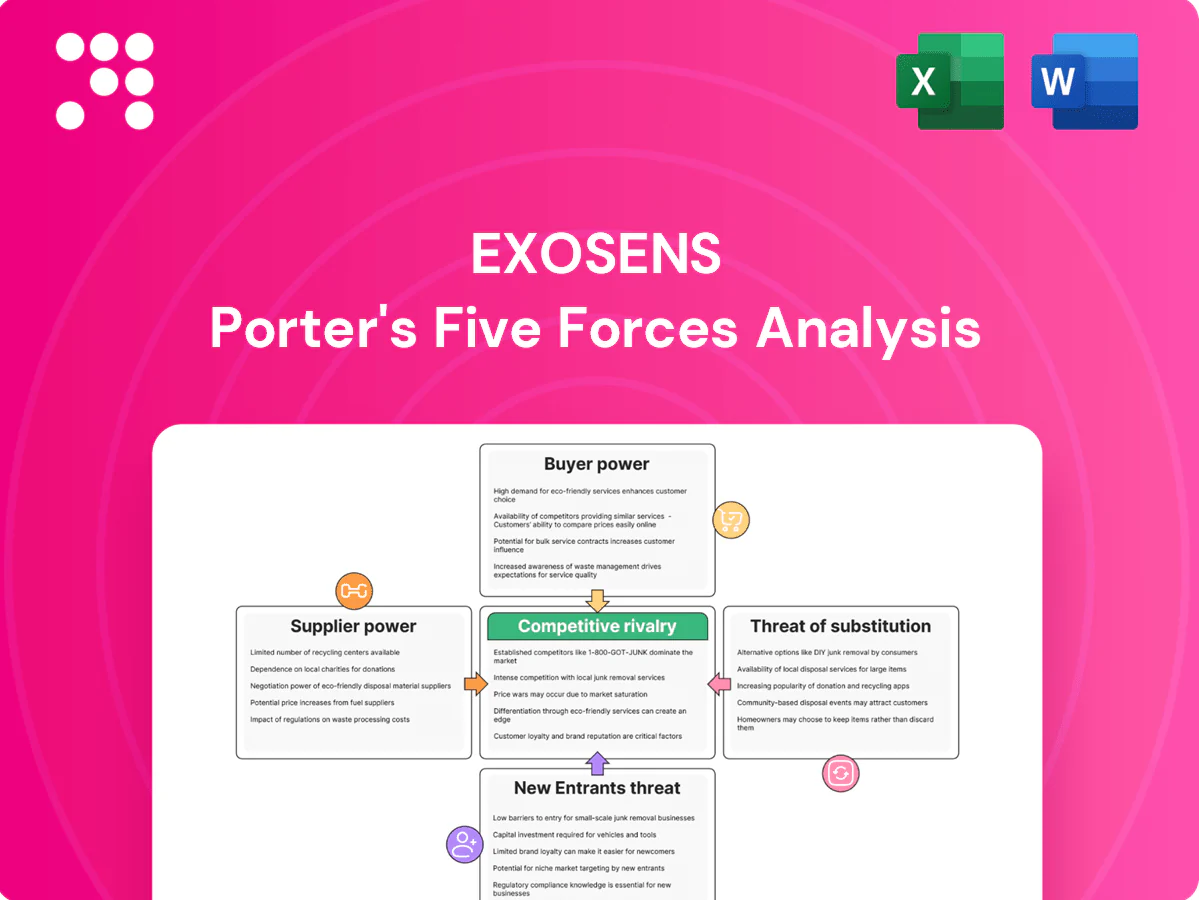
Exosens Porter's Five Forces Analysis

Don't Miss the Bigger Picture
Exosens operates in specialized subsea monitoring with a strong tech moat but faces supplier concentration and regulatory uncertainty. Buyer power is moderate given niche customers and long sales cycles, while substitutes from alternative sensing solutions pose a developing threat. This brief snapshot only scratches the surface. Unlock the full Porter's Five Forces Analysis to explore Exosens’s competitive dynamics, market pressures, and strategic advantages in detail.
Suppliers Bargaining Power

Concentrated specialty inputs
Core materials such as microchannel plates, gallium arsenide photocathodes, high‑purity glass and vacuum components come from a highly concentrated supplier base in 2024, with few qualified vendors—often under five—raising switching costs and bottleneck risk. Supply disruptions can delay programs with lead times spanning months to over a year. Exosens must sustain multi‑sourcing and inventory buffers to mitigate these systemic risks.
Qualification and compliance constraints
Defense and medical end-use demands AS9100/ISO13485 and ITAR/EAR compliance, narrowing qualified suppliers to often under 10% of potential vendors and increasing supplier leverage. Requalification commonly takes 6–12 months and costs frequently exceed $100,000 per supplier, raising switching barriers. Long-term contracts and routine audits (annual or biannual) partially rebalance power by locking pricing and ensuring traceability.

Technological specificity
As of 2024, photocathodes, MCPs and ultra-low-noise electronics are highly customized to Exosens designs, creating supplier-specific interfaces that lock in partners across multi-year design-in cycles. Critical IP and process know-how sit upstream with suppliers, reinforcing dependence and raising switching costs. Co-development secures priority access but aligns pricing and roadmaps to supplier strategies, limiting Exosens bargaining power.

Price volatility in rare and strategic materials
Indium, gallium, rare-earth dopants and noble metals expose Exosens to commodity-price swings—supplier concentration remains high (top 3 producers control over 60% of key inputs in 2024), allowing pass-through of surcharges and limiting alternatives. Hedging and multi-year purchase agreements reduce but do not remove exposure; 2024 spot spikes have still forced margin compression on fixed-price contracts. Suppliers' pricing power therefore increases volatility in Exosens' cost structure and short-term profitability.
- Supply concentration: top-3 >60% (2024)
- Hedging limits but cannot fully neutralize spikes
- Fixed-price contracts face margin risk on short-term price shocks
Capital equipment vendors’ leverage
Specialized deposition, vacuum, metrology and lithography tools are concentrated among few OEMs (ASML ~80% of EUV lithography in 2024; Applied, Lam, KLA dominate other tool segments), creating supplier leverage. Spare parts, proprietary service software and repair lock‑ins deepen dependency while low‑defect fabs face downtime costs often cited around $1M+ per hour. SLAs and in‑house maintenance reduce but do not eliminate supplier power.
- Oligopolistic OEMs: ASML/Applied/Lam/KLA
- Lock‑ins: parts, service, software
- Downtime impact: ~$1M+/hour (low‑defect fabs)
- Mitigation: SLAs/in‑house limits but not neutral
Top supplier power: top-3 > 60%, downtime ~$1M+/hr
Supplier power is high: top‑3 control >60% of key inputs (2024), few qualified vendors raise switching costs and requalification often takes 6–12 months at >$100,000. Specialized tool OEMs (ASML/Applied/Lam/KLA) and proprietary spares/services create lock‑ins; fab downtime costs ~$1M+/hour. Hedging and multi‑year contracts reduce but do not remove price/availability exposure.
| Metric | 2024 |
|---|---|
| Top‑3 supplier share | >60% |
| Requalification time/cost | 6–12m / >$100k |
| Downtime cost | ~$1M+/hr |
What is included in the product
 Detailed Word Document
Uncovers key drivers of competition, supplier and buyer power, entry barriers, substitutes and disruptive threats tailored to Exosens’ competitive landscape; includes strategic implications for pricing, profitability and market positioning. Fully editable Word format for easy customization in investor materials, strategy decks or academic projects.

 Customizable Excel Spreadsheet
A one-sheet, interactive Porter's Five Forces summary that visualizes strategic pressure with a spider chart, lets you customize force levels for evolving market data, and exports cleanly to decks—no macros or finance expertise required.
Customers Bargaining Power

Concentrated OEM and government buyers
Defense primes, medical OEMs, and research institutions act as sophisticated buyers controlling programs funded by governments (US defense procurement ~858 billion USD in 2024) or multibillion medical contracts, allowing them to extract tough pricing, customization, qualification, and lifecycle clauses. Their volume lets them demand lengthy qualifications and ongoing support. For niche suppliers, losing one prime account can cut revenue by over 20%.
High switching costs and performance lock-in
Design-ins for imaging chains and detectors typically span 18–36 months and require costly requalification (often >$500k), creating high switching costs. Mission-critical metrics—SNR, MTBF >100,000 hours and radiation hardness ~50–100 krad—lower buyer willingness to change, boosting Exosens pricing power (ASP uplifts ~15–30% once qualified). Early engagement captures majority of lifetime module revenue and value.

Procurement cycles and cost pressure
Long budgeting cycles and public tenders, which commonly run 3–12 months, force competitive pricing and strict compliance, compressing margins. Buyers typically negotiate 5–15% cost reductions over product lifecycles, but niche technical specs and proprietary interfaces limit direct comparability and preserve roughly 10–20% vendor premium. Service quality and proven reliability remain key differentiators beyond price.

Dual-sourcing where feasible
Large buyers commonly mandate dual-sourcing to reduce supply risk, which caps pricing power and can dilute Exosens share when customers split volumes. For highly specialized sonar components genuine alternatives are scarce, preserving pricing leverage for qualified vendors. Exosens benefits when it is one of few certified suppliers, converting scarcity into stronger contract terms and higher renewal rates.
Aftermarket and lifecycle requirements
Aftermarket and lifecycle requirements drive Exosens negotiations: obsolescence management, spares, and long-term support are baseline demands; in 2024 operators increasingly seek 10+ year support windows and transferrable warranties. Buyers use these needs to push tougher warranty and service terms, while strong field support allows Exosens to command premium pricing; weak support markedly raises buyer power.
Niche suppliers win 15–30% ASP premium in 18–36m design-ins
Defense primes, OEMs and research buyers (US defense spend ~858 billion USD in 2024) extract tough pricing, customization and lifecycle clauses; losing one prime can cut niche supplier revenue >20%. Design-ins take 18–36 months with requalification >$500k, driving switching costs and enabling ASP uplifts ~15–30% for qualified vendors. Long tenders (3–12 months) force 5–15% negotiated cuts but niche specs preserve ~10–20% vendor premium. Aftermarket demands 10+ year support, spares and obsolescence plans.
| Metric | Value |
|---|---|
| US defense spend 2024 | ~858B USD |
| Design-in duration | 18–36 months |
| Requalification cost | >500k USD |
| ASP uplift when qualified | 15–30% |
| Buyer-negotiated cuts | 5–15% |
Preview Before You Purchase
Exosens Porter's Five Forces Analysis
This preview shows the exact Exosens Porter's Five Forces Analysis you'll receive—fully formatted, professionally written and ready for immediate download upon purchase. No mockups or placeholders; the document you see here is the final deliverable. Instant access after payment, ready to use in reports, presentations, or strategy work.

Don't Miss the Bigger Picture
Exosens operates in specialized subsea monitoring with a strong tech moat but faces supplier concentration and regulatory uncertainty. Buyer power is moderate given niche customers and long sales cycles, while substitutes from alternative sensing solutions pose a developing threat. This brief snapshot only scratches the surface. Unlock the full Porter's Five Forces Analysis to explore Exosens’s competitive dynamics, market pressures, and strategic advantages in detail.
Suppliers Bargaining Power
Concentrated specialty inputs
Core materials such as microchannel plates, gallium arsenide photocathodes, high‑purity glass and vacuum components come from a highly concentrated supplier base in 2024, with few qualified vendors—often under five—raising switching costs and bottleneck risk. Supply disruptions can delay programs with lead times spanning months to over a year. Exosens must sustain multi‑sourcing and inventory buffers to mitigate these systemic risks.
Qualification and compliance constraints
Defense and medical end-use demands AS9100/ISO13485 and ITAR/EAR compliance, narrowing qualified suppliers to often under 10% of potential vendors and increasing supplier leverage. Requalification commonly takes 6–12 months and costs frequently exceed $100,000 per supplier, raising switching barriers. Long-term contracts and routine audits (annual or biannual) partially rebalance power by locking pricing and ensuring traceability.
Technological specificity
As of 2024, photocathodes, MCPs and ultra-low-noise electronics are highly customized to Exosens designs, creating supplier-specific interfaces that lock in partners across multi-year design-in cycles. Critical IP and process know-how sit upstream with suppliers, reinforcing dependence and raising switching costs. Co-development secures priority access but aligns pricing and roadmaps to supplier strategies, limiting Exosens bargaining power.
Price volatility in rare and strategic materials
Indium, gallium, rare-earth dopants and noble metals expose Exosens to commodity-price swings—supplier concentration remains high (top 3 producers control over 60% of key inputs in 2024), allowing pass-through of surcharges and limiting alternatives. Hedging and multi-year purchase agreements reduce but do not remove exposure; 2024 spot spikes have still forced margin compression on fixed-price contracts. Suppliers' pricing power therefore increases volatility in Exosens' cost structure and short-term profitability.
- Supply concentration: top-3 >60% (2024)
- Hedging limits but cannot fully neutralize spikes
- Fixed-price contracts face margin risk on short-term price shocks
Capital equipment vendors’ leverage
Specialized deposition, vacuum, metrology and lithography tools are concentrated among few OEMs (ASML ~80% of EUV lithography in 2024; Applied, Lam, KLA dominate other tool segments), creating supplier leverage. Spare parts, proprietary service software and repair lock‑ins deepen dependency while low‑defect fabs face downtime costs often cited around $1M+ per hour. SLAs and in‑house maintenance reduce but do not eliminate supplier power.
- Oligopolistic OEMs: ASML/Applied/Lam/KLA
- Lock‑ins: parts, service, software
- Downtime impact: ~$1M+/hour (low‑defect fabs)
- Mitigation: SLAs/in‑house limits but not neutral
Top supplier power: top-3 > 60%, downtime ~$1M+/hr
Supplier power is high: top‑3 control >60% of key inputs (2024), few qualified vendors raise switching costs and requalification often takes 6–12 months at >$100,000. Specialized tool OEMs (ASML/Applied/Lam/KLA) and proprietary spares/services create lock‑ins; fab downtime costs ~$1M+/hour. Hedging and multi‑year contracts reduce but do not remove price/availability exposure.
| Metric | 2024 |
|---|---|
| Top‑3 supplier share | >60% |
| Requalification time/cost | 6–12m / >$100k |
| Downtime cost | ~$1M+/hr |
What is included in the product
Detailed Word Document
Uncovers key drivers of competition, supplier and buyer power, entry barriers, substitutes and disruptive threats tailored to Exosens’ competitive landscape; includes strategic implications for pricing, profitability and market positioning. Fully editable Word format for easy customization in investor materials, strategy decks or academic projects.
Customizable Excel Spreadsheet
A one-sheet, interactive Porter's Five Forces summary that visualizes strategic pressure with a spider chart, lets you customize force levels for evolving market data, and exports cleanly to decks—no macros or finance expertise required.
Customers Bargaining Power
Concentrated OEM and government buyers
Defense primes, medical OEMs, and research institutions act as sophisticated buyers controlling programs funded by governments (US defense procurement ~858 billion USD in 2024) or multibillion medical contracts, allowing them to extract tough pricing, customization, qualification, and lifecycle clauses. Their volume lets them demand lengthy qualifications and ongoing support. For niche suppliers, losing one prime account can cut revenue by over 20%.
High switching costs and performance lock-in
Design-ins for imaging chains and detectors typically span 18–36 months and require costly requalification (often >$500k), creating high switching costs. Mission-critical metrics—SNR, MTBF >100,000 hours and radiation hardness ~50–100 krad—lower buyer willingness to change, boosting Exosens pricing power (ASP uplifts ~15–30% once qualified). Early engagement captures majority of lifetime module revenue and value.
Procurement cycles and cost pressure
Long budgeting cycles and public tenders, which commonly run 3–12 months, force competitive pricing and strict compliance, compressing margins. Buyers typically negotiate 5–15% cost reductions over product lifecycles, but niche technical specs and proprietary interfaces limit direct comparability and preserve roughly 10–20% vendor premium. Service quality and proven reliability remain key differentiators beyond price.
Dual-sourcing where feasible
Large buyers commonly mandate dual-sourcing to reduce supply risk, which caps pricing power and can dilute Exosens share when customers split volumes. For highly specialized sonar components genuine alternatives are scarce, preserving pricing leverage for qualified vendors. Exosens benefits when it is one of few certified suppliers, converting scarcity into stronger contract terms and higher renewal rates.
Aftermarket and lifecycle requirements
Aftermarket and lifecycle requirements drive Exosens negotiations: obsolescence management, spares, and long-term support are baseline demands; in 2024 operators increasingly seek 10+ year support windows and transferrable warranties. Buyers use these needs to push tougher warranty and service terms, while strong field support allows Exosens to command premium pricing; weak support markedly raises buyer power.
Niche suppliers win 15–30% ASP premium in 18–36m design-ins
Defense primes, OEMs and research buyers (US defense spend ~858 billion USD in 2024) extract tough pricing, customization and lifecycle clauses; losing one prime can cut niche supplier revenue >20%. Design-ins take 18–36 months with requalification >$500k, driving switching costs and enabling ASP uplifts ~15–30% for qualified vendors. Long tenders (3–12 months) force 5–15% negotiated cuts but niche specs preserve ~10–20% vendor premium. Aftermarket demands 10+ year support, spares and obsolescence plans.
| Metric | Value |
|---|---|
| US defense spend 2024 | ~858B USD |
| Design-in duration | 18–36 months |
| Requalification cost | >500k USD |
| ASP uplift when qualified | 15–30% |
| Buyer-negotiated cuts | 5–15% |
Preview Before You Purchase
Exosens Porter's Five Forces Analysis
This preview shows the exact Exosens Porter's Five Forces Analysis you'll receive—fully formatted, professionally written and ready for immediate download upon purchase. No mockups or placeholders; the document you see here is the final deliverable. Instant access after payment, ready to use in reports, presentations, or strategy work.
Original: $10.00
-65%$10.00
$3.50Description
Don't Miss the Bigger Picture
Exosens operates in specialized subsea monitoring with a strong tech moat but faces supplier concentration and regulatory uncertainty. Buyer power is moderate given niche customers and long sales cycles, while substitutes from alternative sensing solutions pose a developing threat. This brief snapshot only scratches the surface. Unlock the full Porter's Five Forces Analysis to explore Exosens’s competitive dynamics, market pressures, and strategic advantages in detail.
Suppliers Bargaining Power
Concentrated specialty inputs
Core materials such as microchannel plates, gallium arsenide photocathodes, high‑purity glass and vacuum components come from a highly concentrated supplier base in 2024, with few qualified vendors—often under five—raising switching costs and bottleneck risk. Supply disruptions can delay programs with lead times spanning months to over a year. Exosens must sustain multi‑sourcing and inventory buffers to mitigate these systemic risks.
Qualification and compliance constraints
Defense and medical end-use demands AS9100/ISO13485 and ITAR/EAR compliance, narrowing qualified suppliers to often under 10% of potential vendors and increasing supplier leverage. Requalification commonly takes 6–12 months and costs frequently exceed $100,000 per supplier, raising switching barriers. Long-term contracts and routine audits (annual or biannual) partially rebalance power by locking pricing and ensuring traceability.
Technological specificity
As of 2024, photocathodes, MCPs and ultra-low-noise electronics are highly customized to Exosens designs, creating supplier-specific interfaces that lock in partners across multi-year design-in cycles. Critical IP and process know-how sit upstream with suppliers, reinforcing dependence and raising switching costs. Co-development secures priority access but aligns pricing and roadmaps to supplier strategies, limiting Exosens bargaining power.
Price volatility in rare and strategic materials
Indium, gallium, rare-earth dopants and noble metals expose Exosens to commodity-price swings—supplier concentration remains high (top 3 producers control over 60% of key inputs in 2024), allowing pass-through of surcharges and limiting alternatives. Hedging and multi-year purchase agreements reduce but do not remove exposure; 2024 spot spikes have still forced margin compression on fixed-price contracts. Suppliers' pricing power therefore increases volatility in Exosens' cost structure and short-term profitability.
- Supply concentration: top-3 >60% (2024)
- Hedging limits but cannot fully neutralize spikes
- Fixed-price contracts face margin risk on short-term price shocks
Capital equipment vendors’ leverage
Specialized deposition, vacuum, metrology and lithography tools are concentrated among few OEMs (ASML ~80% of EUV lithography in 2024; Applied, Lam, KLA dominate other tool segments), creating supplier leverage. Spare parts, proprietary service software and repair lock‑ins deepen dependency while low‑defect fabs face downtime costs often cited around $1M+ per hour. SLAs and in‑house maintenance reduce but do not eliminate supplier power.
- Oligopolistic OEMs: ASML/Applied/Lam/KLA
- Lock‑ins: parts, service, software
- Downtime impact: ~$1M+/hour (low‑defect fabs)
- Mitigation: SLAs/in‑house limits but not neutral
Top supplier power: top-3 > 60%, downtime ~$1M+/hr
Supplier power is high: top‑3 control >60% of key inputs (2024), few qualified vendors raise switching costs and requalification often takes 6–12 months at >$100,000. Specialized tool OEMs (ASML/Applied/Lam/KLA) and proprietary spares/services create lock‑ins; fab downtime costs ~$1M+/hour. Hedging and multi‑year contracts reduce but do not remove price/availability exposure.
| Metric | 2024 |
|---|---|
| Top‑3 supplier share | >60% |
| Requalification time/cost | 6–12m / >$100k |
| Downtime cost | ~$1M+/hr |
What is included in the product
Detailed Word Document
Uncovers key drivers of competition, supplier and buyer power, entry barriers, substitutes and disruptive threats tailored to Exosens’ competitive landscape; includes strategic implications for pricing, profitability and market positioning. Fully editable Word format for easy customization in investor materials, strategy decks or academic projects.
Customizable Excel Spreadsheet
A one-sheet, interactive Porter's Five Forces summary that visualizes strategic pressure with a spider chart, lets you customize force levels for evolving market data, and exports cleanly to decks—no macros or finance expertise required.
Customers Bargaining Power
Concentrated OEM and government buyers
Defense primes, medical OEMs, and research institutions act as sophisticated buyers controlling programs funded by governments (US defense procurement ~858 billion USD in 2024) or multibillion medical contracts, allowing them to extract tough pricing, customization, qualification, and lifecycle clauses. Their volume lets them demand lengthy qualifications and ongoing support. For niche suppliers, losing one prime account can cut revenue by over 20%.
High switching costs and performance lock-in
Design-ins for imaging chains and detectors typically span 18–36 months and require costly requalification (often >$500k), creating high switching costs. Mission-critical metrics—SNR, MTBF >100,000 hours and radiation hardness ~50–100 krad—lower buyer willingness to change, boosting Exosens pricing power (ASP uplifts ~15–30% once qualified). Early engagement captures majority of lifetime module revenue and value.
Procurement cycles and cost pressure
Long budgeting cycles and public tenders, which commonly run 3–12 months, force competitive pricing and strict compliance, compressing margins. Buyers typically negotiate 5–15% cost reductions over product lifecycles, but niche technical specs and proprietary interfaces limit direct comparability and preserve roughly 10–20% vendor premium. Service quality and proven reliability remain key differentiators beyond price.
Dual-sourcing where feasible
Large buyers commonly mandate dual-sourcing to reduce supply risk, which caps pricing power and can dilute Exosens share when customers split volumes. For highly specialized sonar components genuine alternatives are scarce, preserving pricing leverage for qualified vendors. Exosens benefits when it is one of few certified suppliers, converting scarcity into stronger contract terms and higher renewal rates.
Aftermarket and lifecycle requirements
Aftermarket and lifecycle requirements drive Exosens negotiations: obsolescence management, spares, and long-term support are baseline demands; in 2024 operators increasingly seek 10+ year support windows and transferrable warranties. Buyers use these needs to push tougher warranty and service terms, while strong field support allows Exosens to command premium pricing; weak support markedly raises buyer power.
Niche suppliers win 15–30% ASP premium in 18–36m design-ins
Defense primes, OEMs and research buyers (US defense spend ~858 billion USD in 2024) extract tough pricing, customization and lifecycle clauses; losing one prime can cut niche supplier revenue >20%. Design-ins take 18–36 months with requalification >$500k, driving switching costs and enabling ASP uplifts ~15–30% for qualified vendors. Long tenders (3–12 months) force 5–15% negotiated cuts but niche specs preserve ~10–20% vendor premium. Aftermarket demands 10+ year support, spares and obsolescence plans.
| Metric | Value |
|---|---|
| US defense spend 2024 | ~858B USD |
| Design-in duration | 18–36 months |
| Requalification cost | >500k USD |
| ASP uplift when qualified | 15–30% |
| Buyer-negotiated cuts | 5–15% |
Preview Before You Purchase
Exosens Porter's Five Forces Analysis
This preview shows the exact Exosens Porter's Five Forces Analysis you'll receive—fully formatted, professionally written and ready for immediate download upon purchase. No mockups or placeholders; the document you see here is the final deliverable. Instant access after payment, ready to use in reports, presentations, or strategy work.











