F5 Porter's Five Forces Analysis

Don't Miss the Bigger Picture
F5’s Porter's Five Forces Analysis highlights how customer bargaining, supplier influence, rivalry, entrant threats and substitutes shape its strategic position. We assess market concentration, switching costs, and technology barriers that affect margins and growth. Scenario-driven insights reveal where F5 can defend pricing and expand value-added services. Unlock the full Porter's Five Forces Analysis to explore F5’s competitive dynamics, market pressures, and strategic advantages in detail.
Suppliers Bargaining Power

Dependence on specialized chips
High-performance ADC/WAF appliances depend on network processors, ASICs and high-speed NICs, narrowing qualified suppliers; global semiconductor sales reached about $600 billion in 2024, underscoring tight markets. Node transitions and supply tightness have driven longer lead times and higher component pricing. F5 mitigates via multi-sourcing and shifting workloads to software/virtual editions, but advanced silicon vendors retain bargaining leverage.
Contract manufacturing concentration
Contract manufacturing concentration means ODM/EMS partners assemble F5 hardware, exposing F5 to capacity allocation and yield issues; 2024 supply-chain disruptions in Asia continued to risk delivery schedules. Volume commitments and retained design IP protect F5 but create lock-in that raises switching costs for multi-year refresh cycles. Regional shocks can ripple through shipments; ongoing software revenue growth in 2024 reduces hardware dependence and supplier leverage.

Cloud platform gatekeepers
Placement in AWS, Azure and GCP marketplaces subjects F5 to marketplace fees often in the 10–20% range and to hyperscaler policy controls; API access and integration roadmaps directly shape F5’s feature velocity. Co-sell partnerships with Microsoft/Azure and others can temper platform power, yet the hyperscalers retain control. Dependence rises as 92% of enterprises report multi-cloud use and AWS/Azure/GCP hold ~66% combined market share (2024).

Third-party software and threat intel
Use of open-source components, signatures, and commercial feed providers creates licensing and compliance constraints; Synopsys 2024 found 98% of codebases include open-source components, amplifying risk. Critical threat feeds are often non-fungible, increasing supplier leverage. F5 reduces dependence by adding proprietary telemetry and its broad integrations make it easier to swap less strategic providers.
- Open-source prevalence: Synopsys 2024 — 98% of codebases
- Non-fungible feeds raise switching costs
- Proprietary telemetry lowers supplier dependence
- Integration breadth enables replacement of minor vendors
Transition to software moderates power
- Less BOM exposure: software-first revenue reduces component spend
- Delivery flexibility: containers/virtual editions lower parts reliance
- Cloud interchangeability: ~65% market concentration in top‑3 clouds (2024)
- Net: supplier power moderated but still material
ASIC, NIC and ODM/EMS suppliers exert moderate‑high power in $600B semiconductor market
Suppliers of ASICs, NICs and ODM/EMS exert moderate‑high power: global semiconductor sales ~$600B (2024) and top‑3 clouds ~65% share increase switching costs; marketplace fees (10–20%) and non‑fungible threat feeds add leverage. F5’s software/SaaS shift, multi‑sourcing and proprietary telemetry moderate but do not eliminate supplier bargaining.
| Metric | 2024 |
|---|---|
| Semiconductor sales | $600B |
| Top‑3 cloud share | ~65% |
| Marketplace fees | 10–20% |
What is included in the product
 Detailed Word Document
Concise Porter’s Five Forces analysis tailored to F5, assessing competitive rivalry, supplier and buyer power, threat of substitutes and entrants, and highlighting disruptive technologies and market dynamics that influence F5’s pricing, margins, and strategic positioning.

 Customizable Excel Spreadsheet
A concise, one-sheet F5 Porter's Five Forces tool with adjustable pressure levels and an instant spider chart—turns complex competitive dynamics into slide-ready insights for fast, confident decisions.
Customers Bargaining Power

Enterprise and service provider scale
Larger enterprise and service-provider buyers push hard on price, contract length, and support SLAs, often extracting lower unit prices and stricter uptime guarantees. Multi-year, multi-product agreements commonly trigger volume discounts and bundling concessions, increasing margin pressure. Strategic accounts can shape product roadmaps through prioritized feature requests and pilot programs. This concentration of big customers elevates buyer power across F5s market.
High but evolving switching costs
Deep policy sets, iRules, and embedded workflows make rip-and-replace costly, locking customers into F5 solutions and sustaining meaningful switching costs. App modernization, containers, and DevOps pipelines — with container adoption near 92% in CNCF 2024 — enable incremental substitution at the edge and reduce migration friction. Hybrid coexistence models further lower immediate switching pain, so net switching costs remain significant but are declining in cloud-native contexts.

Abundant alternatives
Buyers can substitute F5 with cloud-native load balancers, CDN WAFs or integrated security suites, making outcomes comparable and enabling price benchmarking and bake-offs. Hyperscaler reference architectures — with hyperscalers holding roughly two thirds of cloud market spend in 2024 — lower migration friction away from proprietary stacks. This breadth of choice meaningfully expands buyer leverage in contract and pricing negotiations.

Outcome-driven procurement
Customers now demand outcome-driven procurement where app performance, security efficacy and total cost drive purchase decisions; with global SaaS spend surpassing $240B in 2024 buyers press for flexible consumption and cheaper KPI delivery, and proof-of-value trials (increasingly used in 2024) reduce vendor lock and shift negotiations toward value-realization clauses.
- Outcome focus: performance, security, TCO
- Flexible OPEX push: SaaS vs on-prem cost pressure
- Proof-of-value: lowers switching costs
- Contracts: value-realization clauses
Compliance and support expectations
Regulated buyers demand certifications, 99.95–99.999% uptime SLAs and rapid responses often under 1 hour, and they use these requirements to extract premium support at favorable rates. Multi-region coverage and 24x7 expert response are negotiation levers; F5’s global support network and certified services partially counter this bargaining power.
- SLAs: 99.95–99.999%
- Response: <1 hour
- Leverage: multi-region, 24x7
Enterprise buyers force OPEX pilots; cloud-native ~92%, hyperscalers ~66%
Enterprise buyers (large accounts, service providers) drive price, SLA and bundling concessions; multi-year deals yield volume discounts and roadmap influence. Cloud-native options (containers ~92% CNCF 2024) and hyperscalers (~66% cloud spend 2024) raise substitution risk. SaaS spend >$240B (2024) and strict SLAs (99.95–99.999%) push outcome-based, OPEX models and proof-of-value pilots.
| Metric | 2024 |
|---|---|
| Container adoption (CNCF) | ~92% |
| Hyperscaler cloud spend | ~66% |
| Global SaaS spend | $240B+ |
| Typical SLAs | 99.95–99.999% |
Preview the Actual Deliverable
F5 Porter's Five Forces Analysis
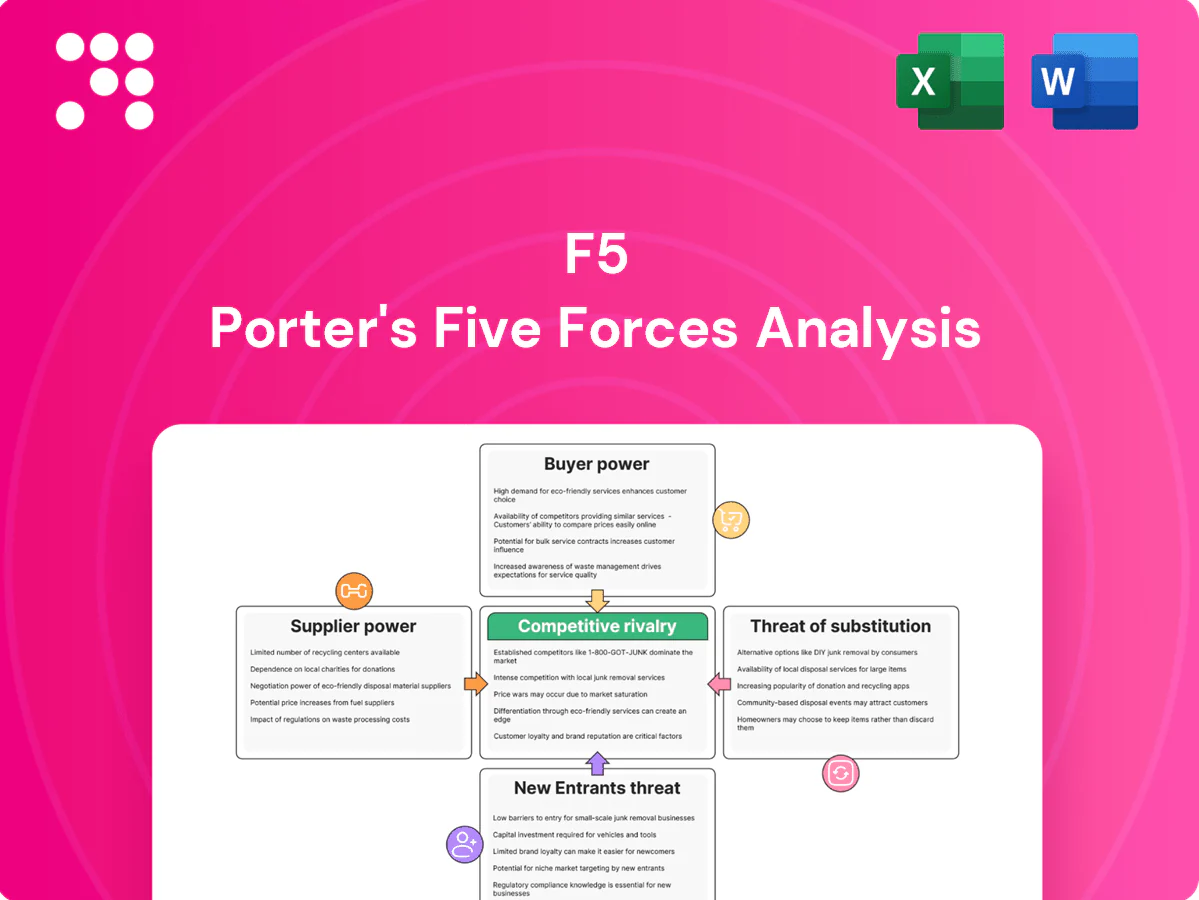
This F5 Porter's Five Forces Analysis preview is the exact, fully formatted document you’ll receive after purchase—no placeholders or samples. It covers competitive rivalry, supplier and buyer power, threat of entry and substitutes with actionable insights. Buy once for immediate download and ready-to-use deliverable.

Don't Miss the Bigger Picture
F5’s Porter's Five Forces Analysis highlights how customer bargaining, supplier influence, rivalry, entrant threats and substitutes shape its strategic position. We assess market concentration, switching costs, and technology barriers that affect margins and growth. Scenario-driven insights reveal where F5 can defend pricing and expand value-added services. Unlock the full Porter's Five Forces Analysis to explore F5’s competitive dynamics, market pressures, and strategic advantages in detail.
Suppliers Bargaining Power
Dependence on specialized chips
High-performance ADC/WAF appliances depend on network processors, ASICs and high-speed NICs, narrowing qualified suppliers; global semiconductor sales reached about $600 billion in 2024, underscoring tight markets. Node transitions and supply tightness have driven longer lead times and higher component pricing. F5 mitigates via multi-sourcing and shifting workloads to software/virtual editions, but advanced silicon vendors retain bargaining leverage.
Contract manufacturing concentration
Contract manufacturing concentration means ODM/EMS partners assemble F5 hardware, exposing F5 to capacity allocation and yield issues; 2024 supply-chain disruptions in Asia continued to risk delivery schedules. Volume commitments and retained design IP protect F5 but create lock-in that raises switching costs for multi-year refresh cycles. Regional shocks can ripple through shipments; ongoing software revenue growth in 2024 reduces hardware dependence and supplier leverage.
Cloud platform gatekeepers
Placement in AWS, Azure and GCP marketplaces subjects F5 to marketplace fees often in the 10–20% range and to hyperscaler policy controls; API access and integration roadmaps directly shape F5’s feature velocity. Co-sell partnerships with Microsoft/Azure and others can temper platform power, yet the hyperscalers retain control. Dependence rises as 92% of enterprises report multi-cloud use and AWS/Azure/GCP hold ~66% combined market share (2024).
Third-party software and threat intel
Use of open-source components, signatures, and commercial feed providers creates licensing and compliance constraints; Synopsys 2024 found 98% of codebases include open-source components, amplifying risk. Critical threat feeds are often non-fungible, increasing supplier leverage. F5 reduces dependence by adding proprietary telemetry and its broad integrations make it easier to swap less strategic providers.
- Open-source prevalence: Synopsys 2024 — 98% of codebases
- Non-fungible feeds raise switching costs
- Proprietary telemetry lowers supplier dependence
- Integration breadth enables replacement of minor vendors
Transition to software moderates power
- Less BOM exposure: software-first revenue reduces component spend
- Delivery flexibility: containers/virtual editions lower parts reliance
- Cloud interchangeability: ~65% market concentration in top‑3 clouds (2024)
- Net: supplier power moderated but still material
ASIC, NIC and ODM/EMS suppliers exert moderate‑high power in $600B semiconductor market
Suppliers of ASICs, NICs and ODM/EMS exert moderate‑high power: global semiconductor sales ~$600B (2024) and top‑3 clouds ~65% share increase switching costs; marketplace fees (10–20%) and non‑fungible threat feeds add leverage. F5’s software/SaaS shift, multi‑sourcing and proprietary telemetry moderate but do not eliminate supplier bargaining.
| Metric | 2024 |
|---|---|
| Semiconductor sales | $600B |
| Top‑3 cloud share | ~65% |
| Marketplace fees | 10–20% |
What is included in the product
Detailed Word Document
Concise Porter’s Five Forces analysis tailored to F5, assessing competitive rivalry, supplier and buyer power, threat of substitutes and entrants, and highlighting disruptive technologies and market dynamics that influence F5’s pricing, margins, and strategic positioning.
Customizable Excel Spreadsheet
A concise, one-sheet F5 Porter's Five Forces tool with adjustable pressure levels and an instant spider chart—turns complex competitive dynamics into slide-ready insights for fast, confident decisions.
Customers Bargaining Power
Enterprise and service provider scale
Larger enterprise and service-provider buyers push hard on price, contract length, and support SLAs, often extracting lower unit prices and stricter uptime guarantees. Multi-year, multi-product agreements commonly trigger volume discounts and bundling concessions, increasing margin pressure. Strategic accounts can shape product roadmaps through prioritized feature requests and pilot programs. This concentration of big customers elevates buyer power across F5s market.
High but evolving switching costs
Deep policy sets, iRules, and embedded workflows make rip-and-replace costly, locking customers into F5 solutions and sustaining meaningful switching costs. App modernization, containers, and DevOps pipelines — with container adoption near 92% in CNCF 2024 — enable incremental substitution at the edge and reduce migration friction. Hybrid coexistence models further lower immediate switching pain, so net switching costs remain significant but are declining in cloud-native contexts.
Abundant alternatives
Buyers can substitute F5 with cloud-native load balancers, CDN WAFs or integrated security suites, making outcomes comparable and enabling price benchmarking and bake-offs. Hyperscaler reference architectures — with hyperscalers holding roughly two thirds of cloud market spend in 2024 — lower migration friction away from proprietary stacks. This breadth of choice meaningfully expands buyer leverage in contract and pricing negotiations.
Outcome-driven procurement
Customers now demand outcome-driven procurement where app performance, security efficacy and total cost drive purchase decisions; with global SaaS spend surpassing $240B in 2024 buyers press for flexible consumption and cheaper KPI delivery, and proof-of-value trials (increasingly used in 2024) reduce vendor lock and shift negotiations toward value-realization clauses.
- Outcome focus: performance, security, TCO
- Flexible OPEX push: SaaS vs on-prem cost pressure
- Proof-of-value: lowers switching costs
- Contracts: value-realization clauses
Compliance and support expectations
Regulated buyers demand certifications, 99.95–99.999% uptime SLAs and rapid responses often under 1 hour, and they use these requirements to extract premium support at favorable rates. Multi-region coverage and 24x7 expert response are negotiation levers; F5’s global support network and certified services partially counter this bargaining power.
- SLAs: 99.95–99.999%
- Response: <1 hour
- Leverage: multi-region, 24x7
Enterprise buyers force OPEX pilots; cloud-native ~92%, hyperscalers ~66%
Enterprise buyers (large accounts, service providers) drive price, SLA and bundling concessions; multi-year deals yield volume discounts and roadmap influence. Cloud-native options (containers ~92% CNCF 2024) and hyperscalers (~66% cloud spend 2024) raise substitution risk. SaaS spend >$240B (2024) and strict SLAs (99.95–99.999%) push outcome-based, OPEX models and proof-of-value pilots.
| Metric | 2024 |
|---|---|
| Container adoption (CNCF) | ~92% |
| Hyperscaler cloud spend | ~66% |
| Global SaaS spend | $240B+ |
| Typical SLAs | 99.95–99.999% |
Preview the Actual Deliverable
F5 Porter's Five Forces Analysis
This F5 Porter's Five Forces Analysis preview is the exact, fully formatted document you’ll receive after purchase—no placeholders or samples. It covers competitive rivalry, supplier and buyer power, threat of entry and substitutes with actionable insights. Buy once for immediate download and ready-to-use deliverable.
Original: $10.00
-65%$10.00
$3.50Description
Don't Miss the Bigger Picture
F5’s Porter's Five Forces Analysis highlights how customer bargaining, supplier influence, rivalry, entrant threats and substitutes shape its strategic position. We assess market concentration, switching costs, and technology barriers that affect margins and growth. Scenario-driven insights reveal where F5 can defend pricing and expand value-added services. Unlock the full Porter's Five Forces Analysis to explore F5’s competitive dynamics, market pressures, and strategic advantages in detail.
Suppliers Bargaining Power
Dependence on specialized chips
High-performance ADC/WAF appliances depend on network processors, ASICs and high-speed NICs, narrowing qualified suppliers; global semiconductor sales reached about $600 billion in 2024, underscoring tight markets. Node transitions and supply tightness have driven longer lead times and higher component pricing. F5 mitigates via multi-sourcing and shifting workloads to software/virtual editions, but advanced silicon vendors retain bargaining leverage.
Contract manufacturing concentration
Contract manufacturing concentration means ODM/EMS partners assemble F5 hardware, exposing F5 to capacity allocation and yield issues; 2024 supply-chain disruptions in Asia continued to risk delivery schedules. Volume commitments and retained design IP protect F5 but create lock-in that raises switching costs for multi-year refresh cycles. Regional shocks can ripple through shipments; ongoing software revenue growth in 2024 reduces hardware dependence and supplier leverage.
Cloud platform gatekeepers
Placement in AWS, Azure and GCP marketplaces subjects F5 to marketplace fees often in the 10–20% range and to hyperscaler policy controls; API access and integration roadmaps directly shape F5’s feature velocity. Co-sell partnerships with Microsoft/Azure and others can temper platform power, yet the hyperscalers retain control. Dependence rises as 92% of enterprises report multi-cloud use and AWS/Azure/GCP hold ~66% combined market share (2024).
Third-party software and threat intel
Use of open-source components, signatures, and commercial feed providers creates licensing and compliance constraints; Synopsys 2024 found 98% of codebases include open-source components, amplifying risk. Critical threat feeds are often non-fungible, increasing supplier leverage. F5 reduces dependence by adding proprietary telemetry and its broad integrations make it easier to swap less strategic providers.
- Open-source prevalence: Synopsys 2024 — 98% of codebases
- Non-fungible feeds raise switching costs
- Proprietary telemetry lowers supplier dependence
- Integration breadth enables replacement of minor vendors
Transition to software moderates power
- Less BOM exposure: software-first revenue reduces component spend
- Delivery flexibility: containers/virtual editions lower parts reliance
- Cloud interchangeability: ~65% market concentration in top‑3 clouds (2024)
- Net: supplier power moderated but still material
ASIC, NIC and ODM/EMS suppliers exert moderate‑high power in $600B semiconductor market
Suppliers of ASICs, NICs and ODM/EMS exert moderate‑high power: global semiconductor sales ~$600B (2024) and top‑3 clouds ~65% share increase switching costs; marketplace fees (10–20%) and non‑fungible threat feeds add leverage. F5’s software/SaaS shift, multi‑sourcing and proprietary telemetry moderate but do not eliminate supplier bargaining.
| Metric | 2024 |
|---|---|
| Semiconductor sales | $600B |
| Top‑3 cloud share | ~65% |
| Marketplace fees | 10–20% |
What is included in the product
Detailed Word Document
Concise Porter’s Five Forces analysis tailored to F5, assessing competitive rivalry, supplier and buyer power, threat of substitutes and entrants, and highlighting disruptive technologies and market dynamics that influence F5’s pricing, margins, and strategic positioning.
Customizable Excel Spreadsheet
A concise, one-sheet F5 Porter's Five Forces tool with adjustable pressure levels and an instant spider chart—turns complex competitive dynamics into slide-ready insights for fast, confident decisions.
Customers Bargaining Power
Enterprise and service provider scale
Larger enterprise and service-provider buyers push hard on price, contract length, and support SLAs, often extracting lower unit prices and stricter uptime guarantees. Multi-year, multi-product agreements commonly trigger volume discounts and bundling concessions, increasing margin pressure. Strategic accounts can shape product roadmaps through prioritized feature requests and pilot programs. This concentration of big customers elevates buyer power across F5s market.
High but evolving switching costs
Deep policy sets, iRules, and embedded workflows make rip-and-replace costly, locking customers into F5 solutions and sustaining meaningful switching costs. App modernization, containers, and DevOps pipelines — with container adoption near 92% in CNCF 2024 — enable incremental substitution at the edge and reduce migration friction. Hybrid coexistence models further lower immediate switching pain, so net switching costs remain significant but are declining in cloud-native contexts.
Abundant alternatives
Buyers can substitute F5 with cloud-native load balancers, CDN WAFs or integrated security suites, making outcomes comparable and enabling price benchmarking and bake-offs. Hyperscaler reference architectures — with hyperscalers holding roughly two thirds of cloud market spend in 2024 — lower migration friction away from proprietary stacks. This breadth of choice meaningfully expands buyer leverage in contract and pricing negotiations.
Outcome-driven procurement
Customers now demand outcome-driven procurement where app performance, security efficacy and total cost drive purchase decisions; with global SaaS spend surpassing $240B in 2024 buyers press for flexible consumption and cheaper KPI delivery, and proof-of-value trials (increasingly used in 2024) reduce vendor lock and shift negotiations toward value-realization clauses.
- Outcome focus: performance, security, TCO
- Flexible OPEX push: SaaS vs on-prem cost pressure
- Proof-of-value: lowers switching costs
- Contracts: value-realization clauses
Compliance and support expectations
Regulated buyers demand certifications, 99.95–99.999% uptime SLAs and rapid responses often under 1 hour, and they use these requirements to extract premium support at favorable rates. Multi-region coverage and 24x7 expert response are negotiation levers; F5’s global support network and certified services partially counter this bargaining power.
- SLAs: 99.95–99.999%
- Response: <1 hour
- Leverage: multi-region, 24x7
Enterprise buyers force OPEX pilots; cloud-native ~92%, hyperscalers ~66%
Enterprise buyers (large accounts, service providers) drive price, SLA and bundling concessions; multi-year deals yield volume discounts and roadmap influence. Cloud-native options (containers ~92% CNCF 2024) and hyperscalers (~66% cloud spend 2024) raise substitution risk. SaaS spend >$240B (2024) and strict SLAs (99.95–99.999%) push outcome-based, OPEX models and proof-of-value pilots.
| Metric | 2024 |
|---|---|
| Container adoption (CNCF) | ~92% |
| Hyperscaler cloud spend | ~66% |
| Global SaaS spend | $240B+ |
| Typical SLAs | 99.95–99.999% |
Preview the Actual Deliverable
F5 Porter's Five Forces Analysis
This F5 Porter's Five Forces Analysis preview is the exact, fully formatted document you’ll receive after purchase—no placeholders or samples. It covers competitive rivalry, supplier and buyer power, threat of entry and substitutes with actionable insights. Buy once for immediate download and ready-to-use deliverable.











