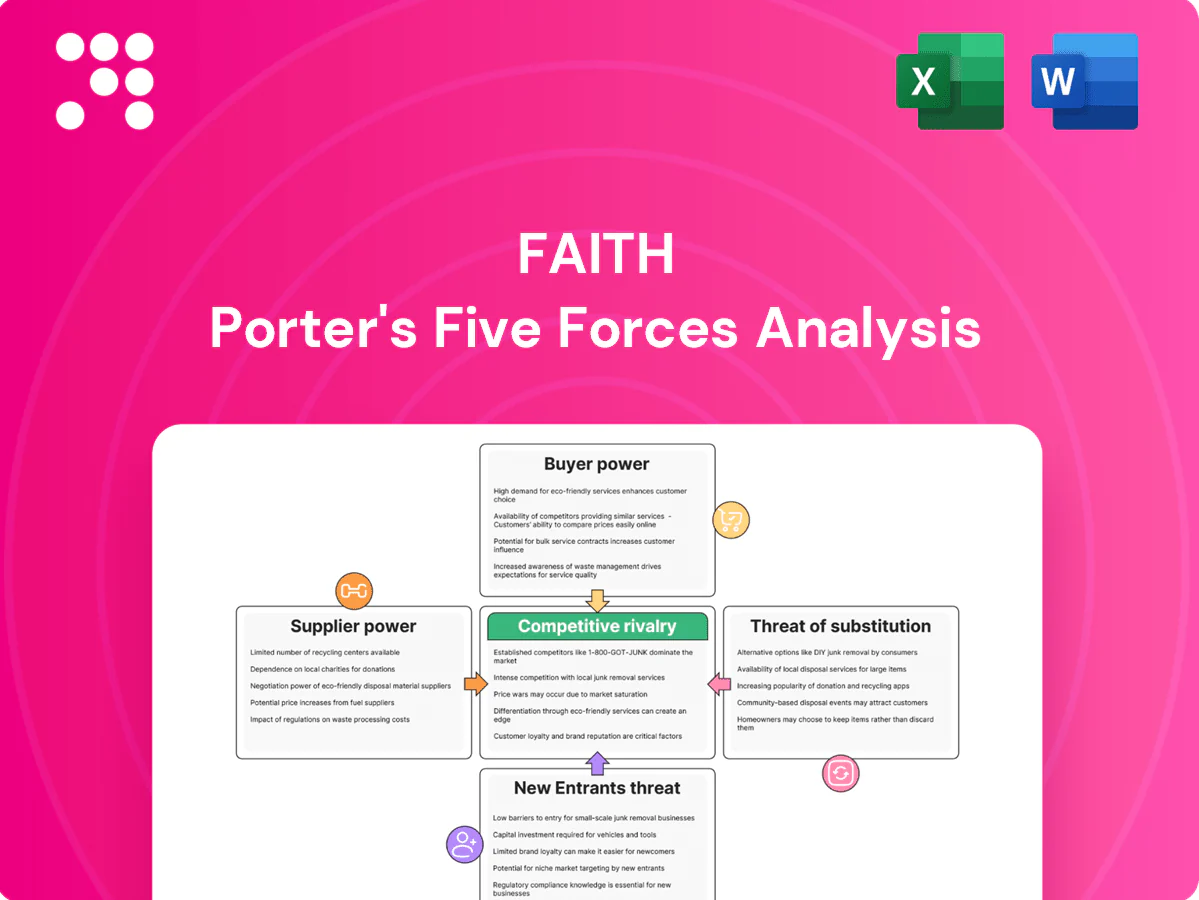
Faith Porter's Five Forces Analysis

A Must-Have Tool for Decision-Makers
Faith Porter's Five Forces distills competitive pressures—supplier and buyer power, substitute threats, entry barriers, and rival rivalry—into a clear strategic snapshot. This brief teases key dynamics; unlock the full Porter's Five Forces Analysis for force-by-force ratings, visuals, and actionable recommendations to guide investment or strategy.
Suppliers Bargaining Power

Major label licensing leverage
Global and domestic major labels hold must-have catalogs—Big Three labels controlled roughly 70% of the global recorded-music market in 2024 (IFPI), giving them leverage for premium terms and windowing. Faith faces take-rate pressure, minimum guarantees and marketing-commitment requirements that compress margins. Losing a marquee label would noticeably degrade user value and B2B credibility. Multi-year label contracts reduce revenue volatility but constrain strategic flexibility.
Artist and rights-holder fragmentation
Independent artists, publishers and PROs create negotiation complexity and higher admin costs as platforms juggle thousands of rights-holders; streaming accounted for roughly 80% of recorded music revenue in 2024, amplifying payout debates. Individually weak but collectively influential, they affect feature placement and payout models, and demands for data transparency increase integration burdens while long-tail content—driving a sizable share of niche retention—raises catalog importance.

Platform and channel dependence
App stores and OEMs act as gatekeepers, charging fees up to 30% (15% small-developer rate in 2024) and using ranking algorithms and bundle terms that compress margins. Telcos and OEM billing deals can demand revenue shares and exclusive bundles; global mobile subscriptions reached about 8.5 billion in 2024, concentrating reach. Privacy shifts like Apple ATT have raised iOS CPI by ~30%, disrupting acquisition economics. Securing co-marketing or preferred placement typically requires sizeable scale and spend.

Cloud and tech stack providers
Reliance on cloud, CDN, DRM and analytics vendors creates meaningful switching costs and locks Faith Porter into vendor-specific integrations; top cloud players hold roughly 65% market share (AWS ~32%, Azure ~23%, GCP ~11% in 2023–24). Price escalators and egress fees (about $0.09/GB or ~$90/TB on common tiers) materially erode streaming unit economics, while vendor outages risk SLA breaches for B2B clients. Multi-cloud and modular architectures reduce concentration and switching risk.
Data and metadata suppliers
- Concentration: Big Three ≈70% market share (2024)
- Cost: enhanced-data licensing adds per-user fees
- Risk: inaccuracies → takedowns/royalty disputes
- Mitigation: internal pipelines reduce but don’t eliminate reliance
Rights-holders squeezed: labels ~70%, streaming ≈80%, platform fees up to 30%
Supplier power is high: Big Three labels held ~70% of recorded-music market in 2024, enabling premium terms and windowing. Streaming generated ≈80% of recorded-music revenue in 2024, raising payout pressure from many rights-holders. Platform gatekeepers demand fees up to 30% (15% small-developer rate in 2024) and co-marketing spend. Cloud/CDN concentration (~65% market; AWS 32%, Azure 23%, GCP 11%) plus egress ≈$0.09/GB raise unit costs.
| Metric | Value | Year |
|---|---|---|
| Big Three market share | ~70% | 2024 |
| Streaming share of revenue | ≈80% | 2024 |
| App-store fee | Up to 30% (15% small) | 2024 |
| Top cloud share (AWS/AZ/GCP) | 32%/23%/11% (~65% total) | 2023–24 |
| Egress cost | ≈$0.09/GB | 2023–24 |
What is included in the product
 Detailed Word Document
Provides a tailored Five Forces review of Faith Porter, uncovering competitive drivers, supplier and buyer power, threats from substitutes and new entrants, and rivalry intensity; includes data-backed insights on disruptors, pricing influence, market-entry barriers, and a fully editable Word format for investor and strategy use.

 Customizable Excel Spreadsheet
A one-sheet Faith Porter's Five Forces template that turns complex competitive analysis into a clickable decision tool—customize pressure levels, swap in your data, and generate an instant spider chart for board-ready visuals without macros or coding.
Customers Bargaining Power

Consumers with low switching costs
Users can migrate among streaming apps easily as catalogs converge and freemium models convert only about 3–5% to paid in 2024, keeping switching costs low; price sensitivity is high—surveys show roughly 70% of Gen Z trade or cancel subscriptions for price—forcing continuous promotions and feature churn mitigation, while network effects remain modest beyond social features and shared playlists.
Enterprise media clients
Enterprise media clients — labels, broadcasters, and entertainment firms — routinely run RFPs and multi-vendor tenders, demanding custom integrations, strict SLAs, and volume discounts. The Big Three labels control roughly 70% of the recorded-music market in 2024, concentrating negotiating power. High contract concentration creates revenue volatility when a few clients dominate spend. Strong case studies and compliance credentials materially strengthen price defense.

Telecom and bundle partners
Telcos extract steep concessions on wholesale rates and co-branding rights, leveraging 5.8 billion unique mobile subscribers in 2024 (GSMA) to push bundled plans that shift bargaining power to carriers. Churn-driven offers often force revenue-share and promotional discounts that dilute margins, but access to large subscriber bases can offset per-user margin pressure through scale.

Developers and B2B integrators
Developers and B2B integrators in 2024 prioritized stable endpoints, clear documentation, and sandbox access; transparent, usage-based pricing tiers drove faster trials and adoption while standards-based APIs made switching feasible, increasing pressure to compete on support and SLA; embedding value-added analytics and observability raised stickiness and expanded lifetime value.
- stable endpoints, docs, sandboxes
- transparent, usage-based pricing
- standards enable switching — service differentiates
- analytics increase customer retention
International clients and localization
International clients demand localization, multi-currency billing and regional compliance while benchmarking against global best-in-class providers, raising switching pressure. Demands for 24/7 support and 99.9% uptime SLAs materially increase operating costs. Local partnerships and co-investment can blunt buyer leverage by sharing compliance and support burdens.
- Localization requirements
- Multi-currency billing
- 24/7 support & 99.9% SLA
- Local partnerships reduce leverage
Freemium 3–5%; labels ~70%;carriers 5.8B
Low switching costs as catalogs converge; freemium converts 3–5% to paid in 2024 and ~70% of Gen Z swap/cancel for price, forcing promotions.
Enterprise buyers run RFPs, demand SLAs and discounts; Big Three labels hold ~70% of recorded-music market in 2024, concentrating leverage.
Carriers (5.8B mobile subs in 2024) and international SLAs (99.9%) push revenue-share and localization costs, while API/analytics raise stickiness.
| Segment | Key metric (2024) | Impact |
|---|---|---|
| Consumers | Freemium conv 3–5%; 70% Gen Z price-sensitive | High churn, promo pressure |
| Enterprise | Labels 70% market share | Contract concentration, negotiation power |
| Carriers/Intl | 5.8B mobile subs; 99.9% SLA req | Revenue-share, localization costs |
Same Document Delivered
Faith Porter's Five Forces Analysis
This preview shows Faith Porter's Five Forces Analysis exactly as you'll receive it after purchase—no samples, no placeholders. The document is fully formatted and ready for immediate download and use the moment you complete your order. What you see here is the final deliverable, prepared to support your strategic decision-making without further setup.

A Must-Have Tool for Decision-Makers
Faith Porter's Five Forces distills competitive pressures—supplier and buyer power, substitute threats, entry barriers, and rival rivalry—into a clear strategic snapshot. This brief teases key dynamics; unlock the full Porter's Five Forces Analysis for force-by-force ratings, visuals, and actionable recommendations to guide investment or strategy.
Suppliers Bargaining Power
Major label licensing leverage
Global and domestic major labels hold must-have catalogs—Big Three labels controlled roughly 70% of the global recorded-music market in 2024 (IFPI), giving them leverage for premium terms and windowing. Faith faces take-rate pressure, minimum guarantees and marketing-commitment requirements that compress margins. Losing a marquee label would noticeably degrade user value and B2B credibility. Multi-year label contracts reduce revenue volatility but constrain strategic flexibility.
Artist and rights-holder fragmentation
Independent artists, publishers and PROs create negotiation complexity and higher admin costs as platforms juggle thousands of rights-holders; streaming accounted for roughly 80% of recorded music revenue in 2024, amplifying payout debates. Individually weak but collectively influential, they affect feature placement and payout models, and demands for data transparency increase integration burdens while long-tail content—driving a sizable share of niche retention—raises catalog importance.
Platform and channel dependence
App stores and OEMs act as gatekeepers, charging fees up to 30% (15% small-developer rate in 2024) and using ranking algorithms and bundle terms that compress margins. Telcos and OEM billing deals can demand revenue shares and exclusive bundles; global mobile subscriptions reached about 8.5 billion in 2024, concentrating reach. Privacy shifts like Apple ATT have raised iOS CPI by ~30%, disrupting acquisition economics. Securing co-marketing or preferred placement typically requires sizeable scale and spend.
Cloud and tech stack providers
Reliance on cloud, CDN, DRM and analytics vendors creates meaningful switching costs and locks Faith Porter into vendor-specific integrations; top cloud players hold roughly 65% market share (AWS ~32%, Azure ~23%, GCP ~11% in 2023–24). Price escalators and egress fees (about $0.09/GB or ~$90/TB on common tiers) materially erode streaming unit economics, while vendor outages risk SLA breaches for B2B clients. Multi-cloud and modular architectures reduce concentration and switching risk.
Data and metadata suppliers
- Concentration: Big Three ≈70% market share (2024)
- Cost: enhanced-data licensing adds per-user fees
- Risk: inaccuracies → takedowns/royalty disputes
- Mitigation: internal pipelines reduce but don’t eliminate reliance
Rights-holders squeezed: labels ~70%, streaming ≈80%, platform fees up to 30%
Supplier power is high: Big Three labels held ~70% of recorded-music market in 2024, enabling premium terms and windowing. Streaming generated ≈80% of recorded-music revenue in 2024, raising payout pressure from many rights-holders. Platform gatekeepers demand fees up to 30% (15% small-developer rate in 2024) and co-marketing spend. Cloud/CDN concentration (~65% market; AWS 32%, Azure 23%, GCP 11%) plus egress ≈$0.09/GB raise unit costs.
| Metric | Value | Year |
|---|---|---|
| Big Three market share | ~70% | 2024 |
| Streaming share of revenue | ≈80% | 2024 |
| App-store fee | Up to 30% (15% small) | 2024 |
| Top cloud share (AWS/AZ/GCP) | 32%/23%/11% (~65% total) | 2023–24 |
| Egress cost | ≈$0.09/GB | 2023–24 |
What is included in the product
Detailed Word Document
Provides a tailored Five Forces review of Faith Porter, uncovering competitive drivers, supplier and buyer power, threats from substitutes and new entrants, and rivalry intensity; includes data-backed insights on disruptors, pricing influence, market-entry barriers, and a fully editable Word format for investor and strategy use.
Customizable Excel Spreadsheet
A one-sheet Faith Porter's Five Forces template that turns complex competitive analysis into a clickable decision tool—customize pressure levels, swap in your data, and generate an instant spider chart for board-ready visuals without macros or coding.
Customers Bargaining Power
Consumers with low switching costs
Users can migrate among streaming apps easily as catalogs converge and freemium models convert only about 3–5% to paid in 2024, keeping switching costs low; price sensitivity is high—surveys show roughly 70% of Gen Z trade or cancel subscriptions for price—forcing continuous promotions and feature churn mitigation, while network effects remain modest beyond social features and shared playlists.
Enterprise media clients
Enterprise media clients — labels, broadcasters, and entertainment firms — routinely run RFPs and multi-vendor tenders, demanding custom integrations, strict SLAs, and volume discounts. The Big Three labels control roughly 70% of the recorded-music market in 2024, concentrating negotiating power. High contract concentration creates revenue volatility when a few clients dominate spend. Strong case studies and compliance credentials materially strengthen price defense.
Telecom and bundle partners
Telcos extract steep concessions on wholesale rates and co-branding rights, leveraging 5.8 billion unique mobile subscribers in 2024 (GSMA) to push bundled plans that shift bargaining power to carriers. Churn-driven offers often force revenue-share and promotional discounts that dilute margins, but access to large subscriber bases can offset per-user margin pressure through scale.
Developers and B2B integrators
Developers and B2B integrators in 2024 prioritized stable endpoints, clear documentation, and sandbox access; transparent, usage-based pricing tiers drove faster trials and adoption while standards-based APIs made switching feasible, increasing pressure to compete on support and SLA; embedding value-added analytics and observability raised stickiness and expanded lifetime value.
- stable endpoints, docs, sandboxes
- transparent, usage-based pricing
- standards enable switching — service differentiates
- analytics increase customer retention
International clients and localization
International clients demand localization, multi-currency billing and regional compliance while benchmarking against global best-in-class providers, raising switching pressure. Demands for 24/7 support and 99.9% uptime SLAs materially increase operating costs. Local partnerships and co-investment can blunt buyer leverage by sharing compliance and support burdens.
- Localization requirements
- Multi-currency billing
- 24/7 support & 99.9% SLA
- Local partnerships reduce leverage
Freemium 3–5%; labels ~70%;carriers 5.8B
Low switching costs as catalogs converge; freemium converts 3–5% to paid in 2024 and ~70% of Gen Z swap/cancel for price, forcing promotions.
Enterprise buyers run RFPs, demand SLAs and discounts; Big Three labels hold ~70% of recorded-music market in 2024, concentrating leverage.
Carriers (5.8B mobile subs in 2024) and international SLAs (99.9%) push revenue-share and localization costs, while API/analytics raise stickiness.
| Segment | Key metric (2024) | Impact |
|---|---|---|
| Consumers | Freemium conv 3–5%; 70% Gen Z price-sensitive | High churn, promo pressure |
| Enterprise | Labels 70% market share | Contract concentration, negotiation power |
| Carriers/Intl | 5.8B mobile subs; 99.9% SLA req | Revenue-share, localization costs |
Same Document Delivered
Faith Porter's Five Forces Analysis
This preview shows Faith Porter's Five Forces Analysis exactly as you'll receive it after purchase—no samples, no placeholders. The document is fully formatted and ready for immediate download and use the moment you complete your order. What you see here is the final deliverable, prepared to support your strategic decision-making without further setup.
Original: $10.00
-65%$10.00
$3.50Description
A Must-Have Tool for Decision-Makers
Faith Porter's Five Forces distills competitive pressures—supplier and buyer power, substitute threats, entry barriers, and rival rivalry—into a clear strategic snapshot. This brief teases key dynamics; unlock the full Porter's Five Forces Analysis for force-by-force ratings, visuals, and actionable recommendations to guide investment or strategy.
Suppliers Bargaining Power
Major label licensing leverage
Global and domestic major labels hold must-have catalogs—Big Three labels controlled roughly 70% of the global recorded-music market in 2024 (IFPI), giving them leverage for premium terms and windowing. Faith faces take-rate pressure, minimum guarantees and marketing-commitment requirements that compress margins. Losing a marquee label would noticeably degrade user value and B2B credibility. Multi-year label contracts reduce revenue volatility but constrain strategic flexibility.
Artist and rights-holder fragmentation
Independent artists, publishers and PROs create negotiation complexity and higher admin costs as platforms juggle thousands of rights-holders; streaming accounted for roughly 80% of recorded music revenue in 2024, amplifying payout debates. Individually weak but collectively influential, they affect feature placement and payout models, and demands for data transparency increase integration burdens while long-tail content—driving a sizable share of niche retention—raises catalog importance.
Platform and channel dependence
App stores and OEMs act as gatekeepers, charging fees up to 30% (15% small-developer rate in 2024) and using ranking algorithms and bundle terms that compress margins. Telcos and OEM billing deals can demand revenue shares and exclusive bundles; global mobile subscriptions reached about 8.5 billion in 2024, concentrating reach. Privacy shifts like Apple ATT have raised iOS CPI by ~30%, disrupting acquisition economics. Securing co-marketing or preferred placement typically requires sizeable scale and spend.
Cloud and tech stack providers
Reliance on cloud, CDN, DRM and analytics vendors creates meaningful switching costs and locks Faith Porter into vendor-specific integrations; top cloud players hold roughly 65% market share (AWS ~32%, Azure ~23%, GCP ~11% in 2023–24). Price escalators and egress fees (about $0.09/GB or ~$90/TB on common tiers) materially erode streaming unit economics, while vendor outages risk SLA breaches for B2B clients. Multi-cloud and modular architectures reduce concentration and switching risk.
Data and metadata suppliers
- Concentration: Big Three ≈70% market share (2024)
- Cost: enhanced-data licensing adds per-user fees
- Risk: inaccuracies → takedowns/royalty disputes
- Mitigation: internal pipelines reduce but don’t eliminate reliance
Rights-holders squeezed: labels ~70%, streaming ≈80%, platform fees up to 30%
Supplier power is high: Big Three labels held ~70% of recorded-music market in 2024, enabling premium terms and windowing. Streaming generated ≈80% of recorded-music revenue in 2024, raising payout pressure from many rights-holders. Platform gatekeepers demand fees up to 30% (15% small-developer rate in 2024) and co-marketing spend. Cloud/CDN concentration (~65% market; AWS 32%, Azure 23%, GCP 11%) plus egress ≈$0.09/GB raise unit costs.
| Metric | Value | Year |
|---|---|---|
| Big Three market share | ~70% | 2024 |
| Streaming share of revenue | ≈80% | 2024 |
| App-store fee | Up to 30% (15% small) | 2024 |
| Top cloud share (AWS/AZ/GCP) | 32%/23%/11% (~65% total) | 2023–24 |
| Egress cost | ≈$0.09/GB | 2023–24 |
What is included in the product
Detailed Word Document
Provides a tailored Five Forces review of Faith Porter, uncovering competitive drivers, supplier and buyer power, threats from substitutes and new entrants, and rivalry intensity; includes data-backed insights on disruptors, pricing influence, market-entry barriers, and a fully editable Word format for investor and strategy use.
Customizable Excel Spreadsheet
A one-sheet Faith Porter's Five Forces template that turns complex competitive analysis into a clickable decision tool—customize pressure levels, swap in your data, and generate an instant spider chart for board-ready visuals without macros or coding.
Customers Bargaining Power
Consumers with low switching costs
Users can migrate among streaming apps easily as catalogs converge and freemium models convert only about 3–5% to paid in 2024, keeping switching costs low; price sensitivity is high—surveys show roughly 70% of Gen Z trade or cancel subscriptions for price—forcing continuous promotions and feature churn mitigation, while network effects remain modest beyond social features and shared playlists.
Enterprise media clients
Enterprise media clients — labels, broadcasters, and entertainment firms — routinely run RFPs and multi-vendor tenders, demanding custom integrations, strict SLAs, and volume discounts. The Big Three labels control roughly 70% of the recorded-music market in 2024, concentrating negotiating power. High contract concentration creates revenue volatility when a few clients dominate spend. Strong case studies and compliance credentials materially strengthen price defense.
Telecom and bundle partners
Telcos extract steep concessions on wholesale rates and co-branding rights, leveraging 5.8 billion unique mobile subscribers in 2024 (GSMA) to push bundled plans that shift bargaining power to carriers. Churn-driven offers often force revenue-share and promotional discounts that dilute margins, but access to large subscriber bases can offset per-user margin pressure through scale.
Developers and B2B integrators
Developers and B2B integrators in 2024 prioritized stable endpoints, clear documentation, and sandbox access; transparent, usage-based pricing tiers drove faster trials and adoption while standards-based APIs made switching feasible, increasing pressure to compete on support and SLA; embedding value-added analytics and observability raised stickiness and expanded lifetime value.
- stable endpoints, docs, sandboxes
- transparent, usage-based pricing
- standards enable switching — service differentiates
- analytics increase customer retention
International clients and localization
International clients demand localization, multi-currency billing and regional compliance while benchmarking against global best-in-class providers, raising switching pressure. Demands for 24/7 support and 99.9% uptime SLAs materially increase operating costs. Local partnerships and co-investment can blunt buyer leverage by sharing compliance and support burdens.
- Localization requirements
- Multi-currency billing
- 24/7 support & 99.9% SLA
- Local partnerships reduce leverage
Freemium 3–5%; labels ~70%;carriers 5.8B
Low switching costs as catalogs converge; freemium converts 3–5% to paid in 2024 and ~70% of Gen Z swap/cancel for price, forcing promotions.
Enterprise buyers run RFPs, demand SLAs and discounts; Big Three labels hold ~70% of recorded-music market in 2024, concentrating leverage.
Carriers (5.8B mobile subs in 2024) and international SLAs (99.9%) push revenue-share and localization costs, while API/analytics raise stickiness.
| Segment | Key metric (2024) | Impact |
|---|---|---|
| Consumers | Freemium conv 3–5%; 70% Gen Z price-sensitive | High churn, promo pressure |
| Enterprise | Labels 70% market share | Contract concentration, negotiation power |
| Carriers/Intl | 5.8B mobile subs; 99.9% SLA req | Revenue-share, localization costs |
Same Document Delivered
Faith Porter's Five Forces Analysis
This preview shows Faith Porter's Five Forces Analysis exactly as you'll receive it after purchase—no samples, no placeholders. The document is fully formatted and ready for immediate download and use the moment you complete your order. What you see here is the final deliverable, prepared to support your strategic decision-making without further setup.











