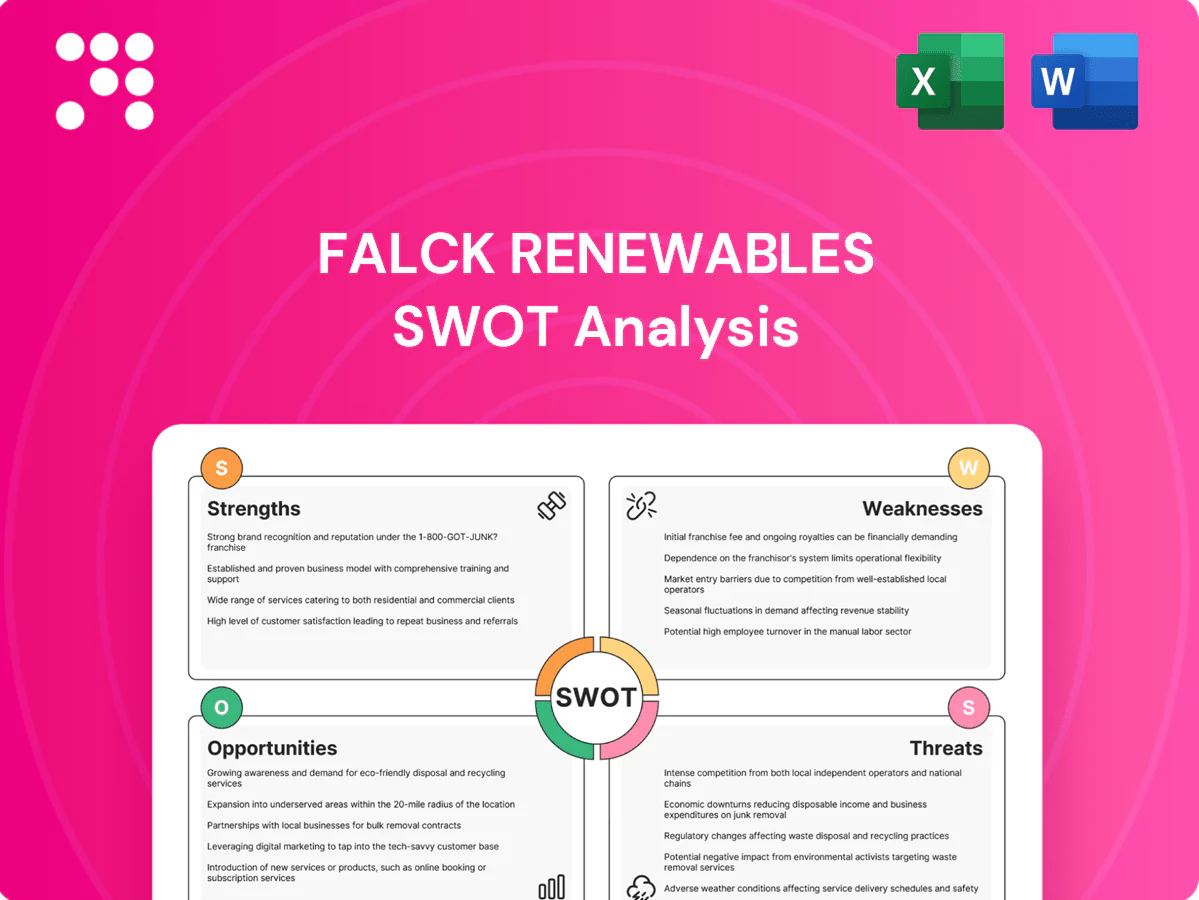
Falck Renewables SWOT Analysis

Your Strategic Toolkit Starts Here
Falck Renewables stands at the intersection of steady project pipeline, technological expertise and ESG tailwinds, yet faces regulatory exposure and market price risks that could reshape near-term returns. Discover the complete picture behind the company’s market position with our full SWOT analysis—actionable insights, financial context, and strategic takeaways for investors and advisors. Purchase the full report to access a professionally written, editable analysis you can use today.
Strengths

Diversified renewables mix
Falck Renewables' diversified mix—covering wind, solar, biomass and waste-to-energy—supports roughly 1.35 GW of installed capacity, smoothing generation and cash flows across seasons. Technology diversity hedges resource risk and policy shifts affecting any single segment and enabled a 2024 O&M cost efficiency gain versus prior year. Cross-learning in development and O&M improves project uptime and resilience through market cycles.
Full value-chain capability
Falck Renewables delivers development-to-operation for a c.1.6 GW portfolio (2024), capturing margins across design, construction and operations. Vertical integration tightens project selection, cost control and delivery certainty, reducing timelines and capex overruns. In-house O&M raises availability and output performance. End-to-end capability strengthens bankability and counterparty confidence for long-term PPAs.

Global project execution
Experience across multiple geographies has given Falck Renewables know-how in diverse regulatory, grid and permitting regimes, supporting project delivery across its c.1.3 GW operational fleet and larger development pipeline (2024). A global footprint diversifies the pipeline and balances country risk, aided by localized partnerships and EPC networks that improve bid competitiveness. Multi-country exposure enhances optionality in capital allocation and project sequencing.

Contracted revenue base
Long-term PPAs and feed-in frameworks (typically 10–20 year tenors) have underpinned predictable cash flows for Falck Renewables, with roughly 80% of generation capacity contracted, cutting merchant exposure and easing project financing. Stable contracted revenues support reinvestment and portfolio scaling, a profile that attracted infrastructure investors and strategic acquirers.
- Tenor: 10–20 years
- Contracted share: ~80%
- Financing: lower cost of capital vs merchant
- Investor appeal: strong for infra funds/strategics
Operational excellence
Falck Renewables leverages proven asset management and performance optimisation to raise availability and yield, supporting higher realized generation per MW; the group reported about 1.4 GW net installed capacity in 2024. Data-driven O&M and stricter vendor oversight have progressively lowered LCOE and improved margins, while targeted repowering and upgrades extended asset life and value. Strong operations enabled competitive auction bids and project wins.
- Asset base ~1.4 GW (2024)
- Data-driven O&M lowered LCOE
- Repowering extended asset life
- Operations supported auction success
Diversified renewables: ~1.4 GW, ~80% contracted, vertical integration
Diversified fleet (wind, solar, biomass, WtE) and tech mix support ~1.4 GW net installed capacity (2024), smoothing generation and cash flow. Vertical integration captures development-to-operation margins across a c.1.6 GW portfolio, improving delivery and bankability. ~80% of capacity contracted with 10–20 year tenors, lowering merchant risk and cost of capital.
| Metric | Value (2024) |
|---|---|
| Net installed capacity | ~1.4 GW |
| Portfolio (dev+op) | ~1.6 GW |
| Contracted share | ~80% |
What is included in the product
 Detailed Word Document
Provides a concise SWOT analysis of Falck Renewables, highlighting its renewable energy portfolio and technological strengths, operational and financing weaknesses, growth opportunities in green power and markets, and external threats from regulatory shifts and competition.

 Customizable Excel Spreadsheet
Provides a focused Falck Renewables SWOT matrix for fast strategic alignment and investor briefings, highlighting key strengths, risks and growth opportunities at a glance.
Weaknesses

Capital-intensive model
Building and acquiring utility-scale assets requires significant upfront capital and leverage, with onshore wind and solar capex commonly exceeding €1m per MW. Financing cycles and covenant constraints can limit growth pace and flexibility. Equity recycling relies on active secondary markets for asset sales, which can tighten in downturns. Rising capex and supply-chain inflation can compress returns if not passed through to offtakers.
Intermittency and curtailment
Intermittent wind and solar output creates forecasting and balancing challenges; Falck Renewables faces historical curtailment in some markets of roughly 5–7% of potential output, eroding realized revenues and pushing up imbalance costs that can reach double-digit €/MWh in volatile hours. Grid constraints and curtailment events therefore reduce merchant income, and without sufficient storage or hedging exposure to imbalance penalties persists; portfolio-level smoothing only partially offsets these risks.

Scale gap vs mega-players
Falck Renewables' platform remains materially smaller—operational capacity roughly 1.3 GW—than mega-players with multi‑GW portfolios, limiting procurement leverage and auction competitiveness where global-scale economics prevail. Balance-sheet depth constrains simultaneous multi‑GW builds, and brand visibility can lag in new markets versus top-tier IPPs and oil majors with far larger renewables footprints.

Regulatory concentration risk
Falck Renewables faces regulatory concentration risk where country-specific policy shifts can materially hit clustered returns; permitting timelines commonly span 2–5 years and US-style grid queue backlogs exceed 1,200 GW (FERC 2023), creating serial bottlenecks. Sudden subsidy-design changes can strand development pipelines, while managing heterogeneous compliance regimes raises operational and administrative overhead.
- country-exposure: clustered policy risk
- permitting-delays: 2–5 years, queue backlogs >1,200 GW
- subsidy-risk: pipeline stranding
- compliance-overhead: multi-jurisdiction costs
Biomass/WtE perception issues
Biomass and waste-to-energy face increasing scrutiny over lifecycle emissions and feedstock traceability, making investors and regulators more cautious; ESG-focused capital often favors wind and solar, potentially valuing these assets lower. Policy classifications remain volatile as rules evolve, raising revenue and subsidy uncertainty, while local community opposition can delay or halt projects, increasing cost and permitting risk.
- Lifecycle emissions concerns
- ESG investor discount vs wind/solar
- Volatile policy incentives
- Community acceptance risks
>€1m/MW capex and ~5-7% curtailment limit 1.3 GW amid 2-5 yr permits
Falck Renewables' 1.3 GW platform faces high upfront capex (>€1m/MW) and leverage limits, constraining multi‑GW growth. Intermittency causes ~5–7% curtailment and double‑digit €/MWh imbalance costs, reducing merchant income. Regulatory/permitting risk (2–5 yrs; grid queues >1,200 GW) and biomass ESG scrutiny raise subsidy and investor uncertainty.
| Metric | Value |
|---|---|
| Operational capacity | 1.3 GW |
| Capex | >€1m/MW |
| Curtailment | ~5–7% |
| Permitting | 2–5 yrs |
| Grid queue | >1,200 GW |
| Imbalance cost | double‑digit €/MWh |
Preview the Actual Deliverable
Falck Renewables SWOT Analysis
This Falck Renewables SWOT Analysis preview is the actual document you’ll receive after purchase—no surprises, just professional quality. The excerpt below is pulled directly from the full, editable report, ready for immediate download upon payment.

Your Strategic Toolkit Starts Here
Falck Renewables stands at the intersection of steady project pipeline, technological expertise and ESG tailwinds, yet faces regulatory exposure and market price risks that could reshape near-term returns. Discover the complete picture behind the company’s market position with our full SWOT analysis—actionable insights, financial context, and strategic takeaways for investors and advisors. Purchase the full report to access a professionally written, editable analysis you can use today.
Strengths
Diversified renewables mix
Falck Renewables' diversified mix—covering wind, solar, biomass and waste-to-energy—supports roughly 1.35 GW of installed capacity, smoothing generation and cash flows across seasons. Technology diversity hedges resource risk and policy shifts affecting any single segment and enabled a 2024 O&M cost efficiency gain versus prior year. Cross-learning in development and O&M improves project uptime and resilience through market cycles.
Full value-chain capability
Falck Renewables delivers development-to-operation for a c.1.6 GW portfolio (2024), capturing margins across design, construction and operations. Vertical integration tightens project selection, cost control and delivery certainty, reducing timelines and capex overruns. In-house O&M raises availability and output performance. End-to-end capability strengthens bankability and counterparty confidence for long-term PPAs.
Global project execution
Experience across multiple geographies has given Falck Renewables know-how in diverse regulatory, grid and permitting regimes, supporting project delivery across its c.1.3 GW operational fleet and larger development pipeline (2024). A global footprint diversifies the pipeline and balances country risk, aided by localized partnerships and EPC networks that improve bid competitiveness. Multi-country exposure enhances optionality in capital allocation and project sequencing.
Contracted revenue base
Long-term PPAs and feed-in frameworks (typically 10–20 year tenors) have underpinned predictable cash flows for Falck Renewables, with roughly 80% of generation capacity contracted, cutting merchant exposure and easing project financing. Stable contracted revenues support reinvestment and portfolio scaling, a profile that attracted infrastructure investors and strategic acquirers.
- Tenor: 10–20 years
- Contracted share: ~80%
- Financing: lower cost of capital vs merchant
- Investor appeal: strong for infra funds/strategics
Operational excellence
Falck Renewables leverages proven asset management and performance optimisation to raise availability and yield, supporting higher realized generation per MW; the group reported about 1.4 GW net installed capacity in 2024. Data-driven O&M and stricter vendor oversight have progressively lowered LCOE and improved margins, while targeted repowering and upgrades extended asset life and value. Strong operations enabled competitive auction bids and project wins.
- Asset base ~1.4 GW (2024)
- Data-driven O&M lowered LCOE
- Repowering extended asset life
- Operations supported auction success
Diversified renewables: ~1.4 GW, ~80% contracted, vertical integration
Diversified fleet (wind, solar, biomass, WtE) and tech mix support ~1.4 GW net installed capacity (2024), smoothing generation and cash flow. Vertical integration captures development-to-operation margins across a c.1.6 GW portfolio, improving delivery and bankability. ~80% of capacity contracted with 10–20 year tenors, lowering merchant risk and cost of capital.
| Metric | Value (2024) |
|---|---|
| Net installed capacity | ~1.4 GW |
| Portfolio (dev+op) | ~1.6 GW |
| Contracted share | ~80% |
What is included in the product
Detailed Word Document
Provides a concise SWOT analysis of Falck Renewables, highlighting its renewable energy portfolio and technological strengths, operational and financing weaknesses, growth opportunities in green power and markets, and external threats from regulatory shifts and competition.
Customizable Excel Spreadsheet
Provides a focused Falck Renewables SWOT matrix for fast strategic alignment and investor briefings, highlighting key strengths, risks and growth opportunities at a glance.
Weaknesses
Capital-intensive model
Building and acquiring utility-scale assets requires significant upfront capital and leverage, with onshore wind and solar capex commonly exceeding €1m per MW. Financing cycles and covenant constraints can limit growth pace and flexibility. Equity recycling relies on active secondary markets for asset sales, which can tighten in downturns. Rising capex and supply-chain inflation can compress returns if not passed through to offtakers.
Intermittency and curtailment
Intermittent wind and solar output creates forecasting and balancing challenges; Falck Renewables faces historical curtailment in some markets of roughly 5–7% of potential output, eroding realized revenues and pushing up imbalance costs that can reach double-digit €/MWh in volatile hours. Grid constraints and curtailment events therefore reduce merchant income, and without sufficient storage or hedging exposure to imbalance penalties persists; portfolio-level smoothing only partially offsets these risks.
Scale gap vs mega-players
Falck Renewables' platform remains materially smaller—operational capacity roughly 1.3 GW—than mega-players with multi‑GW portfolios, limiting procurement leverage and auction competitiveness where global-scale economics prevail. Balance-sheet depth constrains simultaneous multi‑GW builds, and brand visibility can lag in new markets versus top-tier IPPs and oil majors with far larger renewables footprints.
Regulatory concentration risk
Falck Renewables faces regulatory concentration risk where country-specific policy shifts can materially hit clustered returns; permitting timelines commonly span 2–5 years and US-style grid queue backlogs exceed 1,200 GW (FERC 2023), creating serial bottlenecks. Sudden subsidy-design changes can strand development pipelines, while managing heterogeneous compliance regimes raises operational and administrative overhead.
- country-exposure: clustered policy risk
- permitting-delays: 2–5 years, queue backlogs >1,200 GW
- subsidy-risk: pipeline stranding
- compliance-overhead: multi-jurisdiction costs
Biomass/WtE perception issues
Biomass and waste-to-energy face increasing scrutiny over lifecycle emissions and feedstock traceability, making investors and regulators more cautious; ESG-focused capital often favors wind and solar, potentially valuing these assets lower. Policy classifications remain volatile as rules evolve, raising revenue and subsidy uncertainty, while local community opposition can delay or halt projects, increasing cost and permitting risk.
- Lifecycle emissions concerns
- ESG investor discount vs wind/solar
- Volatile policy incentives
- Community acceptance risks
>€1m/MW capex and ~5-7% curtailment limit 1.3 GW amid 2-5 yr permits
Falck Renewables' 1.3 GW platform faces high upfront capex (>€1m/MW) and leverage limits, constraining multi‑GW growth. Intermittency causes ~5–7% curtailment and double‑digit €/MWh imbalance costs, reducing merchant income. Regulatory/permitting risk (2–5 yrs; grid queues >1,200 GW) and biomass ESG scrutiny raise subsidy and investor uncertainty.
| Metric | Value |
|---|---|
| Operational capacity | 1.3 GW |
| Capex | >€1m/MW |
| Curtailment | ~5–7% |
| Permitting | 2–5 yrs |
| Grid queue | >1,200 GW |
| Imbalance cost | double‑digit €/MWh |
Preview the Actual Deliverable
Falck Renewables SWOT Analysis
This Falck Renewables SWOT Analysis preview is the actual document you’ll receive after purchase—no surprises, just professional quality. The excerpt below is pulled directly from the full, editable report, ready for immediate download upon payment.
Original: $10.00
-65%$10.00
$3.50Description
Your Strategic Toolkit Starts Here
Falck Renewables stands at the intersection of steady project pipeline, technological expertise and ESG tailwinds, yet faces regulatory exposure and market price risks that could reshape near-term returns. Discover the complete picture behind the company’s market position with our full SWOT analysis—actionable insights, financial context, and strategic takeaways for investors and advisors. Purchase the full report to access a professionally written, editable analysis you can use today.
Strengths
Diversified renewables mix
Falck Renewables' diversified mix—covering wind, solar, biomass and waste-to-energy—supports roughly 1.35 GW of installed capacity, smoothing generation and cash flows across seasons. Technology diversity hedges resource risk and policy shifts affecting any single segment and enabled a 2024 O&M cost efficiency gain versus prior year. Cross-learning in development and O&M improves project uptime and resilience through market cycles.
Full value-chain capability
Falck Renewables delivers development-to-operation for a c.1.6 GW portfolio (2024), capturing margins across design, construction and operations. Vertical integration tightens project selection, cost control and delivery certainty, reducing timelines and capex overruns. In-house O&M raises availability and output performance. End-to-end capability strengthens bankability and counterparty confidence for long-term PPAs.
Global project execution
Experience across multiple geographies has given Falck Renewables know-how in diverse regulatory, grid and permitting regimes, supporting project delivery across its c.1.3 GW operational fleet and larger development pipeline (2024). A global footprint diversifies the pipeline and balances country risk, aided by localized partnerships and EPC networks that improve bid competitiveness. Multi-country exposure enhances optionality in capital allocation and project sequencing.
Contracted revenue base
Long-term PPAs and feed-in frameworks (typically 10–20 year tenors) have underpinned predictable cash flows for Falck Renewables, with roughly 80% of generation capacity contracted, cutting merchant exposure and easing project financing. Stable contracted revenues support reinvestment and portfolio scaling, a profile that attracted infrastructure investors and strategic acquirers.
- Tenor: 10–20 years
- Contracted share: ~80%
- Financing: lower cost of capital vs merchant
- Investor appeal: strong for infra funds/strategics
Operational excellence
Falck Renewables leverages proven asset management and performance optimisation to raise availability and yield, supporting higher realized generation per MW; the group reported about 1.4 GW net installed capacity in 2024. Data-driven O&M and stricter vendor oversight have progressively lowered LCOE and improved margins, while targeted repowering and upgrades extended asset life and value. Strong operations enabled competitive auction bids and project wins.
- Asset base ~1.4 GW (2024)
- Data-driven O&M lowered LCOE
- Repowering extended asset life
- Operations supported auction success
Diversified renewables: ~1.4 GW, ~80% contracted, vertical integration
Diversified fleet (wind, solar, biomass, WtE) and tech mix support ~1.4 GW net installed capacity (2024), smoothing generation and cash flow. Vertical integration captures development-to-operation margins across a c.1.6 GW portfolio, improving delivery and bankability. ~80% of capacity contracted with 10–20 year tenors, lowering merchant risk and cost of capital.
| Metric | Value (2024) |
|---|---|
| Net installed capacity | ~1.4 GW |
| Portfolio (dev+op) | ~1.6 GW |
| Contracted share | ~80% |
What is included in the product
Detailed Word Document
Provides a concise SWOT analysis of Falck Renewables, highlighting its renewable energy portfolio and technological strengths, operational and financing weaknesses, growth opportunities in green power and markets, and external threats from regulatory shifts and competition.
Customizable Excel Spreadsheet
Provides a focused Falck Renewables SWOT matrix for fast strategic alignment and investor briefings, highlighting key strengths, risks and growth opportunities at a glance.
Weaknesses
Capital-intensive model
Building and acquiring utility-scale assets requires significant upfront capital and leverage, with onshore wind and solar capex commonly exceeding €1m per MW. Financing cycles and covenant constraints can limit growth pace and flexibility. Equity recycling relies on active secondary markets for asset sales, which can tighten in downturns. Rising capex and supply-chain inflation can compress returns if not passed through to offtakers.
Intermittency and curtailment
Intermittent wind and solar output creates forecasting and balancing challenges; Falck Renewables faces historical curtailment in some markets of roughly 5–7% of potential output, eroding realized revenues and pushing up imbalance costs that can reach double-digit €/MWh in volatile hours. Grid constraints and curtailment events therefore reduce merchant income, and without sufficient storage or hedging exposure to imbalance penalties persists; portfolio-level smoothing only partially offsets these risks.
Scale gap vs mega-players
Falck Renewables' platform remains materially smaller—operational capacity roughly 1.3 GW—than mega-players with multi‑GW portfolios, limiting procurement leverage and auction competitiveness where global-scale economics prevail. Balance-sheet depth constrains simultaneous multi‑GW builds, and brand visibility can lag in new markets versus top-tier IPPs and oil majors with far larger renewables footprints.
Regulatory concentration risk
Falck Renewables faces regulatory concentration risk where country-specific policy shifts can materially hit clustered returns; permitting timelines commonly span 2–5 years and US-style grid queue backlogs exceed 1,200 GW (FERC 2023), creating serial bottlenecks. Sudden subsidy-design changes can strand development pipelines, while managing heterogeneous compliance regimes raises operational and administrative overhead.
- country-exposure: clustered policy risk
- permitting-delays: 2–5 years, queue backlogs >1,200 GW
- subsidy-risk: pipeline stranding
- compliance-overhead: multi-jurisdiction costs
Biomass/WtE perception issues
Biomass and waste-to-energy face increasing scrutiny over lifecycle emissions and feedstock traceability, making investors and regulators more cautious; ESG-focused capital often favors wind and solar, potentially valuing these assets lower. Policy classifications remain volatile as rules evolve, raising revenue and subsidy uncertainty, while local community opposition can delay or halt projects, increasing cost and permitting risk.
- Lifecycle emissions concerns
- ESG investor discount vs wind/solar
- Volatile policy incentives
- Community acceptance risks
>€1m/MW capex and ~5-7% curtailment limit 1.3 GW amid 2-5 yr permits
Falck Renewables' 1.3 GW platform faces high upfront capex (>€1m/MW) and leverage limits, constraining multi‑GW growth. Intermittency causes ~5–7% curtailment and double‑digit €/MWh imbalance costs, reducing merchant income. Regulatory/permitting risk (2–5 yrs; grid queues >1,200 GW) and biomass ESG scrutiny raise subsidy and investor uncertainty.
| Metric | Value |
|---|---|
| Operational capacity | 1.3 GW |
| Capex | >€1m/MW |
| Curtailment | ~5–7% |
| Permitting | 2–5 yrs |
| Grid queue | >1,200 GW |
| Imbalance cost | double‑digit €/MWh |
Preview the Actual Deliverable
Falck Renewables SWOT Analysis
This Falck Renewables SWOT Analysis preview is the actual document you’ll receive after purchase—no surprises, just professional quality. The excerpt below is pulled directly from the full, editable report, ready for immediate download upon payment.











