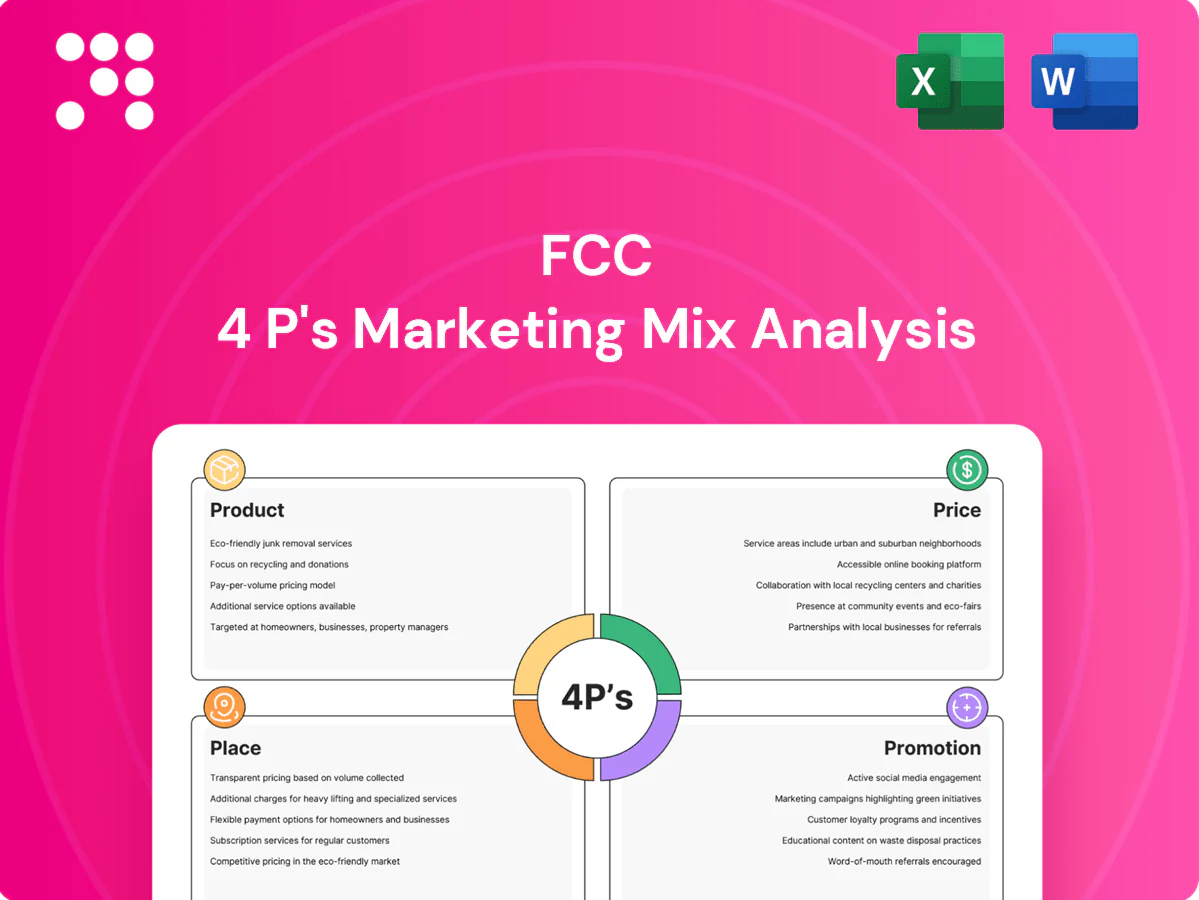
FCC Marketing Mix

Built for Strategy. Ready in Minutes.
Discover how FCC’s product positioning, pricing architecture, distribution channels, and promotion tactics combine to drive market performance. This concise preview highlights key strengths and gaps—grab the full 4Ps Marketing Mix Analysis for a deep, editable report. Save time with ready-made slides and actionable recommendations. Purchase now to apply FCC’s strategies to your plans.
Product

Integrated waste management services
Integrated waste management services cover municipal and industrial collection, sorting, recycling and energy-from-waste, aligning with circularity goals and landfill diversion. Modular service design tailors offerings by city size and waste stream, supporting regulatory compliance. Real-time monitoring enhances service quality and transparency; the World Bank projects global municipal solid waste will reach 3.4 billion tonnes by 2050, underscoring scale and demand.
Water treatment and management
FCC offers end-to-end drinking water, wastewater, desalination and network O&M services with a focus on water quality, non-revenue water reduction and climate resilience; global desalination capacity is ~100 million m3/day. Smart metering can cut NRW 20–30% and SCADA reduces O&M and energy costs ~15–25%, improving customer outcomes. Projects range from design-build to 20–30 year operation contracts; desalination costs typically $0.5–1.5/m3.

Infrastructure construction and engineering
Delivery of transport, civil works and urban infrastructure with EPC capabilities leverages BIM and lean construction for complex, large-scale projects, targeting improved schedule reliability and lifecycle cost control. The construction sector accounts for about 13% of global GDP and buildings plus construction drive roughly 37% of energy-related CO2 emissions, underpinning the focus on safety and sustainability. With urbanization expected to reach 68% by 2050, integration with environmental services enables city-scale, climate-resilient solutions.

Real estate and urban development
Real estate and urban development focuses on sustainable residential and mixed-use assets tied to urban regeneration, integrating green building standards and energy-efficient design to reduce the sector's impact; buildings and construction account for about 37% of global CO2 emissions (IEA 2023). Green-certified assets show rent/sales premiums typically in the 5–12% range (CBRE/GRESB studies). Portfolio management balances development, sales and rental income while leveraging infrastructure synergies to boost placemaking value.
- 37% of global CO2 emissions from buildings and construction (IEA 2023)
- 5–12% rent/sales premium for green-certified assets (CBRE/GRESB)
- Sustainable, energy-efficient designs aligned with urban regeneration
- Portfolio balance: development, sales and rental income
- Infrastructure synergies enhance placemaking and demand
Operations, maintenance, and smart-city solutions
O&M for utilities, public spaces and facilities uses IoT-enabled asset management to monitor assets in real time across concession portfolios.
Predictive maintenance cuts unplanned downtime by up to 70% and maintenance costs by up to 30%, improving capex-to-opex ratios for municipal clients.
Interactive dashboards deliver KPIs (uptime, MTTR, energy use) and SLAs (eg 99.9% critical-asset availability) for measurable outcomes.
- IoT asset tracking
- Predictive alerts
- Dashboard KPIs
- SLA-driven reporting
City suite: 3.4bn t MSW by 2050; desal 100M m3/day; buildings 37% CO2
FCC product suite bundles integrated waste, water, transport, real estate and O&M with modular contracts, smart IoT and circularity to serve city-scale needs; MSW projected 3.4bn t by 2050 (World Bank). Desalination ~100M m3/day; costs $0.5–1.5/m3. Buildings drive 37% CO2 (IEA 2023). Predictive maintenance cuts downtime up to 70% and maintenance costs ~30%.
| Service | Metric | Impact |
|---|---|---|
| Waste | 3.4bn t by 2050 | Scale, landfill diversion |
| Water | 100M m3/day | NRW -20–30% |
| Construction | 37% CO2 | Sustainable design premium |
| O&M | -70% downtime | Lower opex |
What is included in the product
 Detailed Word Document
Delivers a company-specific deep dive into FCC’s Product, Price, Place, and Promotion strategies using real brand practices and competitive context to ground recommendations; ideal for managers, consultants, and marketers needing a complete, ready-to-present breakdown. Clean, editable layout supports benchmarking, market-entry planning, and strategy audits with clear examples, positioning, and actionable implications.

 Customizable Excel Spreadsheet
Condenses the FCC 4P's into a concise, presentation-ready snapshot that relieves briefing overload and speeds alignment, easily customized for decks, meetings, or side-by-side brand comparisons.
Place

Global multi-regional presence
FCC's multi-regional footprint spans Europe, Latin America, the Middle East and select North America/Asia markets, operating in over 30 countries to capture diversified project flows. Local subsidiaries tailor services to regulatory and cultural contexts, while central expertise hubs in Europe and Latin America coordinate complex bids and execution. Geographic and segment diversification reduces concentration risk and smooths revenue volatility across cycles.
Public-private partnerships and tenders
Primary route to market via municipal contracts, concessions and PPP frameworks, with typical PPP concession lengths of 10–30 years ensuring service continuity and predictable, indexed revenues. Dedicated bid teams handle RFPs, compliance and prequalification, managing performance bonds often in the 5–10% range of contract value. Strong references materially boost competitiveness in tenders and improve win prospects.

Direct municipal and industrial client channels
Direct sales target cities, utilities and large industrial clients through key account managers who maintain multi-year relationships (typically 3–10 years). Tailored SLAs specify response times from 2 hours for critical incidents to 24 hours for routine issues. Dedicated onsite teams enable rapid issue resolution, supporting long-term contracts and predictable revenue streams.

Digital portals and service control centers
Client dashboards aggregate KPIs, incident tickets and automated reports, with 70% of enterprise service teams using dashboards for SLA compliance; fleet telematics and route optimization cut fuel and maintenance costs by up to 15% and improve on‑time arrivals; remote monitoring centers reduce unplanned downtime by up to 30% while overseeing plants and networks; secure data sharing increases transparency and client trust across operations.
- dashboards: KPI tracking, ticketing, reporting
- telematics: route optimization, 15% cost savings
- remote monitoring: -30% downtime
- data sharing: transparency and trust
Decentralized depots and logistics hubs
Decentralized depots—local transfer stations, MRFs, water plants and maintenance bases—place assets near service areas, cutting route miles by up to 30% and CO2 emissions by ~20%, with operating cost savings of 10–15%. Standardized SOPs (ISO 14001-aligned) deliver consistent quality across sites and enable rapid mobilization for seasonal or emergency needs within 24–48 hours.
- Route reduction: up to 30%
- Emissions cut: ~20%
- Cost savings: 10–15%
- Mobilization: 24–48 hrs
Depots cut route miles up to 30%, reducing CO2 ~20% and fleet costs ~15%
Place: FCC operates in 30+ countries with centralized hubs in Europe/Latin America; primary sales via municipal contracts/PPPs (10–30 yr) and direct key-account teams (3–10 yr). Decentralized depots cut route miles up to 30% and CO2 ~20%; dashboards used by 70% of enterprise clients; telematics save ~15% fleet costs.
| Metric | Value |
|---|---|
| Countries | 30+ |
| PPP length | 10–30 yrs |
| Route reduction | ≤30% |
| CO2 cut | ~20% |
What You Preview Is What You Download
FCC 4P's Marketing Mix Analysis
The preview shown here is the actual FCC 4P's Marketing Mix Analysis you’ll receive instantly after purchase—no surprises. This is the full, editable document ready for immediate use. You’re viewing the exact final version included with your order.

Built for Strategy. Ready in Minutes.
Discover how FCC’s product positioning, pricing architecture, distribution channels, and promotion tactics combine to drive market performance. This concise preview highlights key strengths and gaps—grab the full 4Ps Marketing Mix Analysis for a deep, editable report. Save time with ready-made slides and actionable recommendations. Purchase now to apply FCC’s strategies to your plans.
Product
Integrated waste management services
Integrated waste management services cover municipal and industrial collection, sorting, recycling and energy-from-waste, aligning with circularity goals and landfill diversion. Modular service design tailors offerings by city size and waste stream, supporting regulatory compliance. Real-time monitoring enhances service quality and transparency; the World Bank projects global municipal solid waste will reach 3.4 billion tonnes by 2050, underscoring scale and demand.
Water treatment and management
FCC offers end-to-end drinking water, wastewater, desalination and network O&M services with a focus on water quality, non-revenue water reduction and climate resilience; global desalination capacity is ~100 million m3/day. Smart metering can cut NRW 20–30% and SCADA reduces O&M and energy costs ~15–25%, improving customer outcomes. Projects range from design-build to 20–30 year operation contracts; desalination costs typically $0.5–1.5/m3.
Infrastructure construction and engineering
Delivery of transport, civil works and urban infrastructure with EPC capabilities leverages BIM and lean construction for complex, large-scale projects, targeting improved schedule reliability and lifecycle cost control. The construction sector accounts for about 13% of global GDP and buildings plus construction drive roughly 37% of energy-related CO2 emissions, underpinning the focus on safety and sustainability. With urbanization expected to reach 68% by 2050, integration with environmental services enables city-scale, climate-resilient solutions.
Real estate and urban development
Real estate and urban development focuses on sustainable residential and mixed-use assets tied to urban regeneration, integrating green building standards and energy-efficient design to reduce the sector's impact; buildings and construction account for about 37% of global CO2 emissions (IEA 2023). Green-certified assets show rent/sales premiums typically in the 5–12% range (CBRE/GRESB studies). Portfolio management balances development, sales and rental income while leveraging infrastructure synergies to boost placemaking value.
- 37% of global CO2 emissions from buildings and construction (IEA 2023)
- 5–12% rent/sales premium for green-certified assets (CBRE/GRESB)
- Sustainable, energy-efficient designs aligned with urban regeneration
- Portfolio balance: development, sales and rental income
- Infrastructure synergies enhance placemaking and demand
Operations, maintenance, and smart-city solutions
O&M for utilities, public spaces and facilities uses IoT-enabled asset management to monitor assets in real time across concession portfolios.
Predictive maintenance cuts unplanned downtime by up to 70% and maintenance costs by up to 30%, improving capex-to-opex ratios for municipal clients.
Interactive dashboards deliver KPIs (uptime, MTTR, energy use) and SLAs (eg 99.9% critical-asset availability) for measurable outcomes.
- IoT asset tracking
- Predictive alerts
- Dashboard KPIs
- SLA-driven reporting
City suite: 3.4bn t MSW by 2050; desal 100M m3/day; buildings 37% CO2
FCC product suite bundles integrated waste, water, transport, real estate and O&M with modular contracts, smart IoT and circularity to serve city-scale needs; MSW projected 3.4bn t by 2050 (World Bank). Desalination ~100M m3/day; costs $0.5–1.5/m3. Buildings drive 37% CO2 (IEA 2023). Predictive maintenance cuts downtime up to 70% and maintenance costs ~30%.
| Service | Metric | Impact |
|---|---|---|
| Waste | 3.4bn t by 2050 | Scale, landfill diversion |
| Water | 100M m3/day | NRW -20–30% |
| Construction | 37% CO2 | Sustainable design premium |
| O&M | -70% downtime | Lower opex |
What is included in the product
Detailed Word Document
Delivers a company-specific deep dive into FCC’s Product, Price, Place, and Promotion strategies using real brand practices and competitive context to ground recommendations; ideal for managers, consultants, and marketers needing a complete, ready-to-present breakdown. Clean, editable layout supports benchmarking, market-entry planning, and strategy audits with clear examples, positioning, and actionable implications.
Customizable Excel Spreadsheet
Condenses the FCC 4P's into a concise, presentation-ready snapshot that relieves briefing overload and speeds alignment, easily customized for decks, meetings, or side-by-side brand comparisons.
Place
Global multi-regional presence
FCC's multi-regional footprint spans Europe, Latin America, the Middle East and select North America/Asia markets, operating in over 30 countries to capture diversified project flows. Local subsidiaries tailor services to regulatory and cultural contexts, while central expertise hubs in Europe and Latin America coordinate complex bids and execution. Geographic and segment diversification reduces concentration risk and smooths revenue volatility across cycles.
Public-private partnerships and tenders
Primary route to market via municipal contracts, concessions and PPP frameworks, with typical PPP concession lengths of 10–30 years ensuring service continuity and predictable, indexed revenues. Dedicated bid teams handle RFPs, compliance and prequalification, managing performance bonds often in the 5–10% range of contract value. Strong references materially boost competitiveness in tenders and improve win prospects.
Direct municipal and industrial client channels
Direct sales target cities, utilities and large industrial clients through key account managers who maintain multi-year relationships (typically 3–10 years). Tailored SLAs specify response times from 2 hours for critical incidents to 24 hours for routine issues. Dedicated onsite teams enable rapid issue resolution, supporting long-term contracts and predictable revenue streams.
Digital portals and service control centers
Client dashboards aggregate KPIs, incident tickets and automated reports, with 70% of enterprise service teams using dashboards for SLA compliance; fleet telematics and route optimization cut fuel and maintenance costs by up to 15% and improve on‑time arrivals; remote monitoring centers reduce unplanned downtime by up to 30% while overseeing plants and networks; secure data sharing increases transparency and client trust across operations.
- dashboards: KPI tracking, ticketing, reporting
- telematics: route optimization, 15% cost savings
- remote monitoring: -30% downtime
- data sharing: transparency and trust
Decentralized depots and logistics hubs
Decentralized depots—local transfer stations, MRFs, water plants and maintenance bases—place assets near service areas, cutting route miles by up to 30% and CO2 emissions by ~20%, with operating cost savings of 10–15%. Standardized SOPs (ISO 14001-aligned) deliver consistent quality across sites and enable rapid mobilization for seasonal or emergency needs within 24–48 hours.
- Route reduction: up to 30%
- Emissions cut: ~20%
- Cost savings: 10–15%
- Mobilization: 24–48 hrs
Depots cut route miles up to 30%, reducing CO2 ~20% and fleet costs ~15%
Place: FCC operates in 30+ countries with centralized hubs in Europe/Latin America; primary sales via municipal contracts/PPPs (10–30 yr) and direct key-account teams (3–10 yr). Decentralized depots cut route miles up to 30% and CO2 ~20%; dashboards used by 70% of enterprise clients; telematics save ~15% fleet costs.
| Metric | Value |
|---|---|
| Countries | 30+ |
| PPP length | 10–30 yrs |
| Route reduction | ≤30% |
| CO2 cut | ~20% |
What You Preview Is What You Download
FCC 4P's Marketing Mix Analysis
The preview shown here is the actual FCC 4P's Marketing Mix Analysis you’ll receive instantly after purchase—no surprises. This is the full, editable document ready for immediate use. You’re viewing the exact final version included with your order.
Original: $10.00
-65%$10.00
$3.50Description
Built for Strategy. Ready in Minutes.
Discover how FCC’s product positioning, pricing architecture, distribution channels, and promotion tactics combine to drive market performance. This concise preview highlights key strengths and gaps—grab the full 4Ps Marketing Mix Analysis for a deep, editable report. Save time with ready-made slides and actionable recommendations. Purchase now to apply FCC’s strategies to your plans.
Product
Integrated waste management services
Integrated waste management services cover municipal and industrial collection, sorting, recycling and energy-from-waste, aligning with circularity goals and landfill diversion. Modular service design tailors offerings by city size and waste stream, supporting regulatory compliance. Real-time monitoring enhances service quality and transparency; the World Bank projects global municipal solid waste will reach 3.4 billion tonnes by 2050, underscoring scale and demand.
Water treatment and management
FCC offers end-to-end drinking water, wastewater, desalination and network O&M services with a focus on water quality, non-revenue water reduction and climate resilience; global desalination capacity is ~100 million m3/day. Smart metering can cut NRW 20–30% and SCADA reduces O&M and energy costs ~15–25%, improving customer outcomes. Projects range from design-build to 20–30 year operation contracts; desalination costs typically $0.5–1.5/m3.
Infrastructure construction and engineering
Delivery of transport, civil works and urban infrastructure with EPC capabilities leverages BIM and lean construction for complex, large-scale projects, targeting improved schedule reliability and lifecycle cost control. The construction sector accounts for about 13% of global GDP and buildings plus construction drive roughly 37% of energy-related CO2 emissions, underpinning the focus on safety and sustainability. With urbanization expected to reach 68% by 2050, integration with environmental services enables city-scale, climate-resilient solutions.
Real estate and urban development
Real estate and urban development focuses on sustainable residential and mixed-use assets tied to urban regeneration, integrating green building standards and energy-efficient design to reduce the sector's impact; buildings and construction account for about 37% of global CO2 emissions (IEA 2023). Green-certified assets show rent/sales premiums typically in the 5–12% range (CBRE/GRESB studies). Portfolio management balances development, sales and rental income while leveraging infrastructure synergies to boost placemaking value.
- 37% of global CO2 emissions from buildings and construction (IEA 2023)
- 5–12% rent/sales premium for green-certified assets (CBRE/GRESB)
- Sustainable, energy-efficient designs aligned with urban regeneration
- Portfolio balance: development, sales and rental income
- Infrastructure synergies enhance placemaking and demand
Operations, maintenance, and smart-city solutions
O&M for utilities, public spaces and facilities uses IoT-enabled asset management to monitor assets in real time across concession portfolios.
Predictive maintenance cuts unplanned downtime by up to 70% and maintenance costs by up to 30%, improving capex-to-opex ratios for municipal clients.
Interactive dashboards deliver KPIs (uptime, MTTR, energy use) and SLAs (eg 99.9% critical-asset availability) for measurable outcomes.
- IoT asset tracking
- Predictive alerts
- Dashboard KPIs
- SLA-driven reporting
City suite: 3.4bn t MSW by 2050; desal 100M m3/day; buildings 37% CO2
FCC product suite bundles integrated waste, water, transport, real estate and O&M with modular contracts, smart IoT and circularity to serve city-scale needs; MSW projected 3.4bn t by 2050 (World Bank). Desalination ~100M m3/day; costs $0.5–1.5/m3. Buildings drive 37% CO2 (IEA 2023). Predictive maintenance cuts downtime up to 70% and maintenance costs ~30%.
| Service | Metric | Impact |
|---|---|---|
| Waste | 3.4bn t by 2050 | Scale, landfill diversion |
| Water | 100M m3/day | NRW -20–30% |
| Construction | 37% CO2 | Sustainable design premium |
| O&M | -70% downtime | Lower opex |
What is included in the product
Detailed Word Document
Delivers a company-specific deep dive into FCC’s Product, Price, Place, and Promotion strategies using real brand practices and competitive context to ground recommendations; ideal for managers, consultants, and marketers needing a complete, ready-to-present breakdown. Clean, editable layout supports benchmarking, market-entry planning, and strategy audits with clear examples, positioning, and actionable implications.
Customizable Excel Spreadsheet
Condenses the FCC 4P's into a concise, presentation-ready snapshot that relieves briefing overload and speeds alignment, easily customized for decks, meetings, or side-by-side brand comparisons.
Place
Global multi-regional presence
FCC's multi-regional footprint spans Europe, Latin America, the Middle East and select North America/Asia markets, operating in over 30 countries to capture diversified project flows. Local subsidiaries tailor services to regulatory and cultural contexts, while central expertise hubs in Europe and Latin America coordinate complex bids and execution. Geographic and segment diversification reduces concentration risk and smooths revenue volatility across cycles.
Public-private partnerships and tenders
Primary route to market via municipal contracts, concessions and PPP frameworks, with typical PPP concession lengths of 10–30 years ensuring service continuity and predictable, indexed revenues. Dedicated bid teams handle RFPs, compliance and prequalification, managing performance bonds often in the 5–10% range of contract value. Strong references materially boost competitiveness in tenders and improve win prospects.
Direct municipal and industrial client channels
Direct sales target cities, utilities and large industrial clients through key account managers who maintain multi-year relationships (typically 3–10 years). Tailored SLAs specify response times from 2 hours for critical incidents to 24 hours for routine issues. Dedicated onsite teams enable rapid issue resolution, supporting long-term contracts and predictable revenue streams.
Digital portals and service control centers
Client dashboards aggregate KPIs, incident tickets and automated reports, with 70% of enterprise service teams using dashboards for SLA compliance; fleet telematics and route optimization cut fuel and maintenance costs by up to 15% and improve on‑time arrivals; remote monitoring centers reduce unplanned downtime by up to 30% while overseeing plants and networks; secure data sharing increases transparency and client trust across operations.
- dashboards: KPI tracking, ticketing, reporting
- telematics: route optimization, 15% cost savings
- remote monitoring: -30% downtime
- data sharing: transparency and trust
Decentralized depots and logistics hubs
Decentralized depots—local transfer stations, MRFs, water plants and maintenance bases—place assets near service areas, cutting route miles by up to 30% and CO2 emissions by ~20%, with operating cost savings of 10–15%. Standardized SOPs (ISO 14001-aligned) deliver consistent quality across sites and enable rapid mobilization for seasonal or emergency needs within 24–48 hours.
- Route reduction: up to 30%
- Emissions cut: ~20%
- Cost savings: 10–15%
- Mobilization: 24–48 hrs
Depots cut route miles up to 30%, reducing CO2 ~20% and fleet costs ~15%
Place: FCC operates in 30+ countries with centralized hubs in Europe/Latin America; primary sales via municipal contracts/PPPs (10–30 yr) and direct key-account teams (3–10 yr). Decentralized depots cut route miles up to 30% and CO2 ~20%; dashboards used by 70% of enterprise clients; telematics save ~15% fleet costs.
| Metric | Value |
|---|---|
| Countries | 30+ |
| PPP length | 10–30 yrs |
| Route reduction | ≤30% |
| CO2 cut | ~20% |
What You Preview Is What You Download
FCC 4P's Marketing Mix Analysis
The preview shown here is the actual FCC 4P's Marketing Mix Analysis you’ll receive instantly after purchase—no surprises. This is the full, editable document ready for immediate use. You’re viewing the exact final version included with your order.











