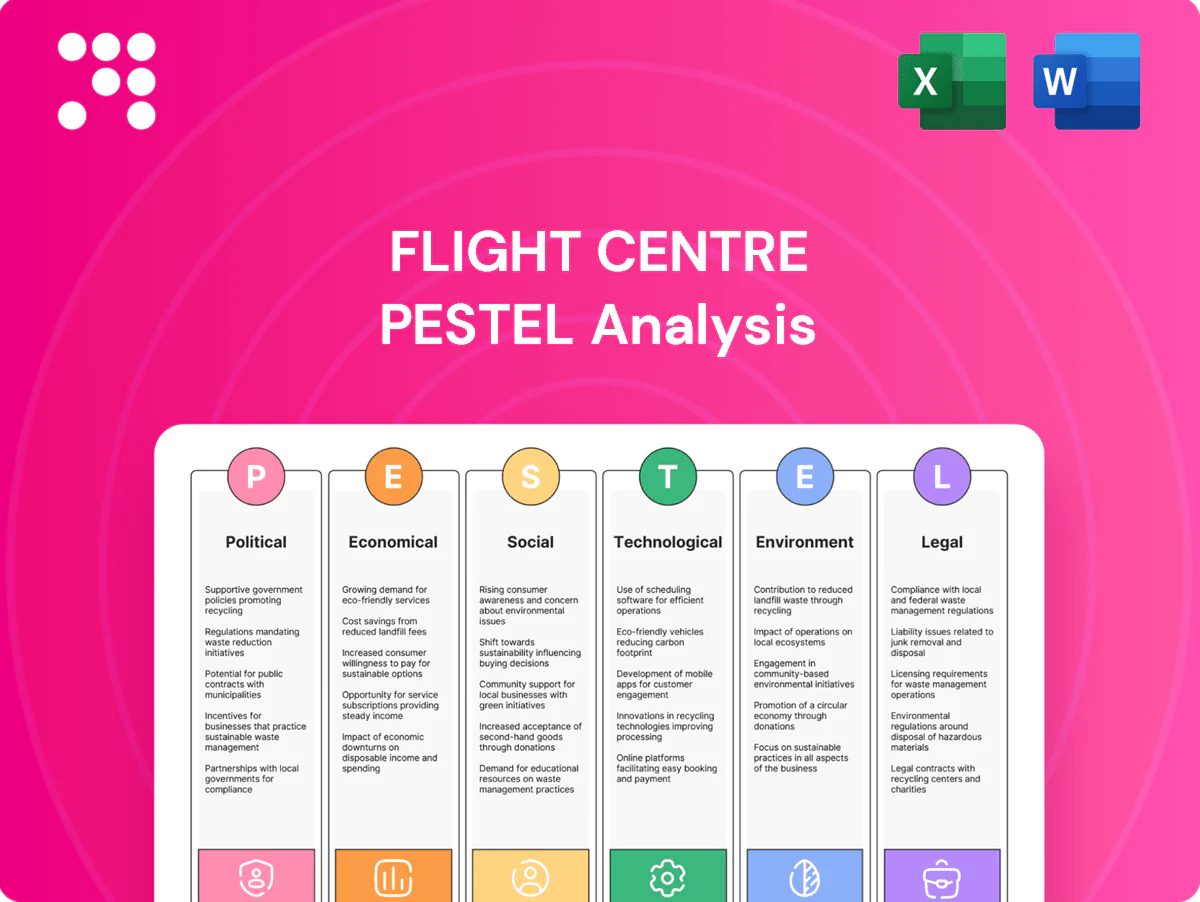
Flight Centre PESTLE Analysis

Plan Smarter. Present Sharper. Compete Stronger.
Our PESTLE Analysis of Flight Centre reveals how political shifts, economic volatility, social trends, and tech disruption are reshaping its market position, with practical insights on regulatory and environmental risks. Ideal for investors and strategists, this ready-to-use report accelerates decision-making. Purchase the full analysis to access the complete, editable deep-dive and actionable recommendations.
Political factors

Border controls and visa policies
Government entry rules, health mandates and visa regimes directly shape demand and itineraries—UNWTO reports 1.4 billion international arrivals in 2023, underscoring high exposure to border shifts. Sudden policy changes trigger cancellation and rebooking surges that strain operations. Flight Centre needs real-time advisories and flexible products to adapt, while strong consular and supplier ties speed client solutions.
Geopolitical tensions and security
Geopolitical conflicts, terrorism and sanctions continue to reshape air corridors and insurance costs, with IATA reporting passenger traffic recovery to about 92–95% of 2019 levels by 2024, intensifying route restrictions. Corporate duty-of-care raises routing and accommodation costs and choices. Flight Centre must deploy robust risk intelligence and alternative routing capabilities, while regional diversification cushions localized shocks.

Aviation regulation and bilateral agreements
Open skies, traffic rights and slot allocations directly shape availability and pricing; for example Heathrow currently caps annual movements at about 480,000, constraining supply and fares on key routes. Changes in airport charges and ATC policies cascade into customer costs, raising retail airfares and ancillary fees. Flight Centre gains competitive edge by monitoring carrier capacity plans and alliance shifts and by negotiating with airlines to secure inventory and favorable fares.

Government travel advisories and subsidies
Official government travel advisories strongly sway leisure sentiment and corporate approvals; UNWTO reported 2023 international arrivals reached about 84% of 2019 levels, with 2024 forecasts pointing to full recovery, making safety messaging pivotal for bookings. Tourism incentives and airline support programs (route subsidies) can rapidly stimulate demand or restore capacity in target markets, so Flight Centre can steer marketing to subsidized corridors and perceived safe destinations to capture rebound traffic.
- Advisories influence corporate travel policies
- Subsidies revive route capacity
- Targeted marketing boosts conversion on subsidized corridors
- Partnerships with tourism boards increase campaign ROI
Taxation and fiscal policy
Air passenger duties (eg UK APD, lowest band from £13) plus GST/VAT (Australia GST 10%) and local service taxes raise total trip cost and shift demand; FY24-facing budget moves have already shifted price elasticity in leisure segments. Flight Centre must optimise fee displays and bundling to keep conversion and use timed promotions to offset visible tax-driven hikes.
- APD: affects ticket pricing and demand
- GST 10%: applies to many Australian service fees
- Transparent fees and timing promos mitigate elasticity shocks
Visa, tax and airport caps drive travel volatility as arrivals hit 1.4bn and traffic ~92–95%
Government visa, health and advisory shifts drive demand volatility—UNWTO 1.4bn arrivals in 2023 and IATA showing ~92–95% of 2019 traffic in 2024 highlight exposure. Geopolitical risks and sanctions reroute traffic, raise insurance and duty‑of‑care costs; Heathrow caps ~480,000 movements tighten supply. Tax changes (UK APD lowest band £13; Australia GST 10%) alter price elasticity; subsidies and route support rapidly change capacity.
| Factor | Metric/2024–25 |
|---|---|
| Arrivals recovery | UNWTO 1.4bn (2023); IATA ~92–95% of 2019 (2024) |
| Airport cap | Heathrow ~480,000 annual movements |
| Taxes | UK APD from £13; Australia GST 10% |
What is included in the product
 Detailed Word Document
Explores how macro factors—Political, Economic, Social, Technological, Environmental and Legal—uniquely impact Flight Centre, with data-driven, region-specific insights, forward-looking scenarios and actionable implications for executives, investors and strategists.

 Customizable Excel Spreadsheet
A concise, visually segmented PESTLE summary of Flight Centre that highlights external risks and opportunities, easily dropped into presentations or shared across teams, and editable for region-specific notes—speeding decision-making and alignment during planning or client reports.
Economic factors

Global GDP cycles and traveler spend
Leisure and corporate travel rise and fall with global GDP cycles; IMF estimated global growth at 3.0% in 2024, supporting demand recovery. IATA reported 2023 RPKs reached about 102.8% of 2019 levels, yet downturns compress discretionary spend and trip frequency. Flight Centre can pivot to value products and closer-to-home trips during slowdowns. In upswings, premium cabins and ancillaries see stronger take-up.
Exchange rates and cross-border pricing
Currency volatility—highlighted by FX markets with daily turnover of about 7.5 trillion USD (BIS triennial survey benchmark)—affects outbound affordability and supplier settlement costs for ASX-listed Flight Centre (FLT), especially as 2024 corporate travel rebounded to near pre‑pandemic levels per IATA. Hedging and multi‑currency pricing help stabilize margins, while Flight Centre’s global contracting lets it arbitrage regional rate advantages. Transparent FX policies strengthen trust with corporate accounts and reduce pricing disputes.

Airfare and hotel pricing dynamics
Capacity constraints, fuel surcharges (jet fuel can represent roughly 20–30% of airline operating costs) and yield management cause frequent fare volatility; event-driven spikes (sporting/conference hubs) force early procurement and block space to secure margins. Flight Centre, with over 3,000 retail outlets across 23 countries, negotiates private fares and bulk rates. Dynamic packaging lets Flight Centre reprice or hedge hotels/flights separately to protect margin when one component surges.

Corporate travel budgets and policies
Enterprise cost controls increasingly dictate cabin class, advance-purchase windows and trip approvals, shifting demand toward lower-yield inventory and earlier bookings; TMC value now depends on demonstrable savings, policy compliance and granular reporting. Flight Centre can grow wallet share by optimizing programs and benchmarking peers, while ROI-focused narratives justify travel as a growth lever rather than a pure cost.
- Enterprise controls: shape fare mix and lead time
- TMC value: savings + compliance + reporting
- Flight Centre play: program optimization, benchmarking
- Messaging: ROI sustains travel investment
Inflation and interest rate environment
Visa, tax and airport caps drive travel volatility as arrivals hit 1.4bn and traffic ~92–95%
Global GDP ~3.0% (IMF 2024) supports travel recovery; IATA RPKs ~102.8% of 2019. FX turnover ~7.5tn USD heightens currency risk; jet fuel 20–30% of airline costs drives fare volatility. Inflation ~3–4% and mid‑single digit rates (2024–25) pressure demand; Flight Centre must hedge, optimize programs and offer tiered pricing.
| Indicator | 2024–25 |
|---|---|
| Global growth | 3.0% |
| RPKs vs 2019 | 102.8% |
| FX turnover | 7.5tn USD/day |
| Inflation | 3–4% |
Same Document Delivered
Flight Centre PESTLE Analysis
The Flight Centre PESTLE Analysis preview shown here is the exact document you’ll receive after purchase—fully formatted, professionally structured, and ready to use. This is the real file you’re buying, delivered exactly as shown with no placeholders or teasers. After checkout you’ll be able to download this same finished document instantly.

Plan Smarter. Present Sharper. Compete Stronger.
Our PESTLE Analysis of Flight Centre reveals how political shifts, economic volatility, social trends, and tech disruption are reshaping its market position, with practical insights on regulatory and environmental risks. Ideal for investors and strategists, this ready-to-use report accelerates decision-making. Purchase the full analysis to access the complete, editable deep-dive and actionable recommendations.
Political factors
Border controls and visa policies
Government entry rules, health mandates and visa regimes directly shape demand and itineraries—UNWTO reports 1.4 billion international arrivals in 2023, underscoring high exposure to border shifts. Sudden policy changes trigger cancellation and rebooking surges that strain operations. Flight Centre needs real-time advisories and flexible products to adapt, while strong consular and supplier ties speed client solutions.
Geopolitical tensions and security
Geopolitical conflicts, terrorism and sanctions continue to reshape air corridors and insurance costs, with IATA reporting passenger traffic recovery to about 92–95% of 2019 levels by 2024, intensifying route restrictions. Corporate duty-of-care raises routing and accommodation costs and choices. Flight Centre must deploy robust risk intelligence and alternative routing capabilities, while regional diversification cushions localized shocks.
Aviation regulation and bilateral agreements
Open skies, traffic rights and slot allocations directly shape availability and pricing; for example Heathrow currently caps annual movements at about 480,000, constraining supply and fares on key routes. Changes in airport charges and ATC policies cascade into customer costs, raising retail airfares and ancillary fees. Flight Centre gains competitive edge by monitoring carrier capacity plans and alliance shifts and by negotiating with airlines to secure inventory and favorable fares.
Government travel advisories and subsidies
Official government travel advisories strongly sway leisure sentiment and corporate approvals; UNWTO reported 2023 international arrivals reached about 84% of 2019 levels, with 2024 forecasts pointing to full recovery, making safety messaging pivotal for bookings. Tourism incentives and airline support programs (route subsidies) can rapidly stimulate demand or restore capacity in target markets, so Flight Centre can steer marketing to subsidized corridors and perceived safe destinations to capture rebound traffic.
- Advisories influence corporate travel policies
- Subsidies revive route capacity
- Targeted marketing boosts conversion on subsidized corridors
- Partnerships with tourism boards increase campaign ROI
Taxation and fiscal policy
Air passenger duties (eg UK APD, lowest band from £13) plus GST/VAT (Australia GST 10%) and local service taxes raise total trip cost and shift demand; FY24-facing budget moves have already shifted price elasticity in leisure segments. Flight Centre must optimise fee displays and bundling to keep conversion and use timed promotions to offset visible tax-driven hikes.
- APD: affects ticket pricing and demand
- GST 10%: applies to many Australian service fees
- Transparent fees and timing promos mitigate elasticity shocks
Visa, tax and airport caps drive travel volatility as arrivals hit 1.4bn and traffic ~92–95%
Government visa, health and advisory shifts drive demand volatility—UNWTO 1.4bn arrivals in 2023 and IATA showing ~92–95% of 2019 traffic in 2024 highlight exposure. Geopolitical risks and sanctions reroute traffic, raise insurance and duty‑of‑care costs; Heathrow caps ~480,000 movements tighten supply. Tax changes (UK APD lowest band £13; Australia GST 10%) alter price elasticity; subsidies and route support rapidly change capacity.
| Factor | Metric/2024–25 |
|---|---|
| Arrivals recovery | UNWTO 1.4bn (2023); IATA ~92–95% of 2019 (2024) |
| Airport cap | Heathrow ~480,000 annual movements |
| Taxes | UK APD from £13; Australia GST 10% |
What is included in the product
Detailed Word Document
Explores how macro factors—Political, Economic, Social, Technological, Environmental and Legal—uniquely impact Flight Centre, with data-driven, region-specific insights, forward-looking scenarios and actionable implications for executives, investors and strategists.
Customizable Excel Spreadsheet
A concise, visually segmented PESTLE summary of Flight Centre that highlights external risks and opportunities, easily dropped into presentations or shared across teams, and editable for region-specific notes—speeding decision-making and alignment during planning or client reports.
Economic factors
Global GDP cycles and traveler spend
Leisure and corporate travel rise and fall with global GDP cycles; IMF estimated global growth at 3.0% in 2024, supporting demand recovery. IATA reported 2023 RPKs reached about 102.8% of 2019 levels, yet downturns compress discretionary spend and trip frequency. Flight Centre can pivot to value products and closer-to-home trips during slowdowns. In upswings, premium cabins and ancillaries see stronger take-up.
Exchange rates and cross-border pricing
Currency volatility—highlighted by FX markets with daily turnover of about 7.5 trillion USD (BIS triennial survey benchmark)—affects outbound affordability and supplier settlement costs for ASX-listed Flight Centre (FLT), especially as 2024 corporate travel rebounded to near pre‑pandemic levels per IATA. Hedging and multi‑currency pricing help stabilize margins, while Flight Centre’s global contracting lets it arbitrage regional rate advantages. Transparent FX policies strengthen trust with corporate accounts and reduce pricing disputes.
Airfare and hotel pricing dynamics
Capacity constraints, fuel surcharges (jet fuel can represent roughly 20–30% of airline operating costs) and yield management cause frequent fare volatility; event-driven spikes (sporting/conference hubs) force early procurement and block space to secure margins. Flight Centre, with over 3,000 retail outlets across 23 countries, negotiates private fares and bulk rates. Dynamic packaging lets Flight Centre reprice or hedge hotels/flights separately to protect margin when one component surges.
Corporate travel budgets and policies
Enterprise cost controls increasingly dictate cabin class, advance-purchase windows and trip approvals, shifting demand toward lower-yield inventory and earlier bookings; TMC value now depends on demonstrable savings, policy compliance and granular reporting. Flight Centre can grow wallet share by optimizing programs and benchmarking peers, while ROI-focused narratives justify travel as a growth lever rather than a pure cost.
- Enterprise controls: shape fare mix and lead time
- TMC value: savings + compliance + reporting
- Flight Centre play: program optimization, benchmarking
- Messaging: ROI sustains travel investment
Inflation and interest rate environment
Visa, tax and airport caps drive travel volatility as arrivals hit 1.4bn and traffic ~92–95%
Global GDP ~3.0% (IMF 2024) supports travel recovery; IATA RPKs ~102.8% of 2019. FX turnover ~7.5tn USD heightens currency risk; jet fuel 20–30% of airline costs drives fare volatility. Inflation ~3–4% and mid‑single digit rates (2024–25) pressure demand; Flight Centre must hedge, optimize programs and offer tiered pricing.
| Indicator | 2024–25 |
|---|---|
| Global growth | 3.0% |
| RPKs vs 2019 | 102.8% |
| FX turnover | 7.5tn USD/day |
| Inflation | 3–4% |
Same Document Delivered
Flight Centre PESTLE Analysis
The Flight Centre PESTLE Analysis preview shown here is the exact document you’ll receive after purchase—fully formatted, professionally structured, and ready to use. This is the real file you’re buying, delivered exactly as shown with no placeholders or teasers. After checkout you’ll be able to download this same finished document instantly.
Original: $10.00
-65%$10.00
$3.50Description
Plan Smarter. Present Sharper. Compete Stronger.
Our PESTLE Analysis of Flight Centre reveals how political shifts, economic volatility, social trends, and tech disruption are reshaping its market position, with practical insights on regulatory and environmental risks. Ideal for investors and strategists, this ready-to-use report accelerates decision-making. Purchase the full analysis to access the complete, editable deep-dive and actionable recommendations.
Political factors
Border controls and visa policies
Government entry rules, health mandates and visa regimes directly shape demand and itineraries—UNWTO reports 1.4 billion international arrivals in 2023, underscoring high exposure to border shifts. Sudden policy changes trigger cancellation and rebooking surges that strain operations. Flight Centre needs real-time advisories and flexible products to adapt, while strong consular and supplier ties speed client solutions.
Geopolitical tensions and security
Geopolitical conflicts, terrorism and sanctions continue to reshape air corridors and insurance costs, with IATA reporting passenger traffic recovery to about 92–95% of 2019 levels by 2024, intensifying route restrictions. Corporate duty-of-care raises routing and accommodation costs and choices. Flight Centre must deploy robust risk intelligence and alternative routing capabilities, while regional diversification cushions localized shocks.
Aviation regulation and bilateral agreements
Open skies, traffic rights and slot allocations directly shape availability and pricing; for example Heathrow currently caps annual movements at about 480,000, constraining supply and fares on key routes. Changes in airport charges and ATC policies cascade into customer costs, raising retail airfares and ancillary fees. Flight Centre gains competitive edge by monitoring carrier capacity plans and alliance shifts and by negotiating with airlines to secure inventory and favorable fares.
Government travel advisories and subsidies
Official government travel advisories strongly sway leisure sentiment and corporate approvals; UNWTO reported 2023 international arrivals reached about 84% of 2019 levels, with 2024 forecasts pointing to full recovery, making safety messaging pivotal for bookings. Tourism incentives and airline support programs (route subsidies) can rapidly stimulate demand or restore capacity in target markets, so Flight Centre can steer marketing to subsidized corridors and perceived safe destinations to capture rebound traffic.
- Advisories influence corporate travel policies
- Subsidies revive route capacity
- Targeted marketing boosts conversion on subsidized corridors
- Partnerships with tourism boards increase campaign ROI
Taxation and fiscal policy
Air passenger duties (eg UK APD, lowest band from £13) plus GST/VAT (Australia GST 10%) and local service taxes raise total trip cost and shift demand; FY24-facing budget moves have already shifted price elasticity in leisure segments. Flight Centre must optimise fee displays and bundling to keep conversion and use timed promotions to offset visible tax-driven hikes.
- APD: affects ticket pricing and demand
- GST 10%: applies to many Australian service fees
- Transparent fees and timing promos mitigate elasticity shocks
Visa, tax and airport caps drive travel volatility as arrivals hit 1.4bn and traffic ~92–95%
Government visa, health and advisory shifts drive demand volatility—UNWTO 1.4bn arrivals in 2023 and IATA showing ~92–95% of 2019 traffic in 2024 highlight exposure. Geopolitical risks and sanctions reroute traffic, raise insurance and duty‑of‑care costs; Heathrow caps ~480,000 movements tighten supply. Tax changes (UK APD lowest band £13; Australia GST 10%) alter price elasticity; subsidies and route support rapidly change capacity.
| Factor | Metric/2024–25 |
|---|---|
| Arrivals recovery | UNWTO 1.4bn (2023); IATA ~92–95% of 2019 (2024) |
| Airport cap | Heathrow ~480,000 annual movements |
| Taxes | UK APD from £13; Australia GST 10% |
What is included in the product
Detailed Word Document
Explores how macro factors—Political, Economic, Social, Technological, Environmental and Legal—uniquely impact Flight Centre, with data-driven, region-specific insights, forward-looking scenarios and actionable implications for executives, investors and strategists.
Customizable Excel Spreadsheet
A concise, visually segmented PESTLE summary of Flight Centre that highlights external risks and opportunities, easily dropped into presentations or shared across teams, and editable for region-specific notes—speeding decision-making and alignment during planning or client reports.
Economic factors
Global GDP cycles and traveler spend
Leisure and corporate travel rise and fall with global GDP cycles; IMF estimated global growth at 3.0% in 2024, supporting demand recovery. IATA reported 2023 RPKs reached about 102.8% of 2019 levels, yet downturns compress discretionary spend and trip frequency. Flight Centre can pivot to value products and closer-to-home trips during slowdowns. In upswings, premium cabins and ancillaries see stronger take-up.
Exchange rates and cross-border pricing
Currency volatility—highlighted by FX markets with daily turnover of about 7.5 trillion USD (BIS triennial survey benchmark)—affects outbound affordability and supplier settlement costs for ASX-listed Flight Centre (FLT), especially as 2024 corporate travel rebounded to near pre‑pandemic levels per IATA. Hedging and multi‑currency pricing help stabilize margins, while Flight Centre’s global contracting lets it arbitrage regional rate advantages. Transparent FX policies strengthen trust with corporate accounts and reduce pricing disputes.
Airfare and hotel pricing dynamics
Capacity constraints, fuel surcharges (jet fuel can represent roughly 20–30% of airline operating costs) and yield management cause frequent fare volatility; event-driven spikes (sporting/conference hubs) force early procurement and block space to secure margins. Flight Centre, with over 3,000 retail outlets across 23 countries, negotiates private fares and bulk rates. Dynamic packaging lets Flight Centre reprice or hedge hotels/flights separately to protect margin when one component surges.
Corporate travel budgets and policies
Enterprise cost controls increasingly dictate cabin class, advance-purchase windows and trip approvals, shifting demand toward lower-yield inventory and earlier bookings; TMC value now depends on demonstrable savings, policy compliance and granular reporting. Flight Centre can grow wallet share by optimizing programs and benchmarking peers, while ROI-focused narratives justify travel as a growth lever rather than a pure cost.
- Enterprise controls: shape fare mix and lead time
- TMC value: savings + compliance + reporting
- Flight Centre play: program optimization, benchmarking
- Messaging: ROI sustains travel investment
Inflation and interest rate environment
Visa, tax and airport caps drive travel volatility as arrivals hit 1.4bn and traffic ~92–95%
Global GDP ~3.0% (IMF 2024) supports travel recovery; IATA RPKs ~102.8% of 2019. FX turnover ~7.5tn USD heightens currency risk; jet fuel 20–30% of airline costs drives fare volatility. Inflation ~3–4% and mid‑single digit rates (2024–25) pressure demand; Flight Centre must hedge, optimize programs and offer tiered pricing.
| Indicator | 2024–25 |
|---|---|
| Global growth | 3.0% |
| RPKs vs 2019 | 102.8% |
| FX turnover | 7.5tn USD/day |
| Inflation | 3–4% |
Same Document Delivered
Flight Centre PESTLE Analysis
The Flight Centre PESTLE Analysis preview shown here is the exact document you’ll receive after purchase—fully formatted, professionally structured, and ready to use. This is the real file you’re buying, delivered exactly as shown with no placeholders or teasers. After checkout you’ll be able to download this same finished document instantly.











