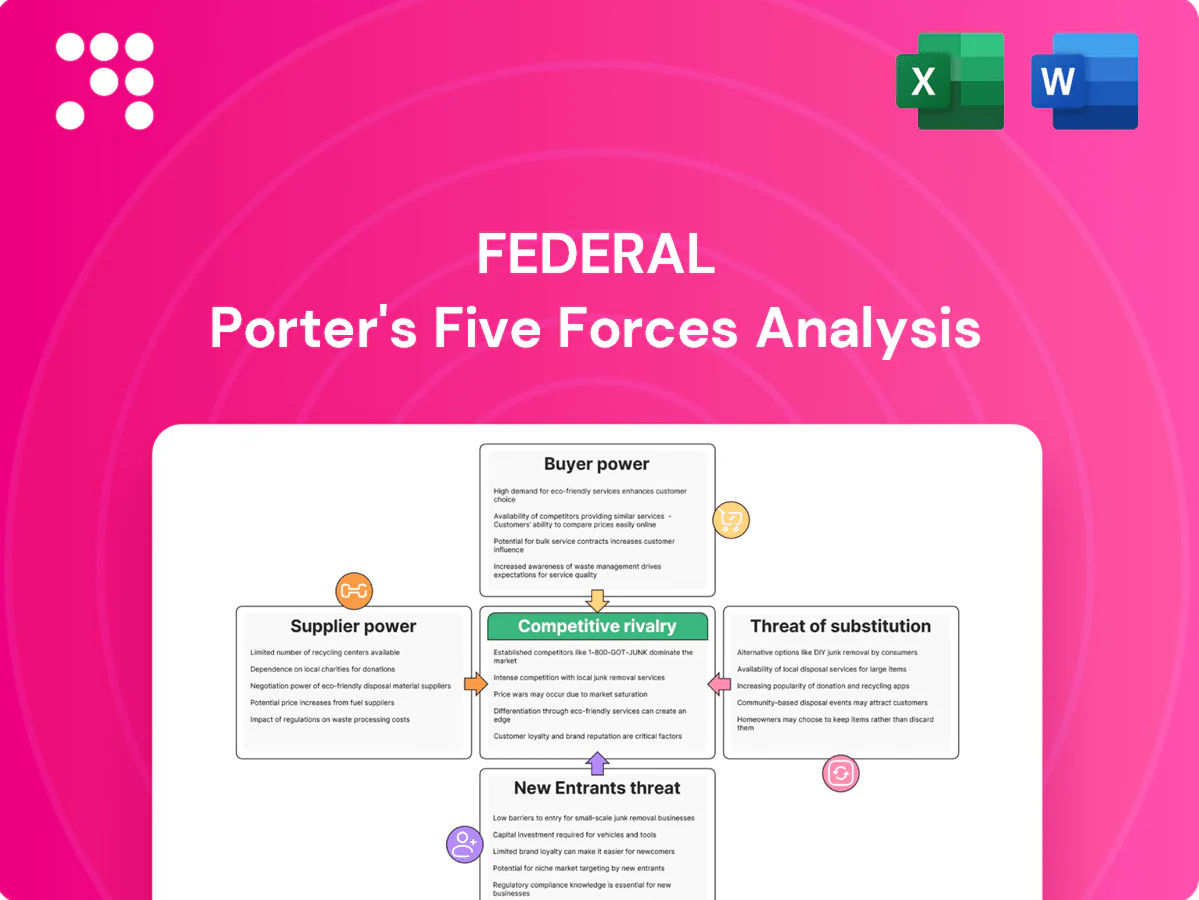
Federal Porter's Five Forces Analysis

Don't Miss the Bigger Picture
Federal’s Porter’s Five Forces snapshot highlights competitive rivalry, supplier and buyer leverage, and the threats of new entrants and substitutes—key drivers of profitability and strategic risk. This brief view surfaces core pressures but omits force-by-force ratings and tactical implications. Unlock the full Porter’s Five Forces Analysis to explore Federal’s competitive dynamics, market pressures, and strategic advantages in detail.
Suppliers Bargaining Power

Entitlements and zoning gatekeepers
Local governments control zoning, density and permits, making them the pivotal suppliers of development rights; in 2024 entitlements and community review processes continued to drive timelines. In affluent coastal markets community pushback and protracted reviews frequently delay projects and raise costs. Federal Realty leverages a long track record and proactive community engagement to mitigate risk, but timelines and scope remain largely supplier-driven, elevating supplier power over redevelopment pacing.
Construction contractors and materials
Skilled contractors and specialty trades concentrate in top coastal markets, with contractor backlogs commonly 9–12 months in peak cycles, tightening capacity and raising supplier leverage. Volatility in materials—steel and concrete—remains elevated after 2020–21 spikes (steel rose ~40%), shifting pricing power to suppliers during upswings. Long-term frameworks and value engineering can partially offset increases, but redevelopment-heavy portfolios still face episodic cost pressure.

Utilities and municipal services
Power, water, waste and broadband are typically local monopolies with limited switching; 2024 U.S. commercial electricity averaged about 16¢/kWh (EIA) and connection/upgrade fees for commercial sites often range from $10k–$250k, directly raising operating costs and affecting tenant experience. Costs can often be passed via CAM (commonly 80–100% recoverable), but timing and capex are set by utilities, giving them moderate supplier power with little negotiation room.

Capital providers and interest rates
Banks, bond investors and mortgage lenders are the primary capital suppliers to a REIT; 2024 saw the 10-year Treasury around 4.3%, 30-year mortgage rates near 7.0% and BBB spreads ~150 bps, all of which materially shift project viability, valuation and refinancing terms. Strong investment-grade balance sheets mitigate risk but macro rate cycles and credit spreads overwhelmingly drive supplier leverage; supplier power is cyclical yet material.
- Capital sources: banks, bond investors, mortgage lenders
- Key 2024 rates: 10y 4.3%, 30y mortgage ~7.0%
- Credit spreads: BBB ~150 bps
- Impact: valuation, refinancing, project feasibility
Technology and property ops vendors
Technology and property ops vendors for access control, POS data, parking and analytics directly shape tenant and shopper experience; integration costs and API lock‑ins create switching friction. Federal Realty can multi‑source, but best‑in‑class tools remain concentrated, and in 2024 the company continued targeted tech investments to enhance omnichannel data. Supplier power is moderate given differentiation and stickiness.
- Access control and parking vendors: high integration friction
- POS and analytics: concentrated best‑in‑class providers
- Multi‑sourcing possible but costly
- Overall supplier power: moderate due to differentiation and stickiness
Suppliers squeeze REITs: 9–12m backlogs, financing 4.3%
Suppliers—local governments, contractors, utilities, capital markets and tech vendors—exert material power in 2024: entitlements prolong timelines, contractor backlogs 9–12 months, U.S. commercial electricity ~16¢/kWh and 10y Treasury ~4.3% (30y mortgage ~7.0%), pushing costs/financing risk onto REITs despite mitigation levers.
| Supplier | 2024 metric | Impact |
|---|---|---|
| Local govts | Entitlement delays, community review | High timeline/scope control |
| Contractors | Backlogs 9–12m | Higher capex, schedule risk |
| Utilities | Electric ~16¢/kWh | Operating cost pressure |
| Capital | 10y 4.3%, 30y ~7.0% | Valuation/refi sensitivity |
| Tech vendors | High integration stickiness | Moderate switching costs |
What is included in the product
 Detailed Word Document
Tailored Porter's Five Forces analysis for Federal that uncovers key drivers of competition, buyer and supplier influence, entry barriers and substitute threats, highlighting disruptive risks and strategic levers to protect market share and profitability.

 Customizable Excel Spreadsheet
Federal-focused Porter's Five Forces distilled into a single, policy-aware sheet—quickly identify regulatory, procurement and compliance pressures to guide strategic moves and stakeholder briefings.
Customers Bargaining Power

Anchor tenants’ leverage
Grocers, cinemas and marquee retailers drive footfall and shape co-tenancy, tenant-improvement and rent concessions, giving them strong negotiation leverage—especially during repositionings. Federal Realty’s high-traffic, coastal-dominant portfolio (occupancy consistently above 95%) mitigates some pressure by offering superior sales potential and rent resiliency. Net result: anchors exert high but situational bargaining power.
Fragmented small-shop tenants
Local restaurants, boutiques and service tenants are numerous and uncoordinated, giving limited collective leverage; national 2024 neighborhood retail vacancy ran about 6% while affluent nodes often show scarcity under 4%. Yet many tenants require tenant improvements and flexible lease terms—2024 TI allowances for small shops averaged roughly $75–125 per sq ft—nudging landlords to concede; overall buyer power is low to moderate.

Mixed-use residential and office occupants
Mixed-use residential and office occupants diversify revenue, with multifamily occupancy near 95% in 2024 stabilizing foot traffic while urban office vacancy remained elevated (about 18–20% per CBRE 2024). Class A locations show lower churn and command premium rents, but hybrid work and higher amenity expectations compress lease terms. Large office tenants secure bigger TI and allowance concessions; buyer power varies with cycle, moderate on average.

Omnichannel retailers’ demands
Omnichannel tenants now demand curbside, BOPIS, logistics bays, and data-sharing, raising site-design and capex needs; a 2024 ICSC survey found about 60% of retailers require BOPIS/curbside options, shifting spend toward docks and tech. Brands supplying traffic data or prestige often seek rent or CAM offsets, while Federal Realty’s curated merchandising helps redistribute tenant concessions; buyer power strengthens where proven sales productivity exists.
Alternative location options
Competing Class A centers and street retail in coastal metros offer credible alternatives; US office vacancy averaged about 17.5% in 2024, yet Class A assets sustained a roughly 10–15% rent premium. Tight new supply limits choices, moderating overall buyer power, while flight-to-quality heightens competition for top assets. Concessions expand in downturns; buyer power is cyclical and asset-specific.
- Coastal alternatives: NYC, SF, Miami strong
- Tight supply vs. 17.5% 2024 vacancy
- Class A rent premium ~10–15%
Anchors wield leverage as high occupancy masks TI, co-tenancy and omnichannel capex demands
Grocers/anchors hold high situational leverage despite Federal Realty's 95%+ occupancy and coastal demand; anchors drive co-tenancy, TI and rent concessions. Local tenants' collective power is low–moderate with national neighborhood retail vacancy ~6% (2024) and TI avg $75–125/sq ft. Omnichannel demands (60% of retailers, 2024) raise capex; buyer power is cyclical and asset-specific.
| Metric | 2024 Value |
|---|---|
| Occupancy | 95%+ |
| Neighborhood vacancy | ~6% |
| TI allowance | $75–125/sq ft |
| BOPIS demand | 60% |
| Office vacancy | 17.5% |
| Class A rent premium | 10–15% |
Same Document Delivered
Federal Porter's Five Forces Analysis
This preview shows the exact Federal Porter’s Five Forces analysis you'll receive immediately after purchase—no placeholders, no mockups. The file is fully formatted, professionally written, and ready for download and use the moment you buy. What you see is the deliverable.

Don't Miss the Bigger Picture
Federal’s Porter’s Five Forces snapshot highlights competitive rivalry, supplier and buyer leverage, and the threats of new entrants and substitutes—key drivers of profitability and strategic risk. This brief view surfaces core pressures but omits force-by-force ratings and tactical implications. Unlock the full Porter’s Five Forces Analysis to explore Federal’s competitive dynamics, market pressures, and strategic advantages in detail.
Suppliers Bargaining Power
Entitlements and zoning gatekeepers
Local governments control zoning, density and permits, making them the pivotal suppliers of development rights; in 2024 entitlements and community review processes continued to drive timelines. In affluent coastal markets community pushback and protracted reviews frequently delay projects and raise costs. Federal Realty leverages a long track record and proactive community engagement to mitigate risk, but timelines and scope remain largely supplier-driven, elevating supplier power over redevelopment pacing.
Construction contractors and materials
Skilled contractors and specialty trades concentrate in top coastal markets, with contractor backlogs commonly 9–12 months in peak cycles, tightening capacity and raising supplier leverage. Volatility in materials—steel and concrete—remains elevated after 2020–21 spikes (steel rose ~40%), shifting pricing power to suppliers during upswings. Long-term frameworks and value engineering can partially offset increases, but redevelopment-heavy portfolios still face episodic cost pressure.
Utilities and municipal services
Power, water, waste and broadband are typically local monopolies with limited switching; 2024 U.S. commercial electricity averaged about 16¢/kWh (EIA) and connection/upgrade fees for commercial sites often range from $10k–$250k, directly raising operating costs and affecting tenant experience. Costs can often be passed via CAM (commonly 80–100% recoverable), but timing and capex are set by utilities, giving them moderate supplier power with little negotiation room.
Capital providers and interest rates
Banks, bond investors and mortgage lenders are the primary capital suppliers to a REIT; 2024 saw the 10-year Treasury around 4.3%, 30-year mortgage rates near 7.0% and BBB spreads ~150 bps, all of which materially shift project viability, valuation and refinancing terms. Strong investment-grade balance sheets mitigate risk but macro rate cycles and credit spreads overwhelmingly drive supplier leverage; supplier power is cyclical yet material.
- Capital sources: banks, bond investors, mortgage lenders
- Key 2024 rates: 10y 4.3%, 30y mortgage ~7.0%
- Credit spreads: BBB ~150 bps
- Impact: valuation, refinancing, project feasibility
Technology and property ops vendors
Technology and property ops vendors for access control, POS data, parking and analytics directly shape tenant and shopper experience; integration costs and API lock‑ins create switching friction. Federal Realty can multi‑source, but best‑in‑class tools remain concentrated, and in 2024 the company continued targeted tech investments to enhance omnichannel data. Supplier power is moderate given differentiation and stickiness.
- Access control and parking vendors: high integration friction
- POS and analytics: concentrated best‑in‑class providers
- Multi‑sourcing possible but costly
- Overall supplier power: moderate due to differentiation and stickiness
Suppliers squeeze REITs: 9–12m backlogs, financing 4.3%
Suppliers—local governments, contractors, utilities, capital markets and tech vendors—exert material power in 2024: entitlements prolong timelines, contractor backlogs 9–12 months, U.S. commercial electricity ~16¢/kWh and 10y Treasury ~4.3% (30y mortgage ~7.0%), pushing costs/financing risk onto REITs despite mitigation levers.
| Supplier | 2024 metric | Impact |
|---|---|---|
| Local govts | Entitlement delays, community review | High timeline/scope control |
| Contractors | Backlogs 9–12m | Higher capex, schedule risk |
| Utilities | Electric ~16¢/kWh | Operating cost pressure |
| Capital | 10y 4.3%, 30y ~7.0% | Valuation/refi sensitivity |
| Tech vendors | High integration stickiness | Moderate switching costs |
What is included in the product
Detailed Word Document
Tailored Porter's Five Forces analysis for Federal that uncovers key drivers of competition, buyer and supplier influence, entry barriers and substitute threats, highlighting disruptive risks and strategic levers to protect market share and profitability.
Customizable Excel Spreadsheet
Federal-focused Porter's Five Forces distilled into a single, policy-aware sheet—quickly identify regulatory, procurement and compliance pressures to guide strategic moves and stakeholder briefings.
Customers Bargaining Power
Anchor tenants’ leverage
Grocers, cinemas and marquee retailers drive footfall and shape co-tenancy, tenant-improvement and rent concessions, giving them strong negotiation leverage—especially during repositionings. Federal Realty’s high-traffic, coastal-dominant portfolio (occupancy consistently above 95%) mitigates some pressure by offering superior sales potential and rent resiliency. Net result: anchors exert high but situational bargaining power.
Fragmented small-shop tenants
Local restaurants, boutiques and service tenants are numerous and uncoordinated, giving limited collective leverage; national 2024 neighborhood retail vacancy ran about 6% while affluent nodes often show scarcity under 4%. Yet many tenants require tenant improvements and flexible lease terms—2024 TI allowances for small shops averaged roughly $75–125 per sq ft—nudging landlords to concede; overall buyer power is low to moderate.
Mixed-use residential and office occupants
Mixed-use residential and office occupants diversify revenue, with multifamily occupancy near 95% in 2024 stabilizing foot traffic while urban office vacancy remained elevated (about 18–20% per CBRE 2024). Class A locations show lower churn and command premium rents, but hybrid work and higher amenity expectations compress lease terms. Large office tenants secure bigger TI and allowance concessions; buyer power varies with cycle, moderate on average.
Omnichannel retailers’ demands
Omnichannel tenants now demand curbside, BOPIS, logistics bays, and data-sharing, raising site-design and capex needs; a 2024 ICSC survey found about 60% of retailers require BOPIS/curbside options, shifting spend toward docks and tech. Brands supplying traffic data or prestige often seek rent or CAM offsets, while Federal Realty’s curated merchandising helps redistribute tenant concessions; buyer power strengthens where proven sales productivity exists.
Alternative location options
Competing Class A centers and street retail in coastal metros offer credible alternatives; US office vacancy averaged about 17.5% in 2024, yet Class A assets sustained a roughly 10–15% rent premium. Tight new supply limits choices, moderating overall buyer power, while flight-to-quality heightens competition for top assets. Concessions expand in downturns; buyer power is cyclical and asset-specific.
- Coastal alternatives: NYC, SF, Miami strong
- Tight supply vs. 17.5% 2024 vacancy
- Class A rent premium ~10–15%
Anchors wield leverage as high occupancy masks TI, co-tenancy and omnichannel capex demands
Grocers/anchors hold high situational leverage despite Federal Realty's 95%+ occupancy and coastal demand; anchors drive co-tenancy, TI and rent concessions. Local tenants' collective power is low–moderate with national neighborhood retail vacancy ~6% (2024) and TI avg $75–125/sq ft. Omnichannel demands (60% of retailers, 2024) raise capex; buyer power is cyclical and asset-specific.
| Metric | 2024 Value |
|---|---|
| Occupancy | 95%+ |
| Neighborhood vacancy | ~6% |
| TI allowance | $75–125/sq ft |
| BOPIS demand | 60% |
| Office vacancy | 17.5% |
| Class A rent premium | 10–15% |
Same Document Delivered
Federal Porter's Five Forces Analysis
This preview shows the exact Federal Porter’s Five Forces analysis you'll receive immediately after purchase—no placeholders, no mockups. The file is fully formatted, professionally written, and ready for download and use the moment you buy. What you see is the deliverable.
Original: $10.00
-65%$10.00
$3.50Description
Don't Miss the Bigger Picture
Federal’s Porter’s Five Forces snapshot highlights competitive rivalry, supplier and buyer leverage, and the threats of new entrants and substitutes—key drivers of profitability and strategic risk. This brief view surfaces core pressures but omits force-by-force ratings and tactical implications. Unlock the full Porter’s Five Forces Analysis to explore Federal’s competitive dynamics, market pressures, and strategic advantages in detail.
Suppliers Bargaining Power
Entitlements and zoning gatekeepers
Local governments control zoning, density and permits, making them the pivotal suppliers of development rights; in 2024 entitlements and community review processes continued to drive timelines. In affluent coastal markets community pushback and protracted reviews frequently delay projects and raise costs. Federal Realty leverages a long track record and proactive community engagement to mitigate risk, but timelines and scope remain largely supplier-driven, elevating supplier power over redevelopment pacing.
Construction contractors and materials
Skilled contractors and specialty trades concentrate in top coastal markets, with contractor backlogs commonly 9–12 months in peak cycles, tightening capacity and raising supplier leverage. Volatility in materials—steel and concrete—remains elevated after 2020–21 spikes (steel rose ~40%), shifting pricing power to suppliers during upswings. Long-term frameworks and value engineering can partially offset increases, but redevelopment-heavy portfolios still face episodic cost pressure.
Utilities and municipal services
Power, water, waste and broadband are typically local monopolies with limited switching; 2024 U.S. commercial electricity averaged about 16¢/kWh (EIA) and connection/upgrade fees for commercial sites often range from $10k–$250k, directly raising operating costs and affecting tenant experience. Costs can often be passed via CAM (commonly 80–100% recoverable), but timing and capex are set by utilities, giving them moderate supplier power with little negotiation room.
Capital providers and interest rates
Banks, bond investors and mortgage lenders are the primary capital suppliers to a REIT; 2024 saw the 10-year Treasury around 4.3%, 30-year mortgage rates near 7.0% and BBB spreads ~150 bps, all of which materially shift project viability, valuation and refinancing terms. Strong investment-grade balance sheets mitigate risk but macro rate cycles and credit spreads overwhelmingly drive supplier leverage; supplier power is cyclical yet material.
- Capital sources: banks, bond investors, mortgage lenders
- Key 2024 rates: 10y 4.3%, 30y mortgage ~7.0%
- Credit spreads: BBB ~150 bps
- Impact: valuation, refinancing, project feasibility
Technology and property ops vendors
Technology and property ops vendors for access control, POS data, parking and analytics directly shape tenant and shopper experience; integration costs and API lock‑ins create switching friction. Federal Realty can multi‑source, but best‑in‑class tools remain concentrated, and in 2024 the company continued targeted tech investments to enhance omnichannel data. Supplier power is moderate given differentiation and stickiness.
- Access control and parking vendors: high integration friction
- POS and analytics: concentrated best‑in‑class providers
- Multi‑sourcing possible but costly
- Overall supplier power: moderate due to differentiation and stickiness
Suppliers squeeze REITs: 9–12m backlogs, financing 4.3%
Suppliers—local governments, contractors, utilities, capital markets and tech vendors—exert material power in 2024: entitlements prolong timelines, contractor backlogs 9–12 months, U.S. commercial electricity ~16¢/kWh and 10y Treasury ~4.3% (30y mortgage ~7.0%), pushing costs/financing risk onto REITs despite mitigation levers.
| Supplier | 2024 metric | Impact |
|---|---|---|
| Local govts | Entitlement delays, community review | High timeline/scope control |
| Contractors | Backlogs 9–12m | Higher capex, schedule risk |
| Utilities | Electric ~16¢/kWh | Operating cost pressure |
| Capital | 10y 4.3%, 30y ~7.0% | Valuation/refi sensitivity |
| Tech vendors | High integration stickiness | Moderate switching costs |
What is included in the product
Detailed Word Document
Tailored Porter's Five Forces analysis for Federal that uncovers key drivers of competition, buyer and supplier influence, entry barriers and substitute threats, highlighting disruptive risks and strategic levers to protect market share and profitability.
Customizable Excel Spreadsheet
Federal-focused Porter's Five Forces distilled into a single, policy-aware sheet—quickly identify regulatory, procurement and compliance pressures to guide strategic moves and stakeholder briefings.
Customers Bargaining Power
Anchor tenants’ leverage
Grocers, cinemas and marquee retailers drive footfall and shape co-tenancy, tenant-improvement and rent concessions, giving them strong negotiation leverage—especially during repositionings. Federal Realty’s high-traffic, coastal-dominant portfolio (occupancy consistently above 95%) mitigates some pressure by offering superior sales potential and rent resiliency. Net result: anchors exert high but situational bargaining power.
Fragmented small-shop tenants
Local restaurants, boutiques and service tenants are numerous and uncoordinated, giving limited collective leverage; national 2024 neighborhood retail vacancy ran about 6% while affluent nodes often show scarcity under 4%. Yet many tenants require tenant improvements and flexible lease terms—2024 TI allowances for small shops averaged roughly $75–125 per sq ft—nudging landlords to concede; overall buyer power is low to moderate.
Mixed-use residential and office occupants
Mixed-use residential and office occupants diversify revenue, with multifamily occupancy near 95% in 2024 stabilizing foot traffic while urban office vacancy remained elevated (about 18–20% per CBRE 2024). Class A locations show lower churn and command premium rents, but hybrid work and higher amenity expectations compress lease terms. Large office tenants secure bigger TI and allowance concessions; buyer power varies with cycle, moderate on average.
Omnichannel retailers’ demands
Omnichannel tenants now demand curbside, BOPIS, logistics bays, and data-sharing, raising site-design and capex needs; a 2024 ICSC survey found about 60% of retailers require BOPIS/curbside options, shifting spend toward docks and tech. Brands supplying traffic data or prestige often seek rent or CAM offsets, while Federal Realty’s curated merchandising helps redistribute tenant concessions; buyer power strengthens where proven sales productivity exists.
Alternative location options
Competing Class A centers and street retail in coastal metros offer credible alternatives; US office vacancy averaged about 17.5% in 2024, yet Class A assets sustained a roughly 10–15% rent premium. Tight new supply limits choices, moderating overall buyer power, while flight-to-quality heightens competition for top assets. Concessions expand in downturns; buyer power is cyclical and asset-specific.
- Coastal alternatives: NYC, SF, Miami strong
- Tight supply vs. 17.5% 2024 vacancy
- Class A rent premium ~10–15%
Anchors wield leverage as high occupancy masks TI, co-tenancy and omnichannel capex demands
Grocers/anchors hold high situational leverage despite Federal Realty's 95%+ occupancy and coastal demand; anchors drive co-tenancy, TI and rent concessions. Local tenants' collective power is low–moderate with national neighborhood retail vacancy ~6% (2024) and TI avg $75–125/sq ft. Omnichannel demands (60% of retailers, 2024) raise capex; buyer power is cyclical and asset-specific.
| Metric | 2024 Value |
|---|---|
| Occupancy | 95%+ |
| Neighborhood vacancy | ~6% |
| TI allowance | $75–125/sq ft |
| BOPIS demand | 60% |
| Office vacancy | 17.5% |
| Class A rent premium | 10–15% |
Same Document Delivered
Federal Porter's Five Forces Analysis
This preview shows the exact Federal Porter’s Five Forces analysis you'll receive immediately after purchase—no placeholders, no mockups. The file is fully formatted, professionally written, and ready for download and use the moment you buy. What you see is the deliverable.











