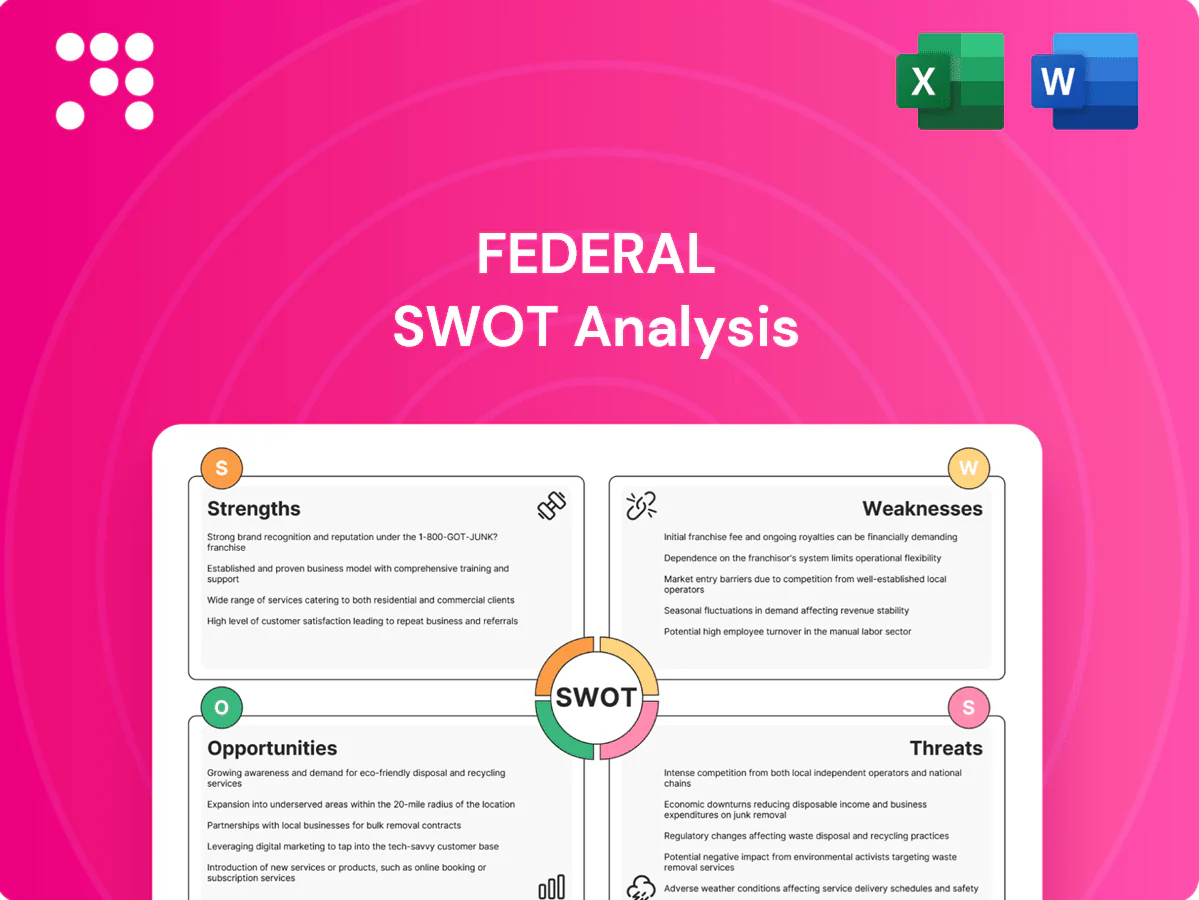
Federal SWOT Analysis

Your Strategic Toolkit Starts Here
Unpack Federal’s competitive edge, regulatory exposures, and growth levers with our concise Federal SWOT preview—then get the full analysis for a complete strategic toolkit. Purchase the comprehensive report to receive a research-backed, investor-ready Word brief and editable Excel matrix that help you plan, pitch, or invest with confidence. Don’t miss the deeper insights that drive smarter decisions.
Strengths

Premier coastal, affluent market footprint
Properties concentrated in dense, high‑income coastal submarkets (104 properties, ~26M sq ft as of 2024) deliver strong foot traffic and pricing power; markets show median household incomes >$110,000 and in‑place rents roughly 25–35% above national averages, supporting resilient demand, superior tenant productivity, higher renewal spreads and NAV/cash‑flow premiums.
Mixed-use placemaking expertise
Federal leverages mixed-use placemaking—integrating retail with residential, office and experiences—to create destination environments that lengthen dwell time and diversify revenue streams.
Its portfolio of 100+ properties and market cap ~6.5B (July 2025) drives higher leasing velocity and taps multiple demand drivers, mitigating pure-retail volatility.
This approach supports materially higher site-level economic yield versus standalone centers.

High-quality tenant roster and occupancy
A curated lineup of necessity, service, dining and national retailers supports stable rent collections, with Federal Realty reporting portfolio occupancy of about 95% as of 2024, helping drive resilient cash flow. Consistently high occupancy minimizes downtime and re-leasing risk, while a strong credit mix reduces bad debt and revenue volatility. Dominant anchors draw complementary small-shop tenants, enhancing center foot traffic and overall vitality.

Proven redevelopment and densification pipeline
Active value-add redevelopments unlock additional FAR to add residential units and modernize merchandising, driving higher NOI per square foot and superior returns relative to acquisitions in supply-constrained markets. Phased execution mitigates development risk and enables capital recycling. A consistent track record has strengthened stakeholder confidence and valuation.
- Unlocks FAR and adds housing
- Accretive vs acquisitions
- Phased risk management
- Proven track record boosts valuation
Diversified income and long-term leases
Rental income at Federal Realty is diversified across ~103 shopping centers and roughly 25 million sq ft, spreading tenant and use risk; weighted-average lease term near 8 years gives clear cash-flow visibility and embedded escalators; percentage rents and specialty leasing drove about 6% of 2024 NOI, supporting stable FFO and a 2024 AFFO payout ratio near 78%.
- Diversified footprint ~103 centers
- WALE ~8 years
- Percentage/specialty ~6% NOI (2024)
- AFFO payout ~78% (2024)
Coastal high‑income portfolio: 104 properties, 95% occ, $6.5B market cap
Concentrated in dense, high‑income coastal submarkets (104 properties, ~26M sq ft) with strong pricing power and ~95% occupancy (2024), Federal delivers resilient cash flow and NAV premiums. Mixed‑use placemaking and phased value‑add redevelopments unlock FAR and higher NOI per sq ft. WALE ~8 yrs, market cap ~6.5B (Jul 2025), AFFO payout ~78% (2024).
| Metric | Value |
|---|---|
| Properties / GLA | 104 / ~26M sq ft (2024) |
| Occupancy | ~95% (2024) |
| WALE | ~8 yrs |
| Market Cap | ~$6.5B (Jul 2025) |
| AFFO Payout | ~78% (2024) |
What is included in the product
 Detailed Word Document
Provides a concise SWOT analysis of Federal, outlining its core strengths and weaknesses and mapping external opportunities and threats to clarify strategic priorities and competitive positioning.

 Customizable Excel Spreadsheet
Provides a clear, government-focused SWOT matrix to align federal policy and agency strategy rapidly. Editable format supports quick updates as regulations shift and simplifies stakeholder briefings for faster decision-making.
Weaknesses

Geographic concentration risk
Federal's heavy weighting to a handful of coastal metros exposes results to localized shocks; about 40% of the US population and a majority of GDP are in coastal counties, concentrating economic and regulatory exposure. Regulatory, tax, or economic shifts in these metros can disproportionately impact performance, while natural disasters cluster risk as coastal areas face rising severe‑weather losses. Diversification outside core markets is limited, raising volatility in earnings and asset values.
Retail exposure amid structural shifts
Despite careful curation, the portfolio remains anchored in retail demand, vulnerable as global e-commerce sales hit about $6.3 trillion in 2024, shifting spend online and pressuring discretionary categories. Major chains are optimizing footprints to cut costs, reducing space needs, while re-tenanting small shops can be lengthy and costly, dragging vacancy and capex.

Capital-intensive redevelopment
Large multi-phase redevelopments demand substantial upfront capital and carry execution risk, with cost overruns, schedule delays or leasing shortfalls able to materially dilute returns. Construction in dense urban sites increases entitlement complexity and stakeholder negotiation, raising legal and holding costs. Tying up capital in long-duration projects lengthens payback periods and reduces financial flexibility.

Interest rate and leverage sensitivity
As a REIT, Federal's valuation and FFO are highly sensitive to financing costs and cap‑rate moves; with the 10‑year Treasury around 4.0% in July 2025 rising rates have compressed investment spreads and elevated refinancing risk, pushing debt service higher and crowding out growth capex while equity cost volatility constrains external M&A.
- 10‑yr Treasury ~4.0% (Jul 2025)
- Rising cap rates → valuation compression
- Higher debt service limits capex
- Equity volatility restricts external growth
Anchor and co-tenancy dependencies
Anchor and co-tenancy dependencies mean anchor tenant closures often trigger co-tenancy clauses and rent abatements, lowering NOI; replacing anchors typically takes 12–36 months and requires capital plus municipal approvals. Interim foot-traffic declines can cut small-shop sales and raise vacancy, creating episodic cash-flow pressure for mall owners and lenders.
- Typical anchor replacement: 12–36 months
- Rent abatements can reduce NOI materially during vacancy
- Interim traffic drops hit small tenants and occupancy
Coastal metros concentrate risk: ≈40% pop; e-commerce $6.3T; 10y ≈4.0%
Concentration in coastal metros (≈40% US pop, majority of GDP) raises exposure to local shocks and climate losses. Heavy retail tilt faces e-commerce disruption (global online sales ≈$6.3T in 2024) and mall re‑tenanting is costly. Large redevelopments and rate sensitivity (10‑yr Treasury ≈4.0% Jul 2025) strain liquidity; anchor replacement typically 12–36 months.
| Metric | Value | Impact |
|---|---|---|
| Coastal concentration | ≈40% US pop | Localized risk |
| Global e‑commerce | $6.3T (2024) | Retail pressure |
| 10‑yr Treasury | ≈4.0% (Jul 2025) | Financing cost |
| Anchor replacement | 12–36 months | NOI disruption |
Preview the Actual Deliverable
Federal SWOT Analysis
This is the actual Federal SWOT Analysis document you’ll receive upon purchase—no surprises, just professional quality. The preview below is taken directly from the full report and reflects the same structured, editable content. Purchase unlocks the complete version for download.

Your Strategic Toolkit Starts Here
Unpack Federal’s competitive edge, regulatory exposures, and growth levers with our concise Federal SWOT preview—then get the full analysis for a complete strategic toolkit. Purchase the comprehensive report to receive a research-backed, investor-ready Word brief and editable Excel matrix that help you plan, pitch, or invest with confidence. Don’t miss the deeper insights that drive smarter decisions.
Strengths
Premier coastal, affluent market footprint
Properties concentrated in dense, high‑income coastal submarkets (104 properties, ~26M sq ft as of 2024) deliver strong foot traffic and pricing power; markets show median household incomes >$110,000 and in‑place rents roughly 25–35% above national averages, supporting resilient demand, superior tenant productivity, higher renewal spreads and NAV/cash‑flow premiums.
Mixed-use placemaking expertise
Federal leverages mixed-use placemaking—integrating retail with residential, office and experiences—to create destination environments that lengthen dwell time and diversify revenue streams.
Its portfolio of 100+ properties and market cap ~6.5B (July 2025) drives higher leasing velocity and taps multiple demand drivers, mitigating pure-retail volatility.
This approach supports materially higher site-level economic yield versus standalone centers.
High-quality tenant roster and occupancy
A curated lineup of necessity, service, dining and national retailers supports stable rent collections, with Federal Realty reporting portfolio occupancy of about 95% as of 2024, helping drive resilient cash flow. Consistently high occupancy minimizes downtime and re-leasing risk, while a strong credit mix reduces bad debt and revenue volatility. Dominant anchors draw complementary small-shop tenants, enhancing center foot traffic and overall vitality.
Proven redevelopment and densification pipeline
Active value-add redevelopments unlock additional FAR to add residential units and modernize merchandising, driving higher NOI per square foot and superior returns relative to acquisitions in supply-constrained markets. Phased execution mitigates development risk and enables capital recycling. A consistent track record has strengthened stakeholder confidence and valuation.
- Unlocks FAR and adds housing
- Accretive vs acquisitions
- Phased risk management
- Proven track record boosts valuation
Diversified income and long-term leases
Rental income at Federal Realty is diversified across ~103 shopping centers and roughly 25 million sq ft, spreading tenant and use risk; weighted-average lease term near 8 years gives clear cash-flow visibility and embedded escalators; percentage rents and specialty leasing drove about 6% of 2024 NOI, supporting stable FFO and a 2024 AFFO payout ratio near 78%.
- Diversified footprint ~103 centers
- WALE ~8 years
- Percentage/specialty ~6% NOI (2024)
- AFFO payout ~78% (2024)
Coastal high‑income portfolio: 104 properties, 95% occ, $6.5B market cap
Concentrated in dense, high‑income coastal submarkets (104 properties, ~26M sq ft) with strong pricing power and ~95% occupancy (2024), Federal delivers resilient cash flow and NAV premiums. Mixed‑use placemaking and phased value‑add redevelopments unlock FAR and higher NOI per sq ft. WALE ~8 yrs, market cap ~6.5B (Jul 2025), AFFO payout ~78% (2024).
| Metric | Value |
|---|---|
| Properties / GLA | 104 / ~26M sq ft (2024) |
| Occupancy | ~95% (2024) |
| WALE | ~8 yrs |
| Market Cap | ~$6.5B (Jul 2025) |
| AFFO Payout | ~78% (2024) |
What is included in the product
Detailed Word Document
Provides a concise SWOT analysis of Federal, outlining its core strengths and weaknesses and mapping external opportunities and threats to clarify strategic priorities and competitive positioning.
Customizable Excel Spreadsheet
Provides a clear, government-focused SWOT matrix to align federal policy and agency strategy rapidly. Editable format supports quick updates as regulations shift and simplifies stakeholder briefings for faster decision-making.
Weaknesses
Geographic concentration risk
Federal's heavy weighting to a handful of coastal metros exposes results to localized shocks; about 40% of the US population and a majority of GDP are in coastal counties, concentrating economic and regulatory exposure. Regulatory, tax, or economic shifts in these metros can disproportionately impact performance, while natural disasters cluster risk as coastal areas face rising severe‑weather losses. Diversification outside core markets is limited, raising volatility in earnings and asset values.
Retail exposure amid structural shifts
Despite careful curation, the portfolio remains anchored in retail demand, vulnerable as global e-commerce sales hit about $6.3 trillion in 2024, shifting spend online and pressuring discretionary categories. Major chains are optimizing footprints to cut costs, reducing space needs, while re-tenanting small shops can be lengthy and costly, dragging vacancy and capex.
Capital-intensive redevelopment
Large multi-phase redevelopments demand substantial upfront capital and carry execution risk, with cost overruns, schedule delays or leasing shortfalls able to materially dilute returns. Construction in dense urban sites increases entitlement complexity and stakeholder negotiation, raising legal and holding costs. Tying up capital in long-duration projects lengthens payback periods and reduces financial flexibility.
Interest rate and leverage sensitivity
As a REIT, Federal's valuation and FFO are highly sensitive to financing costs and cap‑rate moves; with the 10‑year Treasury around 4.0% in July 2025 rising rates have compressed investment spreads and elevated refinancing risk, pushing debt service higher and crowding out growth capex while equity cost volatility constrains external M&A.
- 10‑yr Treasury ~4.0% (Jul 2025)
- Rising cap rates → valuation compression
- Higher debt service limits capex
- Equity volatility restricts external growth
Anchor and co-tenancy dependencies
Anchor and co-tenancy dependencies mean anchor tenant closures often trigger co-tenancy clauses and rent abatements, lowering NOI; replacing anchors typically takes 12–36 months and requires capital plus municipal approvals. Interim foot-traffic declines can cut small-shop sales and raise vacancy, creating episodic cash-flow pressure for mall owners and lenders.
- Typical anchor replacement: 12–36 months
- Rent abatements can reduce NOI materially during vacancy
- Interim traffic drops hit small tenants and occupancy
Coastal metros concentrate risk: ≈40% pop; e-commerce $6.3T; 10y ≈4.0%
Concentration in coastal metros (≈40% US pop, majority of GDP) raises exposure to local shocks and climate losses. Heavy retail tilt faces e-commerce disruption (global online sales ≈$6.3T in 2024) and mall re‑tenanting is costly. Large redevelopments and rate sensitivity (10‑yr Treasury ≈4.0% Jul 2025) strain liquidity; anchor replacement typically 12–36 months.
| Metric | Value | Impact |
|---|---|---|
| Coastal concentration | ≈40% US pop | Localized risk |
| Global e‑commerce | $6.3T (2024) | Retail pressure |
| 10‑yr Treasury | ≈4.0% (Jul 2025) | Financing cost |
| Anchor replacement | 12–36 months | NOI disruption |
Preview the Actual Deliverable
Federal SWOT Analysis
This is the actual Federal SWOT Analysis document you’ll receive upon purchase—no surprises, just professional quality. The preview below is taken directly from the full report and reflects the same structured, editable content. Purchase unlocks the complete version for download.
Description
Your Strategic Toolkit Starts Here
Unpack Federal’s competitive edge, regulatory exposures, and growth levers with our concise Federal SWOT preview—then get the full analysis for a complete strategic toolkit. Purchase the comprehensive report to receive a research-backed, investor-ready Word brief and editable Excel matrix that help you plan, pitch, or invest with confidence. Don’t miss the deeper insights that drive smarter decisions.
Strengths
Premier coastal, affluent market footprint
Properties concentrated in dense, high‑income coastal submarkets (104 properties, ~26M sq ft as of 2024) deliver strong foot traffic and pricing power; markets show median household incomes >$110,000 and in‑place rents roughly 25–35% above national averages, supporting resilient demand, superior tenant productivity, higher renewal spreads and NAV/cash‑flow premiums.
Mixed-use placemaking expertise
Federal leverages mixed-use placemaking—integrating retail with residential, office and experiences—to create destination environments that lengthen dwell time and diversify revenue streams.
Its portfolio of 100+ properties and market cap ~6.5B (July 2025) drives higher leasing velocity and taps multiple demand drivers, mitigating pure-retail volatility.
This approach supports materially higher site-level economic yield versus standalone centers.
High-quality tenant roster and occupancy
A curated lineup of necessity, service, dining and national retailers supports stable rent collections, with Federal Realty reporting portfolio occupancy of about 95% as of 2024, helping drive resilient cash flow. Consistently high occupancy minimizes downtime and re-leasing risk, while a strong credit mix reduces bad debt and revenue volatility. Dominant anchors draw complementary small-shop tenants, enhancing center foot traffic and overall vitality.
Proven redevelopment and densification pipeline
Active value-add redevelopments unlock additional FAR to add residential units and modernize merchandising, driving higher NOI per square foot and superior returns relative to acquisitions in supply-constrained markets. Phased execution mitigates development risk and enables capital recycling. A consistent track record has strengthened stakeholder confidence and valuation.
- Unlocks FAR and adds housing
- Accretive vs acquisitions
- Phased risk management
- Proven track record boosts valuation
Diversified income and long-term leases
Rental income at Federal Realty is diversified across ~103 shopping centers and roughly 25 million sq ft, spreading tenant and use risk; weighted-average lease term near 8 years gives clear cash-flow visibility and embedded escalators; percentage rents and specialty leasing drove about 6% of 2024 NOI, supporting stable FFO and a 2024 AFFO payout ratio near 78%.
- Diversified footprint ~103 centers
- WALE ~8 years
- Percentage/specialty ~6% NOI (2024)
- AFFO payout ~78% (2024)
Coastal high‑income portfolio: 104 properties, 95% occ, $6.5B market cap
Concentrated in dense, high‑income coastal submarkets (104 properties, ~26M sq ft) with strong pricing power and ~95% occupancy (2024), Federal delivers resilient cash flow and NAV premiums. Mixed‑use placemaking and phased value‑add redevelopments unlock FAR and higher NOI per sq ft. WALE ~8 yrs, market cap ~6.5B (Jul 2025), AFFO payout ~78% (2024).
| Metric | Value |
|---|---|
| Properties / GLA | 104 / ~26M sq ft (2024) |
| Occupancy | ~95% (2024) |
| WALE | ~8 yrs |
| Market Cap | ~$6.5B (Jul 2025) |
| AFFO Payout | ~78% (2024) |
What is included in the product
Detailed Word Document
Provides a concise SWOT analysis of Federal, outlining its core strengths and weaknesses and mapping external opportunities and threats to clarify strategic priorities and competitive positioning.
Customizable Excel Spreadsheet
Provides a clear, government-focused SWOT matrix to align federal policy and agency strategy rapidly. Editable format supports quick updates as regulations shift and simplifies stakeholder briefings for faster decision-making.
Weaknesses
Geographic concentration risk
Federal's heavy weighting to a handful of coastal metros exposes results to localized shocks; about 40% of the US population and a majority of GDP are in coastal counties, concentrating economic and regulatory exposure. Regulatory, tax, or economic shifts in these metros can disproportionately impact performance, while natural disasters cluster risk as coastal areas face rising severe‑weather losses. Diversification outside core markets is limited, raising volatility in earnings and asset values.
Retail exposure amid structural shifts
Despite careful curation, the portfolio remains anchored in retail demand, vulnerable as global e-commerce sales hit about $6.3 trillion in 2024, shifting spend online and pressuring discretionary categories. Major chains are optimizing footprints to cut costs, reducing space needs, while re-tenanting small shops can be lengthy and costly, dragging vacancy and capex.
Capital-intensive redevelopment
Large multi-phase redevelopments demand substantial upfront capital and carry execution risk, with cost overruns, schedule delays or leasing shortfalls able to materially dilute returns. Construction in dense urban sites increases entitlement complexity and stakeholder negotiation, raising legal and holding costs. Tying up capital in long-duration projects lengthens payback periods and reduces financial flexibility.
Interest rate and leverage sensitivity
As a REIT, Federal's valuation and FFO are highly sensitive to financing costs and cap‑rate moves; with the 10‑year Treasury around 4.0% in July 2025 rising rates have compressed investment spreads and elevated refinancing risk, pushing debt service higher and crowding out growth capex while equity cost volatility constrains external M&A.
- 10‑yr Treasury ~4.0% (Jul 2025)
- Rising cap rates → valuation compression
- Higher debt service limits capex
- Equity volatility restricts external growth
Anchor and co-tenancy dependencies
Anchor and co-tenancy dependencies mean anchor tenant closures often trigger co-tenancy clauses and rent abatements, lowering NOI; replacing anchors typically takes 12–36 months and requires capital plus municipal approvals. Interim foot-traffic declines can cut small-shop sales and raise vacancy, creating episodic cash-flow pressure for mall owners and lenders.
- Typical anchor replacement: 12–36 months
- Rent abatements can reduce NOI materially during vacancy
- Interim traffic drops hit small tenants and occupancy
Coastal metros concentrate risk: ≈40% pop; e-commerce $6.3T; 10y ≈4.0%
Concentration in coastal metros (≈40% US pop, majority of GDP) raises exposure to local shocks and climate losses. Heavy retail tilt faces e-commerce disruption (global online sales ≈$6.3T in 2024) and mall re‑tenanting is costly. Large redevelopments and rate sensitivity (10‑yr Treasury ≈4.0% Jul 2025) strain liquidity; anchor replacement typically 12–36 months.
| Metric | Value | Impact |
|---|---|---|
| Coastal concentration | ≈40% US pop | Localized risk |
| Global e‑commerce | $6.3T (2024) | Retail pressure |
| 10‑yr Treasury | ≈4.0% (Jul 2025) | Financing cost |
| Anchor replacement | 12–36 months | NOI disruption |
Preview the Actual Deliverable
Federal SWOT Analysis
This is the actual Federal SWOT Analysis document you’ll receive upon purchase—no surprises, just professional quality. The preview below is taken directly from the full report and reflects the same structured, editable content. Purchase unlocks the complete version for download.











