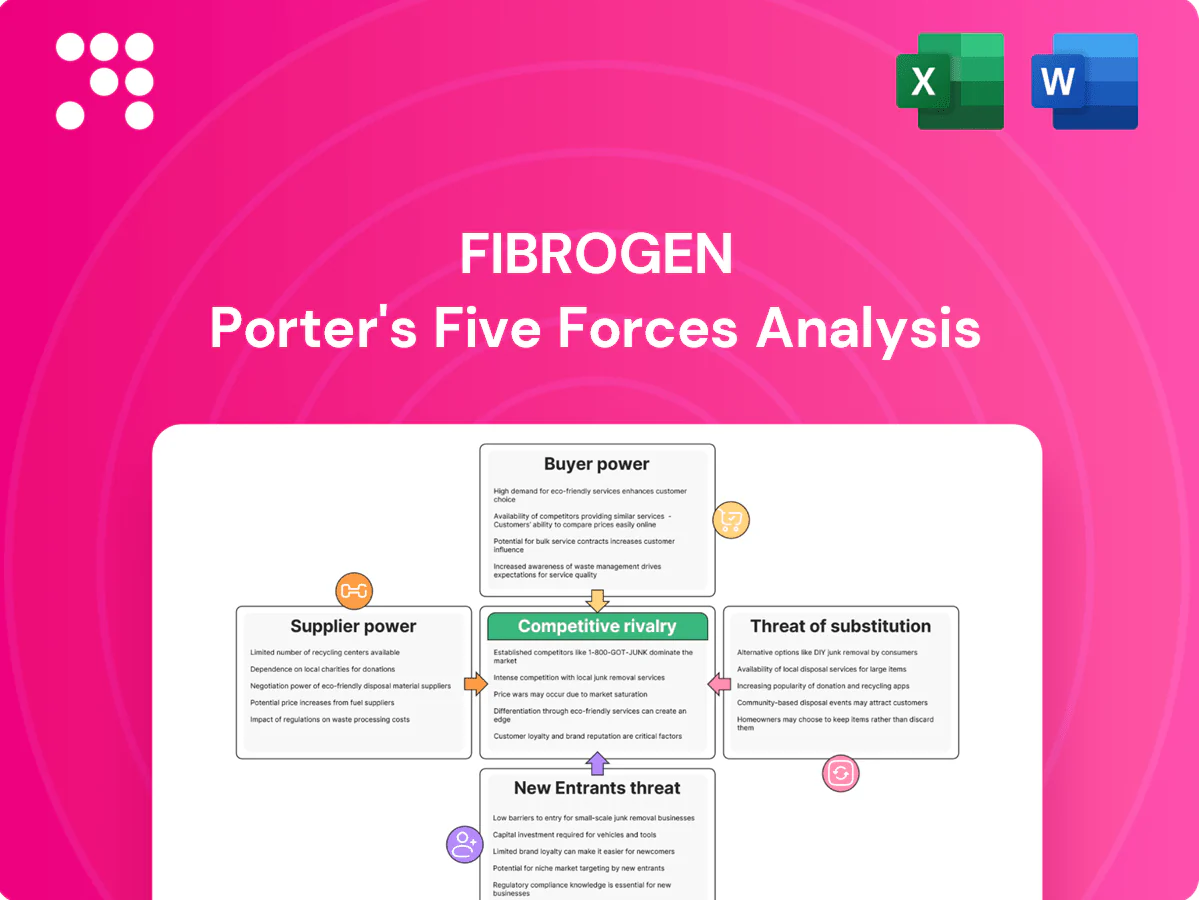
FibroGen Porter's Five Forces Analysis

A Must-Have Tool for Decision-Makers
FibroGen faces intense industry rivalry, high buyer scrutiny, and moderate supplier power shaped by biotech partnerships, while barriers to entry and substitutes hinge on clinical differentiation and regulatory hurdles. This snapshot highlights key pressures and strategic levers—unlock the full Porter's Five Forces Analysis for force-by-force ratings, visuals, and actionable recommendations to inform investment or strategy decisions.
Suppliers Bargaining Power

Specialized API sources
Roxadustat and similar small molecules require tightly specified APIs with a small pool of qualified producers, creating single- or dual-source dependencies that increase supplier leverage on pricing and contract terms. Qualifying alternate API suppliers under GMP and regulatory filings typically requires 6–12 months of validation and regulatory coordination. Any supplier disruption can delay pivotal trials or commercialization timelines by several months.
GMP CMO capacity
High-quality CMOs for oral solids and sterile products were capacity-constrained in 2024, with industry surveys reporting sterile injectable capacity utilization near 90% and oral-solid lines ~80–85%, giving CMOs leverage to demand take-or-pay and escalation clauses. Complex tech transfers and validation create material lock-in, while switching risks cause supply gaps and trigger costly regulatory re-inspections that can delay product launches and revenues.

CRO and site reliance
Clinical execution for FibroGen depends on top-tier CROs and high-enrolling nephrology/oncology sites, with the top 10% of sites historically accounting for roughly half of patient enrollments; that concentration strengthens supplier leverage. Competition for scarce patient access and prime CRO capacity pushed pricing and priority fees higher, contributing to a CRO market valued at about $63 billion in 2024. Protocol amendments amplify change-order costs and billing complexity, and delays translate directly into missed milestones and compressed cash runway, materially affecting burn and valuation timing.

Specialty inputs and assays
Assays, biomarkers and stability testing for FibroGen rely on niche suppliers, and 2024 industry surveys report median lead times for custom reagents of roughly 6–10 weeks; low substitutability gives suppliers stronger bargaining power. Quality deviations force costly rework and batch write-offs, with single development-scale write-offs often exceeding $250,000 and delaying timelines. Long lead times and limited vendors elevate supplier leverage in procurement and risk management.
- Supplier concentration: few specialized vendors
- Lead times: median 6–10 weeks (2024 survey)
- Cost of write-offs: often >$250,000 per batch
- Substitutability: low, raising bargaining power
Regulatory compliance burden
Evolving GMP and pharmacovigilance requirements in 2024 have increased supplier qualification complexity and cost for FibroGen, enabling vendors who pass stringent compliance audits to command premiums and negotiate tighter terms. Heightened documentation and serialization requirements raise per-unit expenses and traceability workloads, while supplier non-compliance risks global shipment halts and production delays.
- Higher qualification costs: compliance-driven
- Premiums for audited vendors
- Per-unit serialization/documentation expenses
- Non-compliance can stop global shipments
Suppliers hold leverage: sterile CMO ~90%, API qual 6–12m, CRO $63B
Suppliers hold high leverage due to concentrated API/CMO niches, long GMP qualification (6–12 months) and limited substitutes, making pricing and terms supplier-favorable. 2024 CMO utilization: sterile ~90%, oral solids 80–85%; CRO market valued ~$63B, with top sites driving enrollments. Single batch write-offs often exceed $250,000 and custom reagent lead times run 6–10 weeks.
| Metric | 2024 Value |
|---|---|
| Sterile CMO utilization | ~90% |
| Oral solids utilization | 80–85% |
| CRO market | $63B |
| API qualification | 6–12 months |
| Reagent lead time | 6–10 weeks |
| Batch write-off cost | >$250,000 |
What is included in the product
 Detailed Word Document
Concise Porter's Five Forces analysis tailored to FibroGen, uncovering competitive intensity, buyer and supplier leverage, barriers to entry, substitute threats, and disruptive forces shaping pricing power and profitability within the biopharma landscape.

 Customizable Excel Spreadsheet
Concise one-sheet Porter's Five Forces for FibroGen—clarifies competitive threats, supplier and payer power, and regulatory pressure for rapid investment and strategic decisions.
Customers Bargaining Power

Payer consolidation
US payers and three dominant PBMs (CVS Caremark, Express Scripts, OptumRx) control roughly 80% of pharmacy claims and exert strong rebate leverage; the top five insurers cover about 70% of commercial lives. Coverage decisions hinge on cost-effectiveness versus ESAs and IV/oral iron therapies, with PBMs extracting large rebates. Step edits and prior authorization are common, increasing pricing pressure and access delays. Ex-US HTA bodies apply strict thresholds (NICE £20,000–30,000/QALY; ICER $100,000–150,000/QALY), constraining premium pricing.
Dialysis chain leverage
As of 2024, Fresenius and DaVita control roughly 70% of the US dialysis market, serving within a total US dialysis population of about 550,000 patients, giving chains strong procurement leverage. Volume concentration yields steep price concessions and performance guarantees tied to patient outcomes. Preferred protocols and standardized formularies can effectively exclude rival agents. Loss of a chain contract can materially cut market share and revenue.

Therapeutic alternatives
Clinicians can choose ESAs, IV iron, transfusions or HIF-PHI agents, making ready substitutes that lower switching costs and increase buyer power. With outcomes broadly comparable, procurement shifts to net price and distribution logistics; the global ESA market was about 9.2 billion USD in 2024, intensifying price pressure. Payers and hospitals increasingly demand real-world evidence—72% of US payers in 2024 surveyed require RWE to justify premiums.

Price sensitivity in CKD/MDS
Chronic use in CKD/MDS magnifies cost scrutiny—CKD affects ~15% of US adults, making population-level budget impact central to payers in 2024; negotiations increasingly hinge on ICER-style thresholds of $100,000–$150,000 per QALY. Payers demand discounts, caps and risk-sharing; price ceilings tighten as biosimilars/generics drive down ESA benchmarks.
- chronic-use: long-term cost focus
- budget-impact: population models dominate
- contracting: discounts, caps, risk-share required
- pricing-pressure: generics/biosimilars lower ESA ceilings
Data and access requirements
Payers in 2024 insist on head-to-head or robust comparative data for FibroGen therapies, slowing formulary acceptance without clear superiority; safety signals often trigger REMS or access restrictions that cap uptake. Outcomes-based contracts increasingly tie revenue to real-world effectiveness, while rebate depth remains a primary determinant of formulary tiering and patient access.
- 2024: head-to-head evidence required
- REMS/restrictions limit market penetration
- Outcomes contracts + rebates dictate formulary placement
PBMs extract rebates on ~80% claims; top insurers cover ~70% lives
US payers/PBMs (~80% pharmacy claims) and top five insurers (~70% commercial lives) extract deep rebates, PA and step edits. Dialysis chains (Fresenius+DaVita ~70% share; ~550,000 US patients) enforce formularies, excluding rivals. Ready substitutes (ESA market $9.2B in 2024) and HTA thresholds ($100k–150k/QALY) limit premium pricing and drive outcomes/risk-sharing.
| Metric | 2024 |
|---|---|
| PBM share | ~80% |
| Top insurers | ~70% commercial lives |
| Dialysis chains | ~70%; 550k pts |
| ESA market | $9.2B |
| HTA thresholds | $100k–150k/QALY |
Preview Before You Purchase
FibroGen Porter's Five Forces Analysis
This preview shows the exact document you'll receive immediately after purchase—no surprises, no placeholders. The FibroGen Porter's Five Forces Analysis evaluates competitive rivalry in biotech, supplier and buyer power in the specialty pharma supply chain, and risks from new entrants and substitute therapies. It highlights regulatory and IP dynamics specific to FibroGen and offers strategic implications for investors and management.

A Must-Have Tool for Decision-Makers
FibroGen faces intense industry rivalry, high buyer scrutiny, and moderate supplier power shaped by biotech partnerships, while barriers to entry and substitutes hinge on clinical differentiation and regulatory hurdles. This snapshot highlights key pressures and strategic levers—unlock the full Porter's Five Forces Analysis for force-by-force ratings, visuals, and actionable recommendations to inform investment or strategy decisions.
Suppliers Bargaining Power
Specialized API sources
Roxadustat and similar small molecules require tightly specified APIs with a small pool of qualified producers, creating single- or dual-source dependencies that increase supplier leverage on pricing and contract terms. Qualifying alternate API suppliers under GMP and regulatory filings typically requires 6–12 months of validation and regulatory coordination. Any supplier disruption can delay pivotal trials or commercialization timelines by several months.
GMP CMO capacity
High-quality CMOs for oral solids and sterile products were capacity-constrained in 2024, with industry surveys reporting sterile injectable capacity utilization near 90% and oral-solid lines ~80–85%, giving CMOs leverage to demand take-or-pay and escalation clauses. Complex tech transfers and validation create material lock-in, while switching risks cause supply gaps and trigger costly regulatory re-inspections that can delay product launches and revenues.
CRO and site reliance
Clinical execution for FibroGen depends on top-tier CROs and high-enrolling nephrology/oncology sites, with the top 10% of sites historically accounting for roughly half of patient enrollments; that concentration strengthens supplier leverage. Competition for scarce patient access and prime CRO capacity pushed pricing and priority fees higher, contributing to a CRO market valued at about $63 billion in 2024. Protocol amendments amplify change-order costs and billing complexity, and delays translate directly into missed milestones and compressed cash runway, materially affecting burn and valuation timing.
Specialty inputs and assays
Assays, biomarkers and stability testing for FibroGen rely on niche suppliers, and 2024 industry surveys report median lead times for custom reagents of roughly 6–10 weeks; low substitutability gives suppliers stronger bargaining power. Quality deviations force costly rework and batch write-offs, with single development-scale write-offs often exceeding $250,000 and delaying timelines. Long lead times and limited vendors elevate supplier leverage in procurement and risk management.
- Supplier concentration: few specialized vendors
- Lead times: median 6–10 weeks (2024 survey)
- Cost of write-offs: often >$250,000 per batch
- Substitutability: low, raising bargaining power
Regulatory compliance burden
Evolving GMP and pharmacovigilance requirements in 2024 have increased supplier qualification complexity and cost for FibroGen, enabling vendors who pass stringent compliance audits to command premiums and negotiate tighter terms. Heightened documentation and serialization requirements raise per-unit expenses and traceability workloads, while supplier non-compliance risks global shipment halts and production delays.
- Higher qualification costs: compliance-driven
- Premiums for audited vendors
- Per-unit serialization/documentation expenses
- Non-compliance can stop global shipments
Suppliers hold leverage: sterile CMO ~90%, API qual 6–12m, CRO $63B
Suppliers hold high leverage due to concentrated API/CMO niches, long GMP qualification (6–12 months) and limited substitutes, making pricing and terms supplier-favorable. 2024 CMO utilization: sterile ~90%, oral solids 80–85%; CRO market valued ~$63B, with top sites driving enrollments. Single batch write-offs often exceed $250,000 and custom reagent lead times run 6–10 weeks.
| Metric | 2024 Value |
|---|---|
| Sterile CMO utilization | ~90% |
| Oral solids utilization | 80–85% |
| CRO market | $63B |
| API qualification | 6–12 months |
| Reagent lead time | 6–10 weeks |
| Batch write-off cost | >$250,000 |
What is included in the product
Detailed Word Document
Concise Porter's Five Forces analysis tailored to FibroGen, uncovering competitive intensity, buyer and supplier leverage, barriers to entry, substitute threats, and disruptive forces shaping pricing power and profitability within the biopharma landscape.
Customizable Excel Spreadsheet
Concise one-sheet Porter's Five Forces for FibroGen—clarifies competitive threats, supplier and payer power, and regulatory pressure for rapid investment and strategic decisions.
Customers Bargaining Power
Payer consolidation
US payers and three dominant PBMs (CVS Caremark, Express Scripts, OptumRx) control roughly 80% of pharmacy claims and exert strong rebate leverage; the top five insurers cover about 70% of commercial lives. Coverage decisions hinge on cost-effectiveness versus ESAs and IV/oral iron therapies, with PBMs extracting large rebates. Step edits and prior authorization are common, increasing pricing pressure and access delays. Ex-US HTA bodies apply strict thresholds (NICE £20,000–30,000/QALY; ICER $100,000–150,000/QALY), constraining premium pricing.
Dialysis chain leverage
As of 2024, Fresenius and DaVita control roughly 70% of the US dialysis market, serving within a total US dialysis population of about 550,000 patients, giving chains strong procurement leverage. Volume concentration yields steep price concessions and performance guarantees tied to patient outcomes. Preferred protocols and standardized formularies can effectively exclude rival agents. Loss of a chain contract can materially cut market share and revenue.
Therapeutic alternatives
Clinicians can choose ESAs, IV iron, transfusions or HIF-PHI agents, making ready substitutes that lower switching costs and increase buyer power. With outcomes broadly comparable, procurement shifts to net price and distribution logistics; the global ESA market was about 9.2 billion USD in 2024, intensifying price pressure. Payers and hospitals increasingly demand real-world evidence—72% of US payers in 2024 surveyed require RWE to justify premiums.
Price sensitivity in CKD/MDS
Chronic use in CKD/MDS magnifies cost scrutiny—CKD affects ~15% of US adults, making population-level budget impact central to payers in 2024; negotiations increasingly hinge on ICER-style thresholds of $100,000–$150,000 per QALY. Payers demand discounts, caps and risk-sharing; price ceilings tighten as biosimilars/generics drive down ESA benchmarks.
- chronic-use: long-term cost focus
- budget-impact: population models dominate
- contracting: discounts, caps, risk-share required
- pricing-pressure: generics/biosimilars lower ESA ceilings
Data and access requirements
Payers in 2024 insist on head-to-head or robust comparative data for FibroGen therapies, slowing formulary acceptance without clear superiority; safety signals often trigger REMS or access restrictions that cap uptake. Outcomes-based contracts increasingly tie revenue to real-world effectiveness, while rebate depth remains a primary determinant of formulary tiering and patient access.
- 2024: head-to-head evidence required
- REMS/restrictions limit market penetration
- Outcomes contracts + rebates dictate formulary placement
PBMs extract rebates on ~80% claims; top insurers cover ~70% lives
US payers/PBMs (~80% pharmacy claims) and top five insurers (~70% commercial lives) extract deep rebates, PA and step edits. Dialysis chains (Fresenius+DaVita ~70% share; ~550,000 US patients) enforce formularies, excluding rivals. Ready substitutes (ESA market $9.2B in 2024) and HTA thresholds ($100k–150k/QALY) limit premium pricing and drive outcomes/risk-sharing.
| Metric | 2024 |
|---|---|
| PBM share | ~80% |
| Top insurers | ~70% commercial lives |
| Dialysis chains | ~70%; 550k pts |
| ESA market | $9.2B |
| HTA thresholds | $100k–150k/QALY |
Preview Before You Purchase
FibroGen Porter's Five Forces Analysis
This preview shows the exact document you'll receive immediately after purchase—no surprises, no placeholders. The FibroGen Porter's Five Forces Analysis evaluates competitive rivalry in biotech, supplier and buyer power in the specialty pharma supply chain, and risks from new entrants and substitute therapies. It highlights regulatory and IP dynamics specific to FibroGen and offers strategic implications for investors and management.
Original: $10.00
-65%$10.00
$3.50Description
A Must-Have Tool for Decision-Makers
FibroGen faces intense industry rivalry, high buyer scrutiny, and moderate supplier power shaped by biotech partnerships, while barriers to entry and substitutes hinge on clinical differentiation and regulatory hurdles. This snapshot highlights key pressures and strategic levers—unlock the full Porter's Five Forces Analysis for force-by-force ratings, visuals, and actionable recommendations to inform investment or strategy decisions.
Suppliers Bargaining Power
Specialized API sources
Roxadustat and similar small molecules require tightly specified APIs with a small pool of qualified producers, creating single- or dual-source dependencies that increase supplier leverage on pricing and contract terms. Qualifying alternate API suppliers under GMP and regulatory filings typically requires 6–12 months of validation and regulatory coordination. Any supplier disruption can delay pivotal trials or commercialization timelines by several months.
GMP CMO capacity
High-quality CMOs for oral solids and sterile products were capacity-constrained in 2024, with industry surveys reporting sterile injectable capacity utilization near 90% and oral-solid lines ~80–85%, giving CMOs leverage to demand take-or-pay and escalation clauses. Complex tech transfers and validation create material lock-in, while switching risks cause supply gaps and trigger costly regulatory re-inspections that can delay product launches and revenues.
CRO and site reliance
Clinical execution for FibroGen depends on top-tier CROs and high-enrolling nephrology/oncology sites, with the top 10% of sites historically accounting for roughly half of patient enrollments; that concentration strengthens supplier leverage. Competition for scarce patient access and prime CRO capacity pushed pricing and priority fees higher, contributing to a CRO market valued at about $63 billion in 2024. Protocol amendments amplify change-order costs and billing complexity, and delays translate directly into missed milestones and compressed cash runway, materially affecting burn and valuation timing.
Specialty inputs and assays
Assays, biomarkers and stability testing for FibroGen rely on niche suppliers, and 2024 industry surveys report median lead times for custom reagents of roughly 6–10 weeks; low substitutability gives suppliers stronger bargaining power. Quality deviations force costly rework and batch write-offs, with single development-scale write-offs often exceeding $250,000 and delaying timelines. Long lead times and limited vendors elevate supplier leverage in procurement and risk management.
- Supplier concentration: few specialized vendors
- Lead times: median 6–10 weeks (2024 survey)
- Cost of write-offs: often >$250,000 per batch
- Substitutability: low, raising bargaining power
Regulatory compliance burden
Evolving GMP and pharmacovigilance requirements in 2024 have increased supplier qualification complexity and cost for FibroGen, enabling vendors who pass stringent compliance audits to command premiums and negotiate tighter terms. Heightened documentation and serialization requirements raise per-unit expenses and traceability workloads, while supplier non-compliance risks global shipment halts and production delays.
- Higher qualification costs: compliance-driven
- Premiums for audited vendors
- Per-unit serialization/documentation expenses
- Non-compliance can stop global shipments
Suppliers hold leverage: sterile CMO ~90%, API qual 6–12m, CRO $63B
Suppliers hold high leverage due to concentrated API/CMO niches, long GMP qualification (6–12 months) and limited substitutes, making pricing and terms supplier-favorable. 2024 CMO utilization: sterile ~90%, oral solids 80–85%; CRO market valued ~$63B, with top sites driving enrollments. Single batch write-offs often exceed $250,000 and custom reagent lead times run 6–10 weeks.
| Metric | 2024 Value |
|---|---|
| Sterile CMO utilization | ~90% |
| Oral solids utilization | 80–85% |
| CRO market | $63B |
| API qualification | 6–12 months |
| Reagent lead time | 6–10 weeks |
| Batch write-off cost | >$250,000 |
What is included in the product
Detailed Word Document
Concise Porter's Five Forces analysis tailored to FibroGen, uncovering competitive intensity, buyer and supplier leverage, barriers to entry, substitute threats, and disruptive forces shaping pricing power and profitability within the biopharma landscape.
Customizable Excel Spreadsheet
Concise one-sheet Porter's Five Forces for FibroGen—clarifies competitive threats, supplier and payer power, and regulatory pressure for rapid investment and strategic decisions.
Customers Bargaining Power
Payer consolidation
US payers and three dominant PBMs (CVS Caremark, Express Scripts, OptumRx) control roughly 80% of pharmacy claims and exert strong rebate leverage; the top five insurers cover about 70% of commercial lives. Coverage decisions hinge on cost-effectiveness versus ESAs and IV/oral iron therapies, with PBMs extracting large rebates. Step edits and prior authorization are common, increasing pricing pressure and access delays. Ex-US HTA bodies apply strict thresholds (NICE £20,000–30,000/QALY; ICER $100,000–150,000/QALY), constraining premium pricing.
Dialysis chain leverage
As of 2024, Fresenius and DaVita control roughly 70% of the US dialysis market, serving within a total US dialysis population of about 550,000 patients, giving chains strong procurement leverage. Volume concentration yields steep price concessions and performance guarantees tied to patient outcomes. Preferred protocols and standardized formularies can effectively exclude rival agents. Loss of a chain contract can materially cut market share and revenue.
Therapeutic alternatives
Clinicians can choose ESAs, IV iron, transfusions or HIF-PHI agents, making ready substitutes that lower switching costs and increase buyer power. With outcomes broadly comparable, procurement shifts to net price and distribution logistics; the global ESA market was about 9.2 billion USD in 2024, intensifying price pressure. Payers and hospitals increasingly demand real-world evidence—72% of US payers in 2024 surveyed require RWE to justify premiums.
Price sensitivity in CKD/MDS
Chronic use in CKD/MDS magnifies cost scrutiny—CKD affects ~15% of US adults, making population-level budget impact central to payers in 2024; negotiations increasingly hinge on ICER-style thresholds of $100,000–$150,000 per QALY. Payers demand discounts, caps and risk-sharing; price ceilings tighten as biosimilars/generics drive down ESA benchmarks.
- chronic-use: long-term cost focus
- budget-impact: population models dominate
- contracting: discounts, caps, risk-share required
- pricing-pressure: generics/biosimilars lower ESA ceilings
Data and access requirements
Payers in 2024 insist on head-to-head or robust comparative data for FibroGen therapies, slowing formulary acceptance without clear superiority; safety signals often trigger REMS or access restrictions that cap uptake. Outcomes-based contracts increasingly tie revenue to real-world effectiveness, while rebate depth remains a primary determinant of formulary tiering and patient access.
- 2024: head-to-head evidence required
- REMS/restrictions limit market penetration
- Outcomes contracts + rebates dictate formulary placement
PBMs extract rebates on ~80% claims; top insurers cover ~70% lives
US payers/PBMs (~80% pharmacy claims) and top five insurers (~70% commercial lives) extract deep rebates, PA and step edits. Dialysis chains (Fresenius+DaVita ~70% share; ~550,000 US patients) enforce formularies, excluding rivals. Ready substitutes (ESA market $9.2B in 2024) and HTA thresholds ($100k–150k/QALY) limit premium pricing and drive outcomes/risk-sharing.
| Metric | 2024 |
|---|---|
| PBM share | ~80% |
| Top insurers | ~70% commercial lives |
| Dialysis chains | ~70%; 550k pts |
| ESA market | $9.2B |
| HTA thresholds | $100k–150k/QALY |
Preview Before You Purchase
FibroGen Porter's Five Forces Analysis
This preview shows the exact document you'll receive immediately after purchase—no surprises, no placeholders. The FibroGen Porter's Five Forces Analysis evaluates competitive rivalry in biotech, supplier and buyer power in the specialty pharma supply chain, and risks from new entrants and substitute therapies. It highlights regulatory and IP dynamics specific to FibroGen and offers strategic implications for investors and management.











