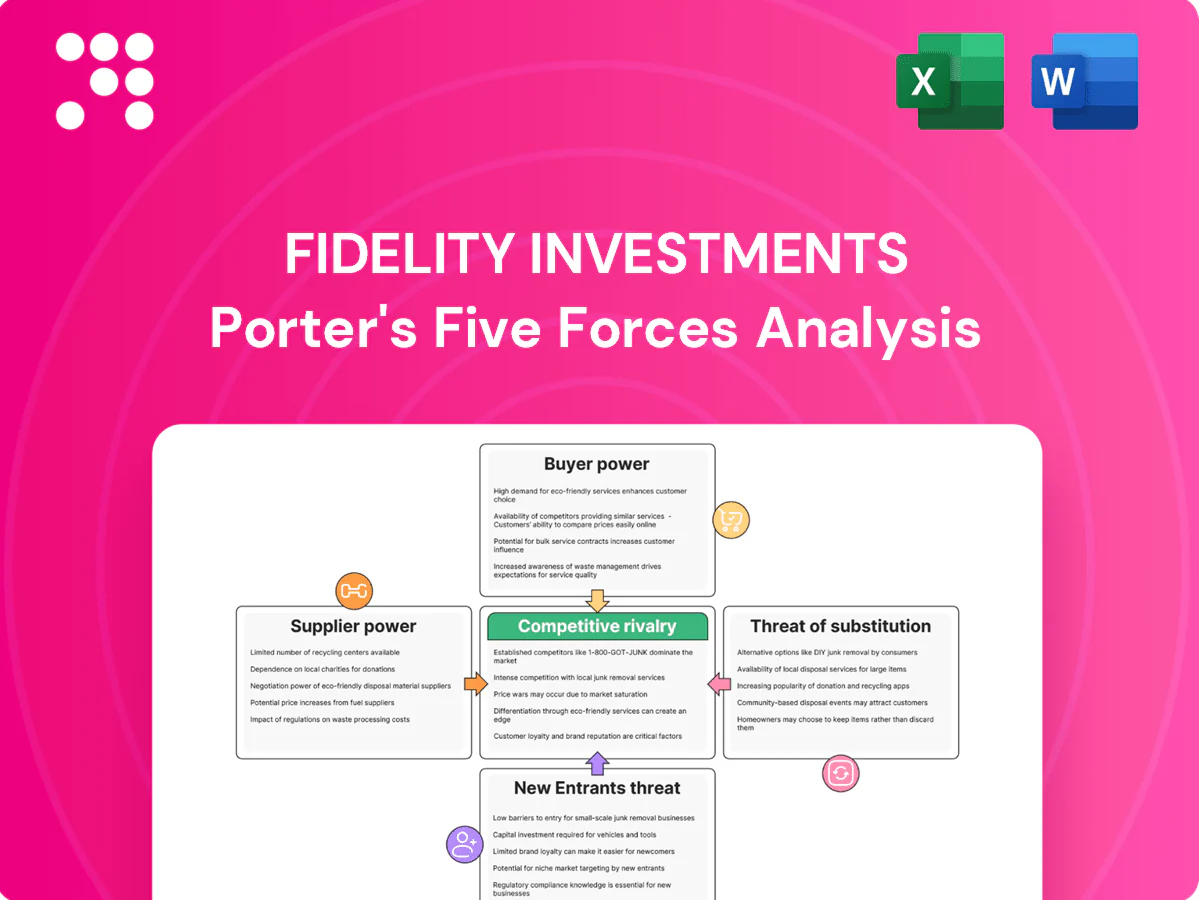
Fidelity Investments Porter's Five Forces Analysis

Don't Miss the Bigger Picture
Fidelity Investments faces intense competitive rivalry, evolving regulatory pressures, and shifting client bargaining power that shape its strategic playbook. Insights on supplier influence, substitute threats, and entry barriers reveal where advantage is earned or lost. This brief only scratches the surface—unlock the full Porter's Five Forces Analysis for detailed force ratings, visuals, and actionable strategy guidance.
Suppliers Bargaining Power

Concentrated market data and index licensors
Essential inputs like real-time market data and index licenses (e.g., MSCI, S&P) are controlled by a few providers that supply over 70% of widely used benchmarks, raising switching costs and recurring fees. Fidelity’s scale and $4–5T+ asset base in 2024 give negotiation leverage, but dependency remains for benchmarked products and ETFs. Price hikes or restrictive terms can compress product margins; multi-year contracts mitigate volatility but lock in costs.
Exchanges, liquidity venues, and counterparties
Order routing depends on major exchanges, ATSs, and market makers, with the top five US venues handling over 80% of displayed equity volume in 2024, concentrating supplier power. Best-execution and payment-for-order-flow dynamics have shifted unit economics, with retail PFOF still representing a material share of broker revenue. Fidelity’s internalization and broad routing reduce single-point exposure by redirecting flows across counterparties. During market stress, reliance on top-tier counterparties rises, increasing supplier leverage and execution risk.

Cloud, cybersecurity, and core tech vendors
Mission-critical cloud, cybersecurity and core software vendors are concentrated: in 2024 hyperscaler market shares were roughly AWS 31%, Microsoft Azure 23%, Google Cloud 11%, creating limited alternatives and high switching costs.
Deep integration and vendor risk management create stickiness; FedRAMP, SOC 2 and ISO requirements raise qualification thresholds, narrowing vetted supplier pools.
Fidelity’s substantial in-house tech reduces dependence but cannot replace hyperscaler scale, global footprint, or managed security capabilities.

Talent and specialized advisory expertise
Highly skilled portfolio managers, quants, and advisors act as scarce suppliers of human capital, raising bargaining power amid a tight US labor market (unemployment ~3.7% in 2024) and rising performance-linked pay; Fidelity’s scale (≈$4.2 trillion AUM in 2024) and career paths help attract and retain talent, but turnover risks can still hurt fund performance and client retention.
- Scarcity: high-demand quants/PMs
- Labor: US unemployment ~3.7% (2024)
- Fidelity scale: ≈$4.2T AUM (2024)
- Risk: turnover → performance/client loss
Third-party asset managers and product manufacturers
Open-architecture platforms carry third-party funds and annuities whose providers can influence shelf fees and revenue sharing; Fidelity, with over $4 trillion in assets under management, uses distribution scale to secure preferred economics. However, unique or star products can still command premium terms from the supplier side. Platform curation and model portfolio design shift margin mix toward proprietary or higher-fee offerings.
- Scale leverage: Fidelity >$4 trillion AUM boosts negotiating power
- Supplier leverage: star funds/annuities can extract better fees
- Margin dynamics: curation and models favor higher-margin proprietary products
Concentrated suppliers (>70% data, top5 >80% vol); hyperscalers 31/23/11%; top mgr $4.2T; US 3.7%
Key suppliers (data/index providers >70% share, top‑5 venues >80% US equity volume, hyperscalers: AWS 31%/Azure 23%/GCP 11% in 2024) exert concentrated leverage; Fidelity’s ≈$4.2T AUM and scale mitigate but cannot eliminate supplier pricing, execution or talent risks (US unemployment ~3.7% 2024).
| Supplier | 2024 metric |
|---|---|
| Data/Indexes | >70% benchmarks |
| Exchanges/ATS | Top5 >80% volume |
| Hyperscalers | AWS31%/Azure23%/GCP11% |
| Fidelity scale | ≈$4.2T AUM |
What is included in the product
 Detailed Word Document
Uncovers key drivers of competition, customer influence, supplier power, and market entry risks tailored to Fidelity Investments, identifying disruptive threats, substitutes, and strategic protections for market share.

 Customizable Excel Spreadsheet
Fidelity's Porter's Five Forces one-sheet instantly clarifies competitive pressures for faster decisions, with customizable pressure levels and a clean radar chart for board-ready visuals; no macros required and easily swapped into your Excel dashboards or pitch decks to remove analysis friction.
Customers Bargaining Power

Price-sensitive retail investors
Zero-commission trading, standard since 2020, and fee transparency have increased retail investor leverage, letting customers quickly compare expense ratios and shift to low-cost index funds like Fidelity ZERO series (FZROX). Fidelity counters with no-fee funds, competitive cash-management yields, a polished UX and Active Trader Pro to reduce churn. Loyalty programs and integrated advising raise switching costs modestly.
Institutional clients and plan sponsors
Institutional clients and plan sponsors exert strong fee and service pressure on large mandates and 401(k) plans, with 2024 RFPs driving average fee concessions of roughly 10–25%. Fidelity’s scale—about $4.3 trillion in AUM/AA and roughly 22% recordkeeping market share in 2024—boosts win rates through broad service breadth and technology. Multi-year contracts (typically 3–7 years) create relationship stickiness that tempers buyer power.

High-net-worth and advisory clients
High-net-worth and advisory clients exert strong bargaining power because they can multi-home across custodians and demand tailored solutions; Fidelity reported about $11.1 trillion in client assets in 2024, underscoring the scale of competition for HNW flows. Performance transparency and tax-sensitive outcomes drive fee scrutiny and switching risk. Fidelity Private Wealth and exclusive alternatives access help defend pricing, while personalized planning and digital reporting deepen ties and moderate buyer leverage.

Low switching costs across platforms
Low switching costs: ACATS transfers typically settle in 3–6 business days and ETFs trade like stocks, enabling near-immediate portability; ubiquitous mobile apps (about 85% US smartphone penetration) further ease switching, while aggressive promotional cash/sign-up offers by rivals amplify buyer power. Fidelity counters with ecosystem lock-in via planning tools, cash-management and investor education, but growing data-portability efforts incrementally raise churn risk.
- ACATS: 3–6 business days
- ETF portability: tradable like stocks
- Mobile access: ~85% US smartphones
- Fidelity defenses: planning, cash mgmt, education
- Risk: rising data portability increases churn
Demand for yield and cash optimization
Rate cycles in 2023–2024 pushed short-term yields materially higher, with 3‑month Treasury and fed funds trading near the mid‑single digits, elevating client sensitivity to sweep and MMF yields and prompting rapid balance shifts to higher‑yield vehicles that compress Fidelity’s deposit spreads.
Fidelity’s scale in government and core MMFs (billions under management) plus treasury sweep options have helped retain assets, while transparent pricing and auto‑sweep defaults reduce defections.
- Higher short‑term yields ~mid‑single digits in 2024
- Rapid client flow into top‑yield MMFs
- Scale and auto‑sweep reduce churn
Scale versus client leverage: $4.3T AUM, 22% 401(k), 10–25% fee cuts
Customer bargaining power is high: retail zero‑commission trading and fee transparency enable quick switching; ACATS transfers settle in 3–6 business days and ETFs trade instantly. Institutional RFPs in 2024 drove ~10–25% fee concessions, but Fidelity’s scale (~$4.3T AUM/AA; ~22% 401(k) recordkeeping share) and advisory services create partial stickiness.
| Metric | 2024 |
|---|---|
| AUM/AA | $4.3T |
| 401(k) share | ~22% |
| RFP fee cuts | 10–25% |
| ACATS | 3–6 days |
Same Document Delivered
Fidelity Investments Porter's Five Forces Analysis
This preview presents the Fidelity Investments Porter's Five Forces analysis exactly as delivered—fully written, formatted, and ready for use. What you see is the same document you’ll receive instantly after purchase, with no placeholders or alterations. Use it immediately for research, strategy, or presentation needs.

Don't Miss the Bigger Picture
Fidelity Investments faces intense competitive rivalry, evolving regulatory pressures, and shifting client bargaining power that shape its strategic playbook. Insights on supplier influence, substitute threats, and entry barriers reveal where advantage is earned or lost. This brief only scratches the surface—unlock the full Porter's Five Forces Analysis for detailed force ratings, visuals, and actionable strategy guidance.
Suppliers Bargaining Power
Concentrated market data and index licensors
Essential inputs like real-time market data and index licenses (e.g., MSCI, S&P) are controlled by a few providers that supply over 70% of widely used benchmarks, raising switching costs and recurring fees. Fidelity’s scale and $4–5T+ asset base in 2024 give negotiation leverage, but dependency remains for benchmarked products and ETFs. Price hikes or restrictive terms can compress product margins; multi-year contracts mitigate volatility but lock in costs.
Exchanges, liquidity venues, and counterparties
Order routing depends on major exchanges, ATSs, and market makers, with the top five US venues handling over 80% of displayed equity volume in 2024, concentrating supplier power. Best-execution and payment-for-order-flow dynamics have shifted unit economics, with retail PFOF still representing a material share of broker revenue. Fidelity’s internalization and broad routing reduce single-point exposure by redirecting flows across counterparties. During market stress, reliance on top-tier counterparties rises, increasing supplier leverage and execution risk.
Cloud, cybersecurity, and core tech vendors
Mission-critical cloud, cybersecurity and core software vendors are concentrated: in 2024 hyperscaler market shares were roughly AWS 31%, Microsoft Azure 23%, Google Cloud 11%, creating limited alternatives and high switching costs.
Deep integration and vendor risk management create stickiness; FedRAMP, SOC 2 and ISO requirements raise qualification thresholds, narrowing vetted supplier pools.
Fidelity’s substantial in-house tech reduces dependence but cannot replace hyperscaler scale, global footprint, or managed security capabilities.
Talent and specialized advisory expertise
Highly skilled portfolio managers, quants, and advisors act as scarce suppliers of human capital, raising bargaining power amid a tight US labor market (unemployment ~3.7% in 2024) and rising performance-linked pay; Fidelity’s scale (≈$4.2 trillion AUM in 2024) and career paths help attract and retain talent, but turnover risks can still hurt fund performance and client retention.
- Scarcity: high-demand quants/PMs
- Labor: US unemployment ~3.7% (2024)
- Fidelity scale: ≈$4.2T AUM (2024)
- Risk: turnover → performance/client loss
Third-party asset managers and product manufacturers
Open-architecture platforms carry third-party funds and annuities whose providers can influence shelf fees and revenue sharing; Fidelity, with over $4 trillion in assets under management, uses distribution scale to secure preferred economics. However, unique or star products can still command premium terms from the supplier side. Platform curation and model portfolio design shift margin mix toward proprietary or higher-fee offerings.
- Scale leverage: Fidelity >$4 trillion AUM boosts negotiating power
- Supplier leverage: star funds/annuities can extract better fees
- Margin dynamics: curation and models favor higher-margin proprietary products
Concentrated suppliers (>70% data, top5 >80% vol); hyperscalers 31/23/11%; top mgr $4.2T; US 3.7%
Key suppliers (data/index providers >70% share, top‑5 venues >80% US equity volume, hyperscalers: AWS 31%/Azure 23%/GCP 11% in 2024) exert concentrated leverage; Fidelity’s ≈$4.2T AUM and scale mitigate but cannot eliminate supplier pricing, execution or talent risks (US unemployment ~3.7% 2024).
| Supplier | 2024 metric |
|---|---|
| Data/Indexes | >70% benchmarks |
| Exchanges/ATS | Top5 >80% volume |
| Hyperscalers | AWS31%/Azure23%/GCP11% |
| Fidelity scale | ≈$4.2T AUM |
What is included in the product
Detailed Word Document
Uncovers key drivers of competition, customer influence, supplier power, and market entry risks tailored to Fidelity Investments, identifying disruptive threats, substitutes, and strategic protections for market share.
Customizable Excel Spreadsheet
Fidelity's Porter's Five Forces one-sheet instantly clarifies competitive pressures for faster decisions, with customizable pressure levels and a clean radar chart for board-ready visuals; no macros required and easily swapped into your Excel dashboards or pitch decks to remove analysis friction.
Customers Bargaining Power
Price-sensitive retail investors
Zero-commission trading, standard since 2020, and fee transparency have increased retail investor leverage, letting customers quickly compare expense ratios and shift to low-cost index funds like Fidelity ZERO series (FZROX). Fidelity counters with no-fee funds, competitive cash-management yields, a polished UX and Active Trader Pro to reduce churn. Loyalty programs and integrated advising raise switching costs modestly.
Institutional clients and plan sponsors
Institutional clients and plan sponsors exert strong fee and service pressure on large mandates and 401(k) plans, with 2024 RFPs driving average fee concessions of roughly 10–25%. Fidelity’s scale—about $4.3 trillion in AUM/AA and roughly 22% recordkeeping market share in 2024—boosts win rates through broad service breadth and technology. Multi-year contracts (typically 3–7 years) create relationship stickiness that tempers buyer power.
High-net-worth and advisory clients
High-net-worth and advisory clients exert strong bargaining power because they can multi-home across custodians and demand tailored solutions; Fidelity reported about $11.1 trillion in client assets in 2024, underscoring the scale of competition for HNW flows. Performance transparency and tax-sensitive outcomes drive fee scrutiny and switching risk. Fidelity Private Wealth and exclusive alternatives access help defend pricing, while personalized planning and digital reporting deepen ties and moderate buyer leverage.
Low switching costs across platforms
Low switching costs: ACATS transfers typically settle in 3–6 business days and ETFs trade like stocks, enabling near-immediate portability; ubiquitous mobile apps (about 85% US smartphone penetration) further ease switching, while aggressive promotional cash/sign-up offers by rivals amplify buyer power. Fidelity counters with ecosystem lock-in via planning tools, cash-management and investor education, but growing data-portability efforts incrementally raise churn risk.
- ACATS: 3–6 business days
- ETF portability: tradable like stocks
- Mobile access: ~85% US smartphones
- Fidelity defenses: planning, cash mgmt, education
- Risk: rising data portability increases churn
Demand for yield and cash optimization
Rate cycles in 2023–2024 pushed short-term yields materially higher, with 3‑month Treasury and fed funds trading near the mid‑single digits, elevating client sensitivity to sweep and MMF yields and prompting rapid balance shifts to higher‑yield vehicles that compress Fidelity’s deposit spreads.
Fidelity’s scale in government and core MMFs (billions under management) plus treasury sweep options have helped retain assets, while transparent pricing and auto‑sweep defaults reduce defections.
- Higher short‑term yields ~mid‑single digits in 2024
- Rapid client flow into top‑yield MMFs
- Scale and auto‑sweep reduce churn
Scale versus client leverage: $4.3T AUM, 22% 401(k), 10–25% fee cuts
Customer bargaining power is high: retail zero‑commission trading and fee transparency enable quick switching; ACATS transfers settle in 3–6 business days and ETFs trade instantly. Institutional RFPs in 2024 drove ~10–25% fee concessions, but Fidelity’s scale (~$4.3T AUM/AA; ~22% 401(k) recordkeeping share) and advisory services create partial stickiness.
| Metric | 2024 |
|---|---|
| AUM/AA | $4.3T |
| 401(k) share | ~22% |
| RFP fee cuts | 10–25% |
| ACATS | 3–6 days |
Same Document Delivered
Fidelity Investments Porter's Five Forces Analysis
This preview presents the Fidelity Investments Porter's Five Forces analysis exactly as delivered—fully written, formatted, and ready for use. What you see is the same document you’ll receive instantly after purchase, with no placeholders or alterations. Use it immediately for research, strategy, or presentation needs.
Original: $10.00
-65%$10.00
$3.50Description
Don't Miss the Bigger Picture
Fidelity Investments faces intense competitive rivalry, evolving regulatory pressures, and shifting client bargaining power that shape its strategic playbook. Insights on supplier influence, substitute threats, and entry barriers reveal where advantage is earned or lost. This brief only scratches the surface—unlock the full Porter's Five Forces Analysis for detailed force ratings, visuals, and actionable strategy guidance.
Suppliers Bargaining Power
Concentrated market data and index licensors
Essential inputs like real-time market data and index licenses (e.g., MSCI, S&P) are controlled by a few providers that supply over 70% of widely used benchmarks, raising switching costs and recurring fees. Fidelity’s scale and $4–5T+ asset base in 2024 give negotiation leverage, but dependency remains for benchmarked products and ETFs. Price hikes or restrictive terms can compress product margins; multi-year contracts mitigate volatility but lock in costs.
Exchanges, liquidity venues, and counterparties
Order routing depends on major exchanges, ATSs, and market makers, with the top five US venues handling over 80% of displayed equity volume in 2024, concentrating supplier power. Best-execution and payment-for-order-flow dynamics have shifted unit economics, with retail PFOF still representing a material share of broker revenue. Fidelity’s internalization and broad routing reduce single-point exposure by redirecting flows across counterparties. During market stress, reliance on top-tier counterparties rises, increasing supplier leverage and execution risk.
Cloud, cybersecurity, and core tech vendors
Mission-critical cloud, cybersecurity and core software vendors are concentrated: in 2024 hyperscaler market shares were roughly AWS 31%, Microsoft Azure 23%, Google Cloud 11%, creating limited alternatives and high switching costs.
Deep integration and vendor risk management create stickiness; FedRAMP, SOC 2 and ISO requirements raise qualification thresholds, narrowing vetted supplier pools.
Fidelity’s substantial in-house tech reduces dependence but cannot replace hyperscaler scale, global footprint, or managed security capabilities.
Talent and specialized advisory expertise
Highly skilled portfolio managers, quants, and advisors act as scarce suppliers of human capital, raising bargaining power amid a tight US labor market (unemployment ~3.7% in 2024) and rising performance-linked pay; Fidelity’s scale (≈$4.2 trillion AUM in 2024) and career paths help attract and retain talent, but turnover risks can still hurt fund performance and client retention.
- Scarcity: high-demand quants/PMs
- Labor: US unemployment ~3.7% (2024)
- Fidelity scale: ≈$4.2T AUM (2024)
- Risk: turnover → performance/client loss
Third-party asset managers and product manufacturers
Open-architecture platforms carry third-party funds and annuities whose providers can influence shelf fees and revenue sharing; Fidelity, with over $4 trillion in assets under management, uses distribution scale to secure preferred economics. However, unique or star products can still command premium terms from the supplier side. Platform curation and model portfolio design shift margin mix toward proprietary or higher-fee offerings.
- Scale leverage: Fidelity >$4 trillion AUM boosts negotiating power
- Supplier leverage: star funds/annuities can extract better fees
- Margin dynamics: curation and models favor higher-margin proprietary products
Concentrated suppliers (>70% data, top5 >80% vol); hyperscalers 31/23/11%; top mgr $4.2T; US 3.7%
Key suppliers (data/index providers >70% share, top‑5 venues >80% US equity volume, hyperscalers: AWS 31%/Azure 23%/GCP 11% in 2024) exert concentrated leverage; Fidelity’s ≈$4.2T AUM and scale mitigate but cannot eliminate supplier pricing, execution or talent risks (US unemployment ~3.7% 2024).
| Supplier | 2024 metric |
|---|---|
| Data/Indexes | >70% benchmarks |
| Exchanges/ATS | Top5 >80% volume |
| Hyperscalers | AWS31%/Azure23%/GCP11% |
| Fidelity scale | ≈$4.2T AUM |
What is included in the product
Detailed Word Document
Uncovers key drivers of competition, customer influence, supplier power, and market entry risks tailored to Fidelity Investments, identifying disruptive threats, substitutes, and strategic protections for market share.
Customizable Excel Spreadsheet
Fidelity's Porter's Five Forces one-sheet instantly clarifies competitive pressures for faster decisions, with customizable pressure levels and a clean radar chart for board-ready visuals; no macros required and easily swapped into your Excel dashboards or pitch decks to remove analysis friction.
Customers Bargaining Power
Price-sensitive retail investors
Zero-commission trading, standard since 2020, and fee transparency have increased retail investor leverage, letting customers quickly compare expense ratios and shift to low-cost index funds like Fidelity ZERO series (FZROX). Fidelity counters with no-fee funds, competitive cash-management yields, a polished UX and Active Trader Pro to reduce churn. Loyalty programs and integrated advising raise switching costs modestly.
Institutional clients and plan sponsors
Institutional clients and plan sponsors exert strong fee and service pressure on large mandates and 401(k) plans, with 2024 RFPs driving average fee concessions of roughly 10–25%. Fidelity’s scale—about $4.3 trillion in AUM/AA and roughly 22% recordkeeping market share in 2024—boosts win rates through broad service breadth and technology. Multi-year contracts (typically 3–7 years) create relationship stickiness that tempers buyer power.
High-net-worth and advisory clients
High-net-worth and advisory clients exert strong bargaining power because they can multi-home across custodians and demand tailored solutions; Fidelity reported about $11.1 trillion in client assets in 2024, underscoring the scale of competition for HNW flows. Performance transparency and tax-sensitive outcomes drive fee scrutiny and switching risk. Fidelity Private Wealth and exclusive alternatives access help defend pricing, while personalized planning and digital reporting deepen ties and moderate buyer leverage.
Low switching costs across platforms
Low switching costs: ACATS transfers typically settle in 3–6 business days and ETFs trade like stocks, enabling near-immediate portability; ubiquitous mobile apps (about 85% US smartphone penetration) further ease switching, while aggressive promotional cash/sign-up offers by rivals amplify buyer power. Fidelity counters with ecosystem lock-in via planning tools, cash-management and investor education, but growing data-portability efforts incrementally raise churn risk.
- ACATS: 3–6 business days
- ETF portability: tradable like stocks
- Mobile access: ~85% US smartphones
- Fidelity defenses: planning, cash mgmt, education
- Risk: rising data portability increases churn
Demand for yield and cash optimization
Rate cycles in 2023–2024 pushed short-term yields materially higher, with 3‑month Treasury and fed funds trading near the mid‑single digits, elevating client sensitivity to sweep and MMF yields and prompting rapid balance shifts to higher‑yield vehicles that compress Fidelity’s deposit spreads.
Fidelity’s scale in government and core MMFs (billions under management) plus treasury sweep options have helped retain assets, while transparent pricing and auto‑sweep defaults reduce defections.
- Higher short‑term yields ~mid‑single digits in 2024
- Rapid client flow into top‑yield MMFs
- Scale and auto‑sweep reduce churn
Scale versus client leverage: $4.3T AUM, 22% 401(k), 10–25% fee cuts
Customer bargaining power is high: retail zero‑commission trading and fee transparency enable quick switching; ACATS transfers settle in 3–6 business days and ETFs trade instantly. Institutional RFPs in 2024 drove ~10–25% fee concessions, but Fidelity’s scale (~$4.3T AUM/AA; ~22% 401(k) recordkeeping share) and advisory services create partial stickiness.
| Metric | 2024 |
|---|---|
| AUM/AA | $4.3T |
| 401(k) share | ~22% |
| RFP fee cuts | 10–25% |
| ACATS | 3–6 days |
Same Document Delivered
Fidelity Investments Porter's Five Forces Analysis
This preview presents the Fidelity Investments Porter's Five Forces analysis exactly as delivered—fully written, formatted, and ready for use. What you see is the same document you’ll receive instantly after purchase, with no placeholders or alterations. Use it immediately for research, strategy, or presentation needs.











