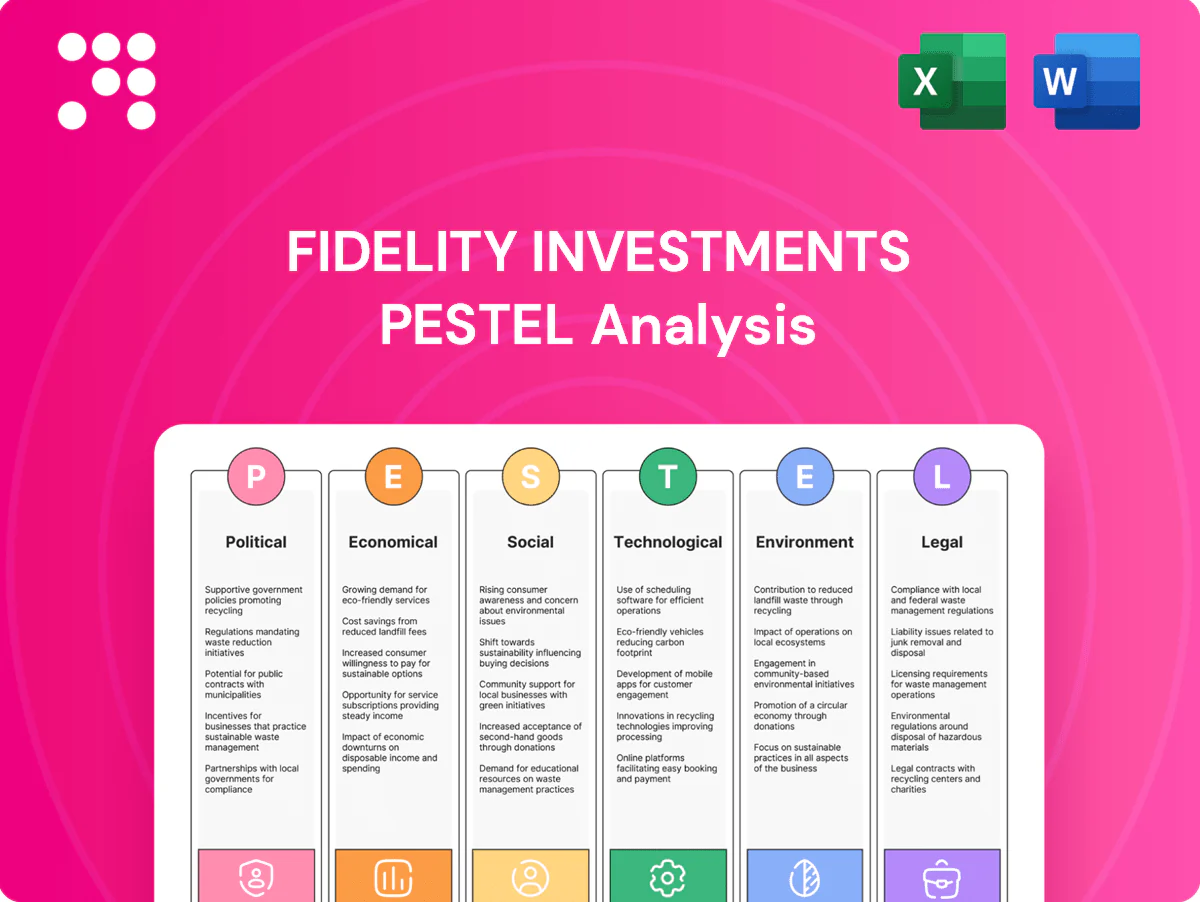
Fidelity Investments PESTLE Analysis

Make Smarter Strategic Decisions with a Complete PESTEL View
Unlock strategic advantage with our PESTLE Analysis of Fidelity Investments—concise, research-backed insights on political, economic, social, technological, legal, and environmental forces shaping its future. Ideal for investors and strategists, this ready-to-use report reveals risks and opportunities. Purchase the full analysis for the actionable intelligence you need today.
Political factors

Regulatory policy shifts
Changes in U.S. and global financial regulations — notably the SEC money-market reforms finalized in 2023 and ongoing EU MiFID/MiFIR updates — reshape product design, disclosures and capital requirements. Policy priorities of administrations alter fiduciary rule emphasis and retirement guidance, with U.S. retirement assets exceeding $35 trillion in 2024. Cross-border operations face divergent U.S./EU regulatory philosophies; proactive monitoring and advocacy reduce operational disruption.
Geopolitical tensions
Geopolitical conflicts, sanctions and trade restrictions reshape capital flows and drive market volatility, constraining investment universes and forcing rapid updates to compliance lists across over 30 major sanctions regimes. Emerging-market exposure demands near real-time screening to avoid sanctioned entities, while heightened tensions increase client risk aversion, lowering trading volumes and reallocations. Fidelity, with roughly $4.4 trillion AUM in 2024, relies on scenario planning to sustain service continuity and liquidity management.

Public retirement policy
Government moves on Social Security (trust fund depletion projected 2033), expanded auto-enrollment (adoption ~60% of large 401(k) plans per 2024 industry reports) and SECURE 2.0 IRA/RMD changes materially drive participant inflows and plan design. Tax incentives and roughly 13 state auto-IRA mandates plus DC reshape addressable markets. Changes to contribution limits and heightened fiduciary duties push plan sponsors to alter offerings; Fidelity must upgrade recordkeeping and advisory services to capture flows.

Tax regime dynamics
Adjustments to capital gains, dividend and corporate tax rates (US top long-term gains 20% plus 3.8% NIIT = 23.8%; federal corporate tax 21%) shift Fidelity fund tilts, realization timing and client asset allocation, with taxable accounts showing higher turnover sensitivity. Global tax cooperation (CRS/FATCA; now in over 100 jurisdictions) increases cross-border reporting and compliance costs. Preferential retirement-account tax treatment (401(k) elective deferral $23,000 in 2025) drives packaged IRAs/roth strategies and makes tax-aware tools a competitive differentiator.
- Capital gains/dividend rate shifts alter fund strategy and investor behavior
- CRS/FATCA in 100+ jurisdictions raises reporting complexity
- Retirement account perks (401(k) $23,000 2025) boost packaged products
- Tax-aware tools = competitive edge
Government cybersecurity posture
Government cybersecurity directives and sector guidance (eg US National Cybersecurity Strategy and CISA directives) raise baseline controls for firms like Fidelity, driving adoption of zero trust and stricter third‑party risk rules. Public‑private threat intel sharing via FS‑ISAC (7,000+ members) and CISA programs improves detection and response. Compliance with critical‑infrastructure expectations forces capital and OPEX investments; IBM reported average financial‑services breach cost $5.97M (2023), making alignment key to reducing post‑incident regulatory risk.
- tag:regulatory-cost — average breach cost $5.97M (IBM 2023)
- tag:intel-sharing — FS‑ISAC 7,000+ members
- tag:investment — higher capex/opex to meet critical‑infra expectations
Regulatory, tax and sanctions shifts force asset managers to revamp products, disclosure, security
Regulatory shifts (SEC 2023 MM reforms, MiFID updates) plus tax changes (top LT gain ~23.8%; 401(k) $23,000 in 2025) force product, disclosure and tax-aware tool changes. Geopolitics and 30+ sanctions regimes raise compliance and liquidity planning for Fidelity (AUM ~$4.4T, 2024). Cyber directives increase security spend; avg breach cost $5.97M (2023).
| tag | metric |
|---|---|
| assets | $4.4T (2024) |
| sanctions | 30+ regimes |
| breach_cost | $5.97M (2023) |
What is included in the product
 Detailed Word Document
Explores how macro-environmental factors uniquely affect Fidelity Investments across six dimensions—Political, Economic, Social, Technological, Environmental, and Legal—backed by current data and trends to reveal threats and opportunities. Designed for executives and advisors, the analysis reflects real market and regulatory dynamics and offers forward-looking insights for scenario planning and strategic action.

 Customizable Excel Spreadsheet
A concise, visually segmented PESTLE summary of Fidelity Investments that can be dropped into presentations or shared across teams, enabling quick interpretation of external risks and market positioning while allowing users to add region- or business-specific notes for fast alignment.
Economic factors

Interest rate cycles
Rate paths drive fixed-income pricing, equity valuations, and client allocation shifts; with the Fed funds rate near 5.25% and the 10-year Treasury around 4.2% (July 2025), duration and valuation models repriced across portfolios. Higher rates have raised cash-sweep yields but pressured bond prices and fee-sensitive flows. Margin lending, net interest income, and money-market competitiveness vary with policy, making dynamic asset-liability management essential.
Market volatility
Market volatility drives higher trading volumes and options activity while raising risk‑management costs; Fidelity, with roughly $4.3 trillion in customer assets (2024), faces fee-revenue pressure during prolonged drawdowns that can shrink AUM. Short, sharp spikes typically boost brokerage and execution revenue as clients trade more, whereas sustained turbulence pushes flows toward passive, defensive strategies. Robust liquidity and execution quality are key retention tools that mitigate outflows and preserve client relationships.

Labor and wage trends
Tight labor markets—U.S. unemployment averaged about 3.7% in 2024—are driving up compensation for advisors, technologists and compliance staff at Fidelity, raising operating costs. Competition from well-funded fintechs and big tech for scarce talent compresses margins. Investment in productivity tools and selective automation has begun to offset wage inflation. Strategic workforce planning stabilizes service quality during scaling.

Global growth dispersion
Divergent regional growth and inflation—IMF global growth ~3.0% in 2024, China ~5.2% and India ~7.8%, with US CPI ~3.4%—reshapes currency risks and asset-allocation opportunities for Fidelity.
Institutional mandates may shift to resilient geographies while emerging-market expansions increase distribution and compliance demands; deeper regional research enables granular positioning.
- growth: IMF 2024 ~3.0%
- China/India: ~5.2%/7.8%
- US inflation: ~3.4%
- implication: rebalancing, EM compliance, research-led tilts
Household savings rates
Household savings rates drive flows into IRAs, 401(k)s and brokerage accounts; US personal saving rate fell to about 3.4% in 2023 and averaged roughly 3.5% in 2024, weighing on new contributions but boosting withdrawals into cash. Higher savings during uncertainty typically favors cash and conservative bond funds, while improved financial literacy and auto-enrollment lift persistent contributions. Fidelity’s broad product set positions it to capture differing risk appetites across rising or falling savings patterns.
- 3.4% personal saving rate (2023)
- ~3.5% average (2024)
- Auto-features raise steady contribution rates
- Product breadth captures conservative to aggressive flows
Regulatory, tax and sanctions shifts force asset managers to revamp products, disclosure, security
Rate moves (Fed funds ~5.25%, 10y ~4.2% July 2025) reprice duration and cash yields, pressuring bond marks and fee-sensitive flows. Market volatility lifts trading revenue but can shrink AUM (Fidelity ~$4.3T, 2024) during prolonged drawdowns. Tight labor (U.S. unemployment ~3.7% 2024) raises staffing costs while automation offsets some pressures. Global growth (IMF 2024 ~3.0%; China 5.2%; India 7.8%) shifts allocation and compliance needs.
| Metric | Value |
|---|---|
| Fed funds | ~5.25% (Jul 2025) |
| 10‑yr Treasury | ~4.2% (Jul 2025) |
| Fidelity AUM | $4.3T (2024) |
| US unemployment | ~3.7% (2024) |
| IMF global growth | ~3.0% (2024) |
| US CPI | ~3.4% |
| Personal saving rate | ~3.5% (2024) |
Preview Before You Purchase
Fidelity Investments PESTLE Analysis
The Fidelity Investments PESTLE Analysis preview shown here is the exact document you’ll receive after purchase—fully formatted, professionally structured, and ready to use. This is the real file with complete content and no placeholders. After payment you’ll download this same final report immediately.

Make Smarter Strategic Decisions with a Complete PESTEL View
Unlock strategic advantage with our PESTLE Analysis of Fidelity Investments—concise, research-backed insights on political, economic, social, technological, legal, and environmental forces shaping its future. Ideal for investors and strategists, this ready-to-use report reveals risks and opportunities. Purchase the full analysis for the actionable intelligence you need today.
Political factors
Regulatory policy shifts
Changes in U.S. and global financial regulations — notably the SEC money-market reforms finalized in 2023 and ongoing EU MiFID/MiFIR updates — reshape product design, disclosures and capital requirements. Policy priorities of administrations alter fiduciary rule emphasis and retirement guidance, with U.S. retirement assets exceeding $35 trillion in 2024. Cross-border operations face divergent U.S./EU regulatory philosophies; proactive monitoring and advocacy reduce operational disruption.
Geopolitical tensions
Geopolitical conflicts, sanctions and trade restrictions reshape capital flows and drive market volatility, constraining investment universes and forcing rapid updates to compliance lists across over 30 major sanctions regimes. Emerging-market exposure demands near real-time screening to avoid sanctioned entities, while heightened tensions increase client risk aversion, lowering trading volumes and reallocations. Fidelity, with roughly $4.4 trillion AUM in 2024, relies on scenario planning to sustain service continuity and liquidity management.
Public retirement policy
Government moves on Social Security (trust fund depletion projected 2033), expanded auto-enrollment (adoption ~60% of large 401(k) plans per 2024 industry reports) and SECURE 2.0 IRA/RMD changes materially drive participant inflows and plan design. Tax incentives and roughly 13 state auto-IRA mandates plus DC reshape addressable markets. Changes to contribution limits and heightened fiduciary duties push plan sponsors to alter offerings; Fidelity must upgrade recordkeeping and advisory services to capture flows.
Tax regime dynamics
Adjustments to capital gains, dividend and corporate tax rates (US top long-term gains 20% plus 3.8% NIIT = 23.8%; federal corporate tax 21%) shift Fidelity fund tilts, realization timing and client asset allocation, with taxable accounts showing higher turnover sensitivity. Global tax cooperation (CRS/FATCA; now in over 100 jurisdictions) increases cross-border reporting and compliance costs. Preferential retirement-account tax treatment (401(k) elective deferral $23,000 in 2025) drives packaged IRAs/roth strategies and makes tax-aware tools a competitive differentiator.
- Capital gains/dividend rate shifts alter fund strategy and investor behavior
- CRS/FATCA in 100+ jurisdictions raises reporting complexity
- Retirement account perks (401(k) $23,000 2025) boost packaged products
- Tax-aware tools = competitive edge
Government cybersecurity posture
Government cybersecurity directives and sector guidance (eg US National Cybersecurity Strategy and CISA directives) raise baseline controls for firms like Fidelity, driving adoption of zero trust and stricter third‑party risk rules. Public‑private threat intel sharing via FS‑ISAC (7,000+ members) and CISA programs improves detection and response. Compliance with critical‑infrastructure expectations forces capital and OPEX investments; IBM reported average financial‑services breach cost $5.97M (2023), making alignment key to reducing post‑incident regulatory risk.
- tag:regulatory-cost — average breach cost $5.97M (IBM 2023)
- tag:intel-sharing — FS‑ISAC 7,000+ members
- tag:investment — higher capex/opex to meet critical‑infra expectations
Regulatory, tax and sanctions shifts force asset managers to revamp products, disclosure, security
Regulatory shifts (SEC 2023 MM reforms, MiFID updates) plus tax changes (top LT gain ~23.8%; 401(k) $23,000 in 2025) force product, disclosure and tax-aware tool changes. Geopolitics and 30+ sanctions regimes raise compliance and liquidity planning for Fidelity (AUM ~$4.4T, 2024). Cyber directives increase security spend; avg breach cost $5.97M (2023).
| tag | metric |
|---|---|
| assets | $4.4T (2024) |
| sanctions | 30+ regimes |
| breach_cost | $5.97M (2023) |
What is included in the product
Detailed Word Document
Explores how macro-environmental factors uniquely affect Fidelity Investments across six dimensions—Political, Economic, Social, Technological, Environmental, and Legal—backed by current data and trends to reveal threats and opportunities. Designed for executives and advisors, the analysis reflects real market and regulatory dynamics and offers forward-looking insights for scenario planning and strategic action.
Customizable Excel Spreadsheet
A concise, visually segmented PESTLE summary of Fidelity Investments that can be dropped into presentations or shared across teams, enabling quick interpretation of external risks and market positioning while allowing users to add region- or business-specific notes for fast alignment.
Economic factors
Interest rate cycles
Rate paths drive fixed-income pricing, equity valuations, and client allocation shifts; with the Fed funds rate near 5.25% and the 10-year Treasury around 4.2% (July 2025), duration and valuation models repriced across portfolios. Higher rates have raised cash-sweep yields but pressured bond prices and fee-sensitive flows. Margin lending, net interest income, and money-market competitiveness vary with policy, making dynamic asset-liability management essential.
Market volatility
Market volatility drives higher trading volumes and options activity while raising risk‑management costs; Fidelity, with roughly $4.3 trillion in customer assets (2024), faces fee-revenue pressure during prolonged drawdowns that can shrink AUM. Short, sharp spikes typically boost brokerage and execution revenue as clients trade more, whereas sustained turbulence pushes flows toward passive, defensive strategies. Robust liquidity and execution quality are key retention tools that mitigate outflows and preserve client relationships.
Labor and wage trends
Tight labor markets—U.S. unemployment averaged about 3.7% in 2024—are driving up compensation for advisors, technologists and compliance staff at Fidelity, raising operating costs. Competition from well-funded fintechs and big tech for scarce talent compresses margins. Investment in productivity tools and selective automation has begun to offset wage inflation. Strategic workforce planning stabilizes service quality during scaling.
Global growth dispersion
Divergent regional growth and inflation—IMF global growth ~3.0% in 2024, China ~5.2% and India ~7.8%, with US CPI ~3.4%—reshapes currency risks and asset-allocation opportunities for Fidelity.
Institutional mandates may shift to resilient geographies while emerging-market expansions increase distribution and compliance demands; deeper regional research enables granular positioning.
- growth: IMF 2024 ~3.0%
- China/India: ~5.2%/7.8%
- US inflation: ~3.4%
- implication: rebalancing, EM compliance, research-led tilts
Household savings rates
Household savings rates drive flows into IRAs, 401(k)s and brokerage accounts; US personal saving rate fell to about 3.4% in 2023 and averaged roughly 3.5% in 2024, weighing on new contributions but boosting withdrawals into cash. Higher savings during uncertainty typically favors cash and conservative bond funds, while improved financial literacy and auto-enrollment lift persistent contributions. Fidelity’s broad product set positions it to capture differing risk appetites across rising or falling savings patterns.
- 3.4% personal saving rate (2023)
- ~3.5% average (2024)
- Auto-features raise steady contribution rates
- Product breadth captures conservative to aggressive flows
Regulatory, tax and sanctions shifts force asset managers to revamp products, disclosure, security
Rate moves (Fed funds ~5.25%, 10y ~4.2% July 2025) reprice duration and cash yields, pressuring bond marks and fee-sensitive flows. Market volatility lifts trading revenue but can shrink AUM (Fidelity ~$4.3T, 2024) during prolonged drawdowns. Tight labor (U.S. unemployment ~3.7% 2024) raises staffing costs while automation offsets some pressures. Global growth (IMF 2024 ~3.0%; China 5.2%; India 7.8%) shifts allocation and compliance needs.
| Metric | Value |
|---|---|
| Fed funds | ~5.25% (Jul 2025) |
| 10‑yr Treasury | ~4.2% (Jul 2025) |
| Fidelity AUM | $4.3T (2024) |
| US unemployment | ~3.7% (2024) |
| IMF global growth | ~3.0% (2024) |
| US CPI | ~3.4% |
| Personal saving rate | ~3.5% (2024) |
Preview Before You Purchase
Fidelity Investments PESTLE Analysis
The Fidelity Investments PESTLE Analysis preview shown here is the exact document you’ll receive after purchase—fully formatted, professionally structured, and ready to use. This is the real file with complete content and no placeholders. After payment you’ll download this same final report immediately.
Description
Make Smarter Strategic Decisions with a Complete PESTEL View
Unlock strategic advantage with our PESTLE Analysis of Fidelity Investments—concise, research-backed insights on political, economic, social, technological, legal, and environmental forces shaping its future. Ideal for investors and strategists, this ready-to-use report reveals risks and opportunities. Purchase the full analysis for the actionable intelligence you need today.
Political factors
Regulatory policy shifts
Changes in U.S. and global financial regulations — notably the SEC money-market reforms finalized in 2023 and ongoing EU MiFID/MiFIR updates — reshape product design, disclosures and capital requirements. Policy priorities of administrations alter fiduciary rule emphasis and retirement guidance, with U.S. retirement assets exceeding $35 trillion in 2024. Cross-border operations face divergent U.S./EU regulatory philosophies; proactive monitoring and advocacy reduce operational disruption.
Geopolitical tensions
Geopolitical conflicts, sanctions and trade restrictions reshape capital flows and drive market volatility, constraining investment universes and forcing rapid updates to compliance lists across over 30 major sanctions regimes. Emerging-market exposure demands near real-time screening to avoid sanctioned entities, while heightened tensions increase client risk aversion, lowering trading volumes and reallocations. Fidelity, with roughly $4.4 trillion AUM in 2024, relies on scenario planning to sustain service continuity and liquidity management.
Public retirement policy
Government moves on Social Security (trust fund depletion projected 2033), expanded auto-enrollment (adoption ~60% of large 401(k) plans per 2024 industry reports) and SECURE 2.0 IRA/RMD changes materially drive participant inflows and plan design. Tax incentives and roughly 13 state auto-IRA mandates plus DC reshape addressable markets. Changes to contribution limits and heightened fiduciary duties push plan sponsors to alter offerings; Fidelity must upgrade recordkeeping and advisory services to capture flows.
Tax regime dynamics
Adjustments to capital gains, dividend and corporate tax rates (US top long-term gains 20% plus 3.8% NIIT = 23.8%; federal corporate tax 21%) shift Fidelity fund tilts, realization timing and client asset allocation, with taxable accounts showing higher turnover sensitivity. Global tax cooperation (CRS/FATCA; now in over 100 jurisdictions) increases cross-border reporting and compliance costs. Preferential retirement-account tax treatment (401(k) elective deferral $23,000 in 2025) drives packaged IRAs/roth strategies and makes tax-aware tools a competitive differentiator.
- Capital gains/dividend rate shifts alter fund strategy and investor behavior
- CRS/FATCA in 100+ jurisdictions raises reporting complexity
- Retirement account perks (401(k) $23,000 2025) boost packaged products
- Tax-aware tools = competitive edge
Government cybersecurity posture
Government cybersecurity directives and sector guidance (eg US National Cybersecurity Strategy and CISA directives) raise baseline controls for firms like Fidelity, driving adoption of zero trust and stricter third‑party risk rules. Public‑private threat intel sharing via FS‑ISAC (7,000+ members) and CISA programs improves detection and response. Compliance with critical‑infrastructure expectations forces capital and OPEX investments; IBM reported average financial‑services breach cost $5.97M (2023), making alignment key to reducing post‑incident regulatory risk.
- tag:regulatory-cost — average breach cost $5.97M (IBM 2023)
- tag:intel-sharing — FS‑ISAC 7,000+ members
- tag:investment — higher capex/opex to meet critical‑infra expectations
Regulatory, tax and sanctions shifts force asset managers to revamp products, disclosure, security
Regulatory shifts (SEC 2023 MM reforms, MiFID updates) plus tax changes (top LT gain ~23.8%; 401(k) $23,000 in 2025) force product, disclosure and tax-aware tool changes. Geopolitics and 30+ sanctions regimes raise compliance and liquidity planning for Fidelity (AUM ~$4.4T, 2024). Cyber directives increase security spend; avg breach cost $5.97M (2023).
| tag | metric |
|---|---|
| assets | $4.4T (2024) |
| sanctions | 30+ regimes |
| breach_cost | $5.97M (2023) |
What is included in the product
Detailed Word Document
Explores how macro-environmental factors uniquely affect Fidelity Investments across six dimensions—Political, Economic, Social, Technological, Environmental, and Legal—backed by current data and trends to reveal threats and opportunities. Designed for executives and advisors, the analysis reflects real market and regulatory dynamics and offers forward-looking insights for scenario planning and strategic action.
Customizable Excel Spreadsheet
A concise, visually segmented PESTLE summary of Fidelity Investments that can be dropped into presentations or shared across teams, enabling quick interpretation of external risks and market positioning while allowing users to add region- or business-specific notes for fast alignment.
Economic factors
Interest rate cycles
Rate paths drive fixed-income pricing, equity valuations, and client allocation shifts; with the Fed funds rate near 5.25% and the 10-year Treasury around 4.2% (July 2025), duration and valuation models repriced across portfolios. Higher rates have raised cash-sweep yields but pressured bond prices and fee-sensitive flows. Margin lending, net interest income, and money-market competitiveness vary with policy, making dynamic asset-liability management essential.
Market volatility
Market volatility drives higher trading volumes and options activity while raising risk‑management costs; Fidelity, with roughly $4.3 trillion in customer assets (2024), faces fee-revenue pressure during prolonged drawdowns that can shrink AUM. Short, sharp spikes typically boost brokerage and execution revenue as clients trade more, whereas sustained turbulence pushes flows toward passive, defensive strategies. Robust liquidity and execution quality are key retention tools that mitigate outflows and preserve client relationships.
Labor and wage trends
Tight labor markets—U.S. unemployment averaged about 3.7% in 2024—are driving up compensation for advisors, technologists and compliance staff at Fidelity, raising operating costs. Competition from well-funded fintechs and big tech for scarce talent compresses margins. Investment in productivity tools and selective automation has begun to offset wage inflation. Strategic workforce planning stabilizes service quality during scaling.
Global growth dispersion
Divergent regional growth and inflation—IMF global growth ~3.0% in 2024, China ~5.2% and India ~7.8%, with US CPI ~3.4%—reshapes currency risks and asset-allocation opportunities for Fidelity.
Institutional mandates may shift to resilient geographies while emerging-market expansions increase distribution and compliance demands; deeper regional research enables granular positioning.
- growth: IMF 2024 ~3.0%
- China/India: ~5.2%/7.8%
- US inflation: ~3.4%
- implication: rebalancing, EM compliance, research-led tilts
Household savings rates
Household savings rates drive flows into IRAs, 401(k)s and brokerage accounts; US personal saving rate fell to about 3.4% in 2023 and averaged roughly 3.5% in 2024, weighing on new contributions but boosting withdrawals into cash. Higher savings during uncertainty typically favors cash and conservative bond funds, while improved financial literacy and auto-enrollment lift persistent contributions. Fidelity’s broad product set positions it to capture differing risk appetites across rising or falling savings patterns.
- 3.4% personal saving rate (2023)
- ~3.5% average (2024)
- Auto-features raise steady contribution rates
- Product breadth captures conservative to aggressive flows
Regulatory, tax and sanctions shifts force asset managers to revamp products, disclosure, security
Rate moves (Fed funds ~5.25%, 10y ~4.2% July 2025) reprice duration and cash yields, pressuring bond marks and fee-sensitive flows. Market volatility lifts trading revenue but can shrink AUM (Fidelity ~$4.3T, 2024) during prolonged drawdowns. Tight labor (U.S. unemployment ~3.7% 2024) raises staffing costs while automation offsets some pressures. Global growth (IMF 2024 ~3.0%; China 5.2%; India 7.8%) shifts allocation and compliance needs.
| Metric | Value |
|---|---|
| Fed funds | ~5.25% (Jul 2025) |
| 10‑yr Treasury | ~4.2% (Jul 2025) |
| Fidelity AUM | $4.3T (2024) |
| US unemployment | ~3.7% (2024) |
| IMF global growth | ~3.0% (2024) |
| US CPI | ~3.4% |
| Personal saving rate | ~3.5% (2024) |
Preview Before You Purchase
Fidelity Investments PESTLE Analysis
The Fidelity Investments PESTLE Analysis preview shown here is the exact document you’ll receive after purchase—fully formatted, professionally structured, and ready to use. This is the real file with complete content and no placeholders. After payment you’ll download this same final report immediately.











