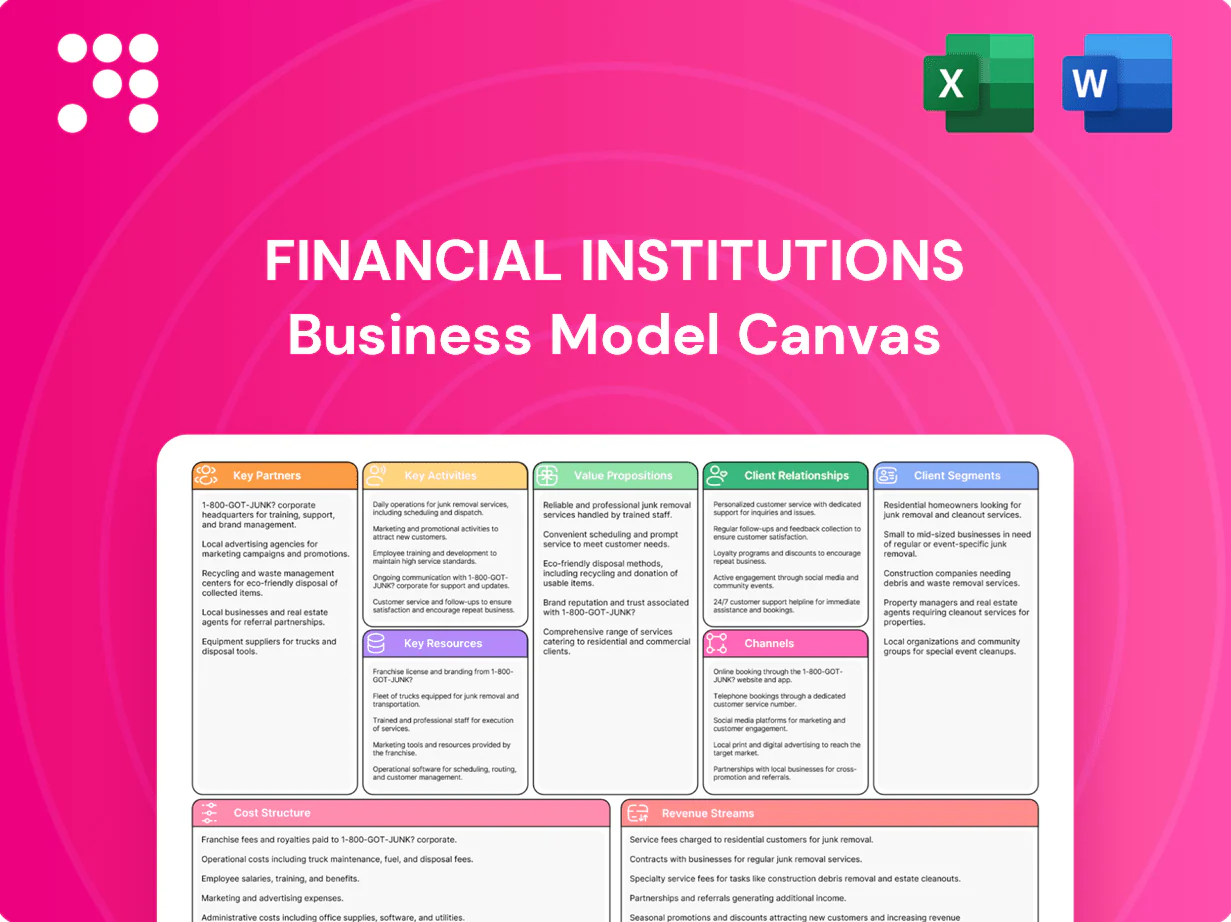
Financial Institutions Business Model Canvas

Financial Institutions Business Model Canvas: Clear Strategy for Investors & Founders
Unlock the strategic blueprint behind Financial Institutions with our Business Model Canvas—three to five clear sections map value propositions, customer segments, key partners, revenue streams and cost structure. Ideal for investors, consultants and founders seeking actionable insights. Download the full Word and Excel canvas to benchmark, adapt and execute faster.
Partnerships

Core tech and fintech providers
Partnerships with core banking platforms, digital banking vendors and cybersecurity providers enable scalable, secure delivery across banking, insurance and investments; in 2024 many institutions target 99.9%+ vendor SLAs to meet regulatory uptime. Fintech integrations power mobile features, digital account opening (adoption often >80%) and real-time payments, while co-innovation can cut product time-to-market by up to 40%.
Payment networks and processors
Relationships with card networks and processors enable debit/credit issuance, routing of interchange (typically 1–3% per transaction) and layered fraud controls; major networks each route trillions in annual payment volume (>$10T range).
These partners expand merchant acceptance and consumer utility, while integrated dispute management cuts chargebacks and settlement losses and improves CX; global card fraud losses remain on the order of ~$35B (Nilson, 2023).
Network incentives, rebates and routing optimizations can improve unit economics by several basis points, materially boosting net margin on volume-driven products.

Insurance carriers and underwriters
As of 2024 SDN Insurance Agency relies on carrier panels to provide breadth across P&C, life, and specialty lines; direct underwriter access enables competitive pricing and tailored retail and commercial policies. Revenue-sharing and commission structures—typical P&C commissions around 10–15%—align incentives with carriers. Strong carrier relationships speed placement and bolster claims support, improving service and retention.

Custodians, broker-dealers, and asset managers
Courier Capital and HNP Capital rely on custodians, broker-dealers and asset managers for safekeeping and trade execution, leveraging open-architecture access to third-party funds and SMAs to broaden product choice; custodians held roughly $95 trillion in assets under custody globally in 2024, underpinning scale and liquidity.
- Shared compliance & best-execution frameworks
- Open-architecture product access (third-party funds, SMAs)
- Research integration to enhance portfolio construction
Regulators, community orgs, and referral networks
Close coordination with banking regulators ensures safety, soundness and compliance, aligning institutions with 2024 supervisory priorities as US banking sector assets reached about $27 trillion, reducing exam risk and liquidity strain. Community groups and centers of influence bolster CRA lending and local deposit growth; CPA and law firm referrals drive wealth and commercial pipelines, while educational partnerships improve financial literacy and brand trust.
- Regulators: align to 2024 supervisory priorities
- Community orgs: strengthen CRA lending
- CPA/law referrals: feed wealth/commercial pipelines
- Education partners: boost literacy and trust
99.9% uptime, >80% digital adoption; custodians $95T, card fraud $35B
Core banking, fintech and cybersecurity partners enable 99.9%+ uptime and digital account adoption >80%, cutting time-to-market by ~40%. Card networks drive interchange (1–3%) and cover >$10T in annual flows while global card fraud was ~$35B (2023). Custodians held ~$95T AUC in 2024; US banking assets ~ $27T, underpinning liquidity and regulatory coordination.
| Partner | Key metric (2024) |
|---|---|
| Core platforms | 99.9% SLA, >80% digital adoption |
| Card networks | Interchange 1–3%, >$10T volume |
| Custodians | $95T AUC |
What is included in the product
 Detailed Word Document
A tailored Financial Institutions Business Model Canvas detailing customer segments, channels, value propositions, revenue streams, cost structure and key resources/partners across the 9 BMC blocks, with SWOT and competitive-advantage analysis for presentations and strategic decision-making.

 Customizable Excel Spreadsheet
High-level snapshot of a financial institution’s business model with editable cells to quickly pinpoint revenue drivers, risk centers, and regulatory levers.
Activities

Deposit gathering and liquidity management
Five Star Bank attracts and retains consumer and business deposits to fund lending, targeting a loan-to-deposit ratio near 75% in 2024 to balance growth and resilience. Pricing, targeted promotions and treasury solutions are used to grow core deposits while controlling cost of funds. Liquidity buffers are managed within policy and regulatory requirements, and cash management tools (ACH, sweep, remote deposit) enhance customer stickiness.
Credit origination and portfolio management
Underwriting consumer, small business, commercial and real estate loans is core, with US commercial bank loans and leases totaling about $12.7 trillion at end-2024. Ongoing monitoring, renewals and workouts sustain risk-adjusted returns and kept industry nonperforming loan ratios near 0.9% in 2024. Concentration limits, pricing discipline and collateral controls protect capital. Secondary sales and participations—including securitizations—help optimize the balance sheet mix.

Wealth and investment advisory
Courier Capital and HNP Capital deliver planning, discretionary management, and advisory services, operating within a global wealth-management market that exceeded $100 trillion in 2024. Investment policy, rigorous due diligence, and systematic rebalancing drive client outcomes and performance attribution. Regular client reviews align goals with strategy and risk tolerance. Robust compliance and fiduciary oversight underpin client trust.

Insurance brokerage and risk placement
SDN Insurance Agency assesses client exposures and matches them with carriers for optimal coverage and pricing, leveraging market access amid global insurance premiums exceeding $6 trillion in 2024. Policy placement, renewals, and hands-on claims support drive high retention and steady revenue. Cross-sell with banking products boosts client lifetime value while data-driven remarketing preserves competitiveness.
- exposure assessment to carrier matching
- policy placement, renewals, claims = retention
- banking cross-sell enhances LTV
- data-driven remarketing sustains market edge
Risk, compliance, and cybersecurity
Enterprise risk management covers credit, market, liquidity, operational and conduct risks with limits, stress testing and capital planning; BSA/AML, KYC and privacy controls meet regulatory standards while testing, audits and training sustain a strong control environment. Cyber defense and resilience protect customer data and uptime — the financial sector average data breach cost was $5.97M in 2024 (IBM).
- ERM: credit, market, liquidity, operational, conduct
- Compliance: BSA/AML, KYC, privacy controls
- Cyber: resilience, incident response; 2024 breach cost $5.97M
- Controls: testing, audits, continuous training
Funding growth: L/D 75%, NPL 0.9%, breach cost $5.97M
Core activities: deposit gathering to fund lending (target L/D 75% in 2024), disciplined underwriting/portfolio monitoring (industry NPL ~0.9% in 2024) and balance-sheet optimization via sales/securitizations; wealth/advisory and insurance distribution drive fee income; enterprise risk, compliance and cyber controls reduce losses (2024 breach cost $5.97M).
| Metric | 2024 |
|---|---|
| Loan-to-deposit target | 75% |
| US commercial loans | $12.7T |
| Wealth market | $100T |
| Global insurance premiums | $6T |
| Industry NPL | 0.9% |
| Avg breach cost | $5.97M |
Full Version Awaits
Business Model Canvas
The Financial Institutions Business Model Canvas you’re previewing is the actual deliverable, not a mockup. When you purchase, you’ll receive this exact, fully formatted document—ready-to-edit in Word and Excel. No hidden pages or placeholders: what you see is what you’ll download and use.

Financial Institutions Business Model Canvas: Clear Strategy for Investors & Founders
Unlock the strategic blueprint behind Financial Institutions with our Business Model Canvas—three to five clear sections map value propositions, customer segments, key partners, revenue streams and cost structure. Ideal for investors, consultants and founders seeking actionable insights. Download the full Word and Excel canvas to benchmark, adapt and execute faster.
Partnerships
Core tech and fintech providers
Partnerships with core banking platforms, digital banking vendors and cybersecurity providers enable scalable, secure delivery across banking, insurance and investments; in 2024 many institutions target 99.9%+ vendor SLAs to meet regulatory uptime. Fintech integrations power mobile features, digital account opening (adoption often >80%) and real-time payments, while co-innovation can cut product time-to-market by up to 40%.
Payment networks and processors
Relationships with card networks and processors enable debit/credit issuance, routing of interchange (typically 1–3% per transaction) and layered fraud controls; major networks each route trillions in annual payment volume (>$10T range).
These partners expand merchant acceptance and consumer utility, while integrated dispute management cuts chargebacks and settlement losses and improves CX; global card fraud losses remain on the order of ~$35B (Nilson, 2023).
Network incentives, rebates and routing optimizations can improve unit economics by several basis points, materially boosting net margin on volume-driven products.
Insurance carriers and underwriters
As of 2024 SDN Insurance Agency relies on carrier panels to provide breadth across P&C, life, and specialty lines; direct underwriter access enables competitive pricing and tailored retail and commercial policies. Revenue-sharing and commission structures—typical P&C commissions around 10–15%—align incentives with carriers. Strong carrier relationships speed placement and bolster claims support, improving service and retention.
Custodians, broker-dealers, and asset managers
Courier Capital and HNP Capital rely on custodians, broker-dealers and asset managers for safekeeping and trade execution, leveraging open-architecture access to third-party funds and SMAs to broaden product choice; custodians held roughly $95 trillion in assets under custody globally in 2024, underpinning scale and liquidity.
- Shared compliance & best-execution frameworks
- Open-architecture product access (third-party funds, SMAs)
- Research integration to enhance portfolio construction
Regulators, community orgs, and referral networks
Close coordination with banking regulators ensures safety, soundness and compliance, aligning institutions with 2024 supervisory priorities as US banking sector assets reached about $27 trillion, reducing exam risk and liquidity strain. Community groups and centers of influence bolster CRA lending and local deposit growth; CPA and law firm referrals drive wealth and commercial pipelines, while educational partnerships improve financial literacy and brand trust.
- Regulators: align to 2024 supervisory priorities
- Community orgs: strengthen CRA lending
- CPA/law referrals: feed wealth/commercial pipelines
- Education partners: boost literacy and trust
99.9% uptime, >80% digital adoption; custodians $95T, card fraud $35B
Core banking, fintech and cybersecurity partners enable 99.9%+ uptime and digital account adoption >80%, cutting time-to-market by ~40%. Card networks drive interchange (1–3%) and cover >$10T in annual flows while global card fraud was ~$35B (2023). Custodians held ~$95T AUC in 2024; US banking assets ~ $27T, underpinning liquidity and regulatory coordination.
| Partner | Key metric (2024) |
|---|---|
| Core platforms | 99.9% SLA, >80% digital adoption |
| Card networks | Interchange 1–3%, >$10T volume |
| Custodians | $95T AUC |
What is included in the product
Detailed Word Document
A tailored Financial Institutions Business Model Canvas detailing customer segments, channels, value propositions, revenue streams, cost structure and key resources/partners across the 9 BMC blocks, with SWOT and competitive-advantage analysis for presentations and strategic decision-making.
Customizable Excel Spreadsheet
High-level snapshot of a financial institution’s business model with editable cells to quickly pinpoint revenue drivers, risk centers, and regulatory levers.
Activities
Deposit gathering and liquidity management
Five Star Bank attracts and retains consumer and business deposits to fund lending, targeting a loan-to-deposit ratio near 75% in 2024 to balance growth and resilience. Pricing, targeted promotions and treasury solutions are used to grow core deposits while controlling cost of funds. Liquidity buffers are managed within policy and regulatory requirements, and cash management tools (ACH, sweep, remote deposit) enhance customer stickiness.
Credit origination and portfolio management
Underwriting consumer, small business, commercial and real estate loans is core, with US commercial bank loans and leases totaling about $12.7 trillion at end-2024. Ongoing monitoring, renewals and workouts sustain risk-adjusted returns and kept industry nonperforming loan ratios near 0.9% in 2024. Concentration limits, pricing discipline and collateral controls protect capital. Secondary sales and participations—including securitizations—help optimize the balance sheet mix.
Wealth and investment advisory
Courier Capital and HNP Capital deliver planning, discretionary management, and advisory services, operating within a global wealth-management market that exceeded $100 trillion in 2024. Investment policy, rigorous due diligence, and systematic rebalancing drive client outcomes and performance attribution. Regular client reviews align goals with strategy and risk tolerance. Robust compliance and fiduciary oversight underpin client trust.
Insurance brokerage and risk placement
SDN Insurance Agency assesses client exposures and matches them with carriers for optimal coverage and pricing, leveraging market access amid global insurance premiums exceeding $6 trillion in 2024. Policy placement, renewals, and hands-on claims support drive high retention and steady revenue. Cross-sell with banking products boosts client lifetime value while data-driven remarketing preserves competitiveness.
- exposure assessment to carrier matching
- policy placement, renewals, claims = retention
- banking cross-sell enhances LTV
- data-driven remarketing sustains market edge
Risk, compliance, and cybersecurity
Enterprise risk management covers credit, market, liquidity, operational and conduct risks with limits, stress testing and capital planning; BSA/AML, KYC and privacy controls meet regulatory standards while testing, audits and training sustain a strong control environment. Cyber defense and resilience protect customer data and uptime — the financial sector average data breach cost was $5.97M in 2024 (IBM).
- ERM: credit, market, liquidity, operational, conduct
- Compliance: BSA/AML, KYC, privacy controls
- Cyber: resilience, incident response; 2024 breach cost $5.97M
- Controls: testing, audits, continuous training
Funding growth: L/D 75%, NPL 0.9%, breach cost $5.97M
Core activities: deposit gathering to fund lending (target L/D 75% in 2024), disciplined underwriting/portfolio monitoring (industry NPL ~0.9% in 2024) and balance-sheet optimization via sales/securitizations; wealth/advisory and insurance distribution drive fee income; enterprise risk, compliance and cyber controls reduce losses (2024 breach cost $5.97M).
| Metric | 2024 |
|---|---|
| Loan-to-deposit target | 75% |
| US commercial loans | $12.7T |
| Wealth market | $100T |
| Global insurance premiums | $6T |
| Industry NPL | 0.9% |
| Avg breach cost | $5.97M |
Full Version Awaits
Business Model Canvas
The Financial Institutions Business Model Canvas you’re previewing is the actual deliverable, not a mockup. When you purchase, you’ll receive this exact, fully formatted document—ready-to-edit in Word and Excel. No hidden pages or placeholders: what you see is what you’ll download and use.
Original: $10.00
-65%$10.00
$3.50Description
Financial Institutions Business Model Canvas: Clear Strategy for Investors & Founders
Unlock the strategic blueprint behind Financial Institutions with our Business Model Canvas—three to five clear sections map value propositions, customer segments, key partners, revenue streams and cost structure. Ideal for investors, consultants and founders seeking actionable insights. Download the full Word and Excel canvas to benchmark, adapt and execute faster.
Partnerships
Core tech and fintech providers
Partnerships with core banking platforms, digital banking vendors and cybersecurity providers enable scalable, secure delivery across banking, insurance and investments; in 2024 many institutions target 99.9%+ vendor SLAs to meet regulatory uptime. Fintech integrations power mobile features, digital account opening (adoption often >80%) and real-time payments, while co-innovation can cut product time-to-market by up to 40%.
Payment networks and processors
Relationships with card networks and processors enable debit/credit issuance, routing of interchange (typically 1–3% per transaction) and layered fraud controls; major networks each route trillions in annual payment volume (>$10T range).
These partners expand merchant acceptance and consumer utility, while integrated dispute management cuts chargebacks and settlement losses and improves CX; global card fraud losses remain on the order of ~$35B (Nilson, 2023).
Network incentives, rebates and routing optimizations can improve unit economics by several basis points, materially boosting net margin on volume-driven products.
Insurance carriers and underwriters
As of 2024 SDN Insurance Agency relies on carrier panels to provide breadth across P&C, life, and specialty lines; direct underwriter access enables competitive pricing and tailored retail and commercial policies. Revenue-sharing and commission structures—typical P&C commissions around 10–15%—align incentives with carriers. Strong carrier relationships speed placement and bolster claims support, improving service and retention.
Custodians, broker-dealers, and asset managers
Courier Capital and HNP Capital rely on custodians, broker-dealers and asset managers for safekeeping and trade execution, leveraging open-architecture access to third-party funds and SMAs to broaden product choice; custodians held roughly $95 trillion in assets under custody globally in 2024, underpinning scale and liquidity.
- Shared compliance & best-execution frameworks
- Open-architecture product access (third-party funds, SMAs)
- Research integration to enhance portfolio construction
Regulators, community orgs, and referral networks
Close coordination with banking regulators ensures safety, soundness and compliance, aligning institutions with 2024 supervisory priorities as US banking sector assets reached about $27 trillion, reducing exam risk and liquidity strain. Community groups and centers of influence bolster CRA lending and local deposit growth; CPA and law firm referrals drive wealth and commercial pipelines, while educational partnerships improve financial literacy and brand trust.
- Regulators: align to 2024 supervisory priorities
- Community orgs: strengthen CRA lending
- CPA/law referrals: feed wealth/commercial pipelines
- Education partners: boost literacy and trust
99.9% uptime, >80% digital adoption; custodians $95T, card fraud $35B
Core banking, fintech and cybersecurity partners enable 99.9%+ uptime and digital account adoption >80%, cutting time-to-market by ~40%. Card networks drive interchange (1–3%) and cover >$10T in annual flows while global card fraud was ~$35B (2023). Custodians held ~$95T AUC in 2024; US banking assets ~ $27T, underpinning liquidity and regulatory coordination.
| Partner | Key metric (2024) |
|---|---|
| Core platforms | 99.9% SLA, >80% digital adoption |
| Card networks | Interchange 1–3%, >$10T volume |
| Custodians | $95T AUC |
What is included in the product
Detailed Word Document
A tailored Financial Institutions Business Model Canvas detailing customer segments, channels, value propositions, revenue streams, cost structure and key resources/partners across the 9 BMC blocks, with SWOT and competitive-advantage analysis for presentations and strategic decision-making.
Customizable Excel Spreadsheet
High-level snapshot of a financial institution’s business model with editable cells to quickly pinpoint revenue drivers, risk centers, and regulatory levers.
Activities
Deposit gathering and liquidity management
Five Star Bank attracts and retains consumer and business deposits to fund lending, targeting a loan-to-deposit ratio near 75% in 2024 to balance growth and resilience. Pricing, targeted promotions and treasury solutions are used to grow core deposits while controlling cost of funds. Liquidity buffers are managed within policy and regulatory requirements, and cash management tools (ACH, sweep, remote deposit) enhance customer stickiness.
Credit origination and portfolio management
Underwriting consumer, small business, commercial and real estate loans is core, with US commercial bank loans and leases totaling about $12.7 trillion at end-2024. Ongoing monitoring, renewals and workouts sustain risk-adjusted returns and kept industry nonperforming loan ratios near 0.9% in 2024. Concentration limits, pricing discipline and collateral controls protect capital. Secondary sales and participations—including securitizations—help optimize the balance sheet mix.
Wealth and investment advisory
Courier Capital and HNP Capital deliver planning, discretionary management, and advisory services, operating within a global wealth-management market that exceeded $100 trillion in 2024. Investment policy, rigorous due diligence, and systematic rebalancing drive client outcomes and performance attribution. Regular client reviews align goals with strategy and risk tolerance. Robust compliance and fiduciary oversight underpin client trust.
Insurance brokerage and risk placement
SDN Insurance Agency assesses client exposures and matches them with carriers for optimal coverage and pricing, leveraging market access amid global insurance premiums exceeding $6 trillion in 2024. Policy placement, renewals, and hands-on claims support drive high retention and steady revenue. Cross-sell with banking products boosts client lifetime value while data-driven remarketing preserves competitiveness.
- exposure assessment to carrier matching
- policy placement, renewals, claims = retention
- banking cross-sell enhances LTV
- data-driven remarketing sustains market edge
Risk, compliance, and cybersecurity
Enterprise risk management covers credit, market, liquidity, operational and conduct risks with limits, stress testing and capital planning; BSA/AML, KYC and privacy controls meet regulatory standards while testing, audits and training sustain a strong control environment. Cyber defense and resilience protect customer data and uptime — the financial sector average data breach cost was $5.97M in 2024 (IBM).
- ERM: credit, market, liquidity, operational, conduct
- Compliance: BSA/AML, KYC, privacy controls
- Cyber: resilience, incident response; 2024 breach cost $5.97M
- Controls: testing, audits, continuous training
Funding growth: L/D 75%, NPL 0.9%, breach cost $5.97M
Core activities: deposit gathering to fund lending (target L/D 75% in 2024), disciplined underwriting/portfolio monitoring (industry NPL ~0.9% in 2024) and balance-sheet optimization via sales/securitizations; wealth/advisory and insurance distribution drive fee income; enterprise risk, compliance and cyber controls reduce losses (2024 breach cost $5.97M).
| Metric | 2024 |
|---|---|
| Loan-to-deposit target | 75% |
| US commercial loans | $12.7T |
| Wealth market | $100T |
| Global insurance premiums | $6T |
| Industry NPL | 0.9% |
| Avg breach cost | $5.97M |
Full Version Awaits
Business Model Canvas
The Financial Institutions Business Model Canvas you’re previewing is the actual deliverable, not a mockup. When you purchase, you’ll receive this exact, fully formatted document—ready-to-edit in Word and Excel. No hidden pages or placeholders: what you see is what you’ll download and use.











