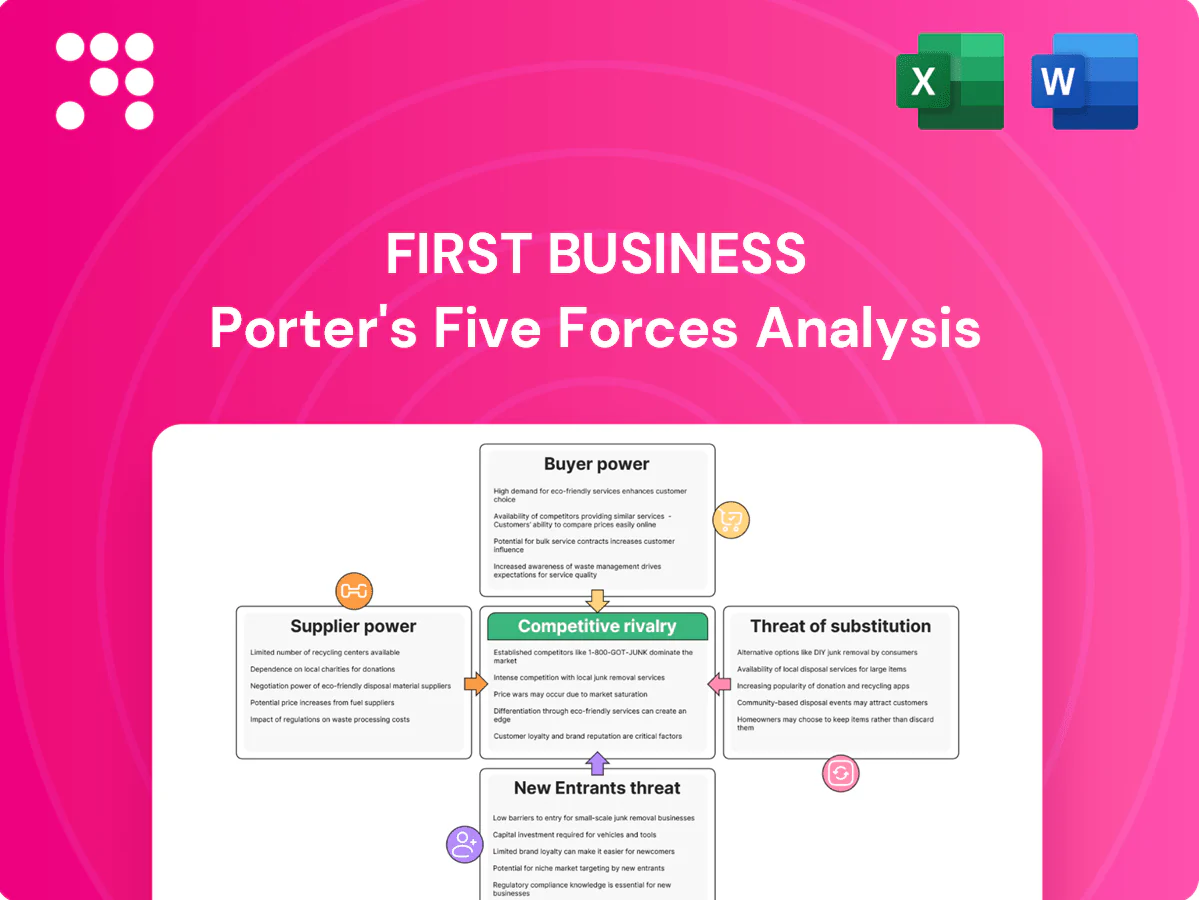
First Business Porter's Five Forces Analysis

Go Beyond the Preview—Access the Full Strategic Report
First Business faces moderate buyer power, niche supplier influence, rising fintech substitutes, and medium entry barriers that keep rivalry intense. This snapshot flags key risks and strategic levers. The full report reveals the forces shaping First Business’s industry and strategic implications. Unlock the complete Porter's Five Forces Analysis to get detailed, actionable insights.
Suppliers Bargaining Power

Concentration of core tech vendors
Banking depends on a few core processors—FIS, Fiserv and Jack Henry—which together account for roughly 80% of the US core market, giving those vendors strong pricing leverage. Core replacements commonly take 18–36 months and cost millions, raising switching barriers and locking in clients. Smaller banks face margin pressure and limited customization, while larger banks improve negotiation power via scale and 5–10 year commitments.
Funding mix and wholesale dependence
Depositors supply low-cost funding but businesses can move large balances quickly, as seen at Silicon Valley Bank where roughly $42 billion of withdrawals occurred in one day in March 2023 and about 94% of deposits were uninsured. Reliance on brokered or wholesale funding increases sensitivity to market spreads and raises funding costs. In stressed periods access and pricing can tighten abruptly. Strong relationship deposits reduce this supplier power.

Talent as a strategic supplier
Experienced bankers, wealth advisors and credit underwriters remain scarce in niche commercial segments, with industry surveys in 2024 reporting compensation increases of about 5–7% as firms compete for talent.
Competitive labor markets therefore raise hiring and retention costs, and key producers command premium pay and benefits because client relationships often follow them, boosting their bargaining power.
Robust succession planning and development pipelines reduce concentration risk; firms with formal programs cut turnover of senior producers by double-digit percentages in benchmark studies.

Third‑party fintech and data dependencies
Third‑party APIs, fraud tools and analytics providers control critical capabilities in payments and digital banking; by 2024 roughly 70% of digital finance workflows depended on external APIs, concentrating supplier power and raising vendor due diligence and compliance burdens that limit switching. Usage-based fees and annual price escalators (often 10–15% YoY) can compound costs, while co-innovation partnerships redistribute value and mitigate lock‑in.
- APIs: 70% dependency
- Fraud losses: ~$32B industry impact
- Price escalators: 10–15% YoY
- Mitigation: co‑innovation partnerships
Correspondent banking and capital markets access
Liquidity lines, loan participations and hedging counterparties materially affect availability and pricing; banks maintain liquidity coverage ratios above 100% in 2024, tightening terms for weaker counterparties. Market volatility in 2024 has periodically widened spreads and increased collateral calls, elevating supplier leverage. Diversifying counterparties lowers concentration risk and a strong credit profile secures better pricing and fewer covenants.
- Liquidity lines: LCR >100% (2024)
- Concentration: diversify >3-5 counterparties
- Volatility: wider spreads → higher collateral
- Credit strength: investment-grade terms
Core processors ~80%; $42B outflows; diversify >3-5
Supplier power is high: three core processors hold ~80% US market, creating pricing leverage and long, costly migrations. Deposit concentration risks materialize quickly (SVB: ~$42B withdrawals in one day); uninsured deposits ~94% at failure. External APIs/fraud vendors underpin ~70% of digital workflows with 10–15% YoY price escalators. Diversify >3–5 counterparties; LCRs >100% ease funding stress.
| Metric | 2024 Value |
|---|---|
| Core vendors share | ~80% |
| SVB one-day outflows | $42B |
| API dependency | 70% |
| Price escalators | 10–15% YoY |
| LCR | >100% |
What is included in the product
 Detailed Word Document
Uncovers key competitive drivers—buyer and supplier power, rivalry, new-entry and substitute threats—affecting First Business, with data-backed insights on disruptive forces, barriers protecting incumbency, and strategic implications for pricing, profitability and market positioning; fully editable for reports and decks.

 Customizable Excel Spreadsheet
A concise one-sheet Porter's Five Forces diagnostic for First Business—translate competitive pressures into actionable steps with adjustable force scores and an instant radar chart for quick strategic alignment.
Customers Bargaining Power

Price sensitivity in commercial lending
Business borrowers routinely shop rates and fees; with the fed funds target at 5.25–5.50% and prime at 8.50% in mid‑2024, pricing is highly comparable across lenders. Competitive bid processes compress yields and covenants, while larger credits draw aggressive pricing from regional and national banks. Relationship-based cross‑sell often offsets pure rate competition by adding fee income and retention.
Multi-banking and ease of switching
Mid-market firms commonly keep multiple banking relationships; a 2024 Accenture study found about 64% of corporates use 2+ banks, raising customer bargaining power. Modern API-led treasury migration cuts switching costs, enabling wallet-share shifts without full exits. Sticky services and tailored solutions (cash-pooling, supply-chain finance) remain key defenses for bank primacy.

HNW wealth clients’ portability
HNW clients can reallocate assets within days seeking better performance, fees or service, driving high portability; robo and hybrid advisors, whose AUM exceeded $1 trillion in 2024, supply transparent fee benchmarks (roughly 0.25–0.75% on managed portfolios). Personalized financial and tax-aware planning materially improves retention, while realized performance and trust remain the decisive factors for HNW switches.

Demand for integrated solutions
Clients increasingly demand bundled lending, treasury and wealth offerings and can use broad relationships to negotiate pricing and fee waivers; a 2024 Accenture survey found 72% of corporate and affluent clients prefer integrated platforms. Failure to integrate raises churn risk while seamless onboarding and strict SLAs materially strengthen banks' bargaining position.
- Bundled demand: 72% (Accenture 2024)
- Negotiation leverage: broader wallet ⇒ better pricing
- Churn risk if not integrated
- Onboarding + SLAs = stronger retention
Information transparency and RFP discipline
Widely available rate data and standardized RFPs increase buyer leverage by enabling apples-to-apples cost comparisons; 2024 surveys show roughly 65% of procurement teams favor standardized RFPs, driving negotiation on total cost and service KPIs. Procurement-led processes emphasize total cost of ownership and measurable service metrics, so vendors need case studies and outcomes to win; differentiated expertise can justify premium pricing.
- Standardized RFPs: 65% (2024)
- Focus: total cost & service KPIs
- Win criteria: case studies, measurable outcomes
- Pricing edge: differentiated expertise
Buyers hold leverage as firms shop rates; demand rises for bundled lending, treasury, wealth
Buyers hold strong leverage: business borrowers regularly shop rates (fed funds 5.25–5.50%, prime 8.50% in mid‑2024), compressing yields and covenants. Mid‑market firms (64% use 2+ banks) and API-led treasury shifts lower switching costs, while HNW flows (> $1tn robo/hybrid AUM) increase portability. Demand for bundled lending+treasury+wealth (72%) and standardized RFPs (65%) intensify price and service negotiation.
| Metric | 2024 Value |
|---|---|
| Fed funds target | 5.25–5.50% |
| Prime rate | 8.50% |
| Corporates with 2+ banks | 64% |
| Robo/hybrid AUM | > $1 trillion |
| Prefer integrated platforms | 72% |
| Standardized RFPs | 65% |
What You See Is What You Get
First Business Porter's Five Forces Analysis
This preview shows the exact First Business Porter's Five Forces Analysis you'll receive immediately after purchase—no mockups or placeholders. The document displayed is fully formatted and ready to download the moment you buy. You're viewing the final, deliverable file, prepared for immediate use.

Go Beyond the Preview—Access the Full Strategic Report
First Business faces moderate buyer power, niche supplier influence, rising fintech substitutes, and medium entry barriers that keep rivalry intense. This snapshot flags key risks and strategic levers. The full report reveals the forces shaping First Business’s industry and strategic implications. Unlock the complete Porter's Five Forces Analysis to get detailed, actionable insights.
Suppliers Bargaining Power
Concentration of core tech vendors
Banking depends on a few core processors—FIS, Fiserv and Jack Henry—which together account for roughly 80% of the US core market, giving those vendors strong pricing leverage. Core replacements commonly take 18–36 months and cost millions, raising switching barriers and locking in clients. Smaller banks face margin pressure and limited customization, while larger banks improve negotiation power via scale and 5–10 year commitments.
Funding mix and wholesale dependence
Depositors supply low-cost funding but businesses can move large balances quickly, as seen at Silicon Valley Bank where roughly $42 billion of withdrawals occurred in one day in March 2023 and about 94% of deposits were uninsured. Reliance on brokered or wholesale funding increases sensitivity to market spreads and raises funding costs. In stressed periods access and pricing can tighten abruptly. Strong relationship deposits reduce this supplier power.
Talent as a strategic supplier
Experienced bankers, wealth advisors and credit underwriters remain scarce in niche commercial segments, with industry surveys in 2024 reporting compensation increases of about 5–7% as firms compete for talent.
Competitive labor markets therefore raise hiring and retention costs, and key producers command premium pay and benefits because client relationships often follow them, boosting their bargaining power.
Robust succession planning and development pipelines reduce concentration risk; firms with formal programs cut turnover of senior producers by double-digit percentages in benchmark studies.
Third‑party fintech and data dependencies
Third‑party APIs, fraud tools and analytics providers control critical capabilities in payments and digital banking; by 2024 roughly 70% of digital finance workflows depended on external APIs, concentrating supplier power and raising vendor due diligence and compliance burdens that limit switching. Usage-based fees and annual price escalators (often 10–15% YoY) can compound costs, while co-innovation partnerships redistribute value and mitigate lock‑in.
- APIs: 70% dependency
- Fraud losses: ~$32B industry impact
- Price escalators: 10–15% YoY
- Mitigation: co‑innovation partnerships
Correspondent banking and capital markets access
Liquidity lines, loan participations and hedging counterparties materially affect availability and pricing; banks maintain liquidity coverage ratios above 100% in 2024, tightening terms for weaker counterparties. Market volatility in 2024 has periodically widened spreads and increased collateral calls, elevating supplier leverage. Diversifying counterparties lowers concentration risk and a strong credit profile secures better pricing and fewer covenants.
- Liquidity lines: LCR >100% (2024)
- Concentration: diversify >3-5 counterparties
- Volatility: wider spreads → higher collateral
- Credit strength: investment-grade terms
Core processors ~80%; $42B outflows; diversify >3-5
Supplier power is high: three core processors hold ~80% US market, creating pricing leverage and long, costly migrations. Deposit concentration risks materialize quickly (SVB: ~$42B withdrawals in one day); uninsured deposits ~94% at failure. External APIs/fraud vendors underpin ~70% of digital workflows with 10–15% YoY price escalators. Diversify >3–5 counterparties; LCRs >100% ease funding stress.
| Metric | 2024 Value |
|---|---|
| Core vendors share | ~80% |
| SVB one-day outflows | $42B |
| API dependency | 70% |
| Price escalators | 10–15% YoY |
| LCR | >100% |
What is included in the product
Detailed Word Document
Uncovers key competitive drivers—buyer and supplier power, rivalry, new-entry and substitute threats—affecting First Business, with data-backed insights on disruptive forces, barriers protecting incumbency, and strategic implications for pricing, profitability and market positioning; fully editable for reports and decks.
Customizable Excel Spreadsheet
A concise one-sheet Porter's Five Forces diagnostic for First Business—translate competitive pressures into actionable steps with adjustable force scores and an instant radar chart for quick strategic alignment.
Customers Bargaining Power
Price sensitivity in commercial lending
Business borrowers routinely shop rates and fees; with the fed funds target at 5.25–5.50% and prime at 8.50% in mid‑2024, pricing is highly comparable across lenders. Competitive bid processes compress yields and covenants, while larger credits draw aggressive pricing from regional and national banks. Relationship-based cross‑sell often offsets pure rate competition by adding fee income and retention.
Multi-banking and ease of switching
Mid-market firms commonly keep multiple banking relationships; a 2024 Accenture study found about 64% of corporates use 2+ banks, raising customer bargaining power. Modern API-led treasury migration cuts switching costs, enabling wallet-share shifts without full exits. Sticky services and tailored solutions (cash-pooling, supply-chain finance) remain key defenses for bank primacy.
HNW wealth clients’ portability
HNW clients can reallocate assets within days seeking better performance, fees or service, driving high portability; robo and hybrid advisors, whose AUM exceeded $1 trillion in 2024, supply transparent fee benchmarks (roughly 0.25–0.75% on managed portfolios). Personalized financial and tax-aware planning materially improves retention, while realized performance and trust remain the decisive factors for HNW switches.
Demand for integrated solutions
Clients increasingly demand bundled lending, treasury and wealth offerings and can use broad relationships to negotiate pricing and fee waivers; a 2024 Accenture survey found 72% of corporate and affluent clients prefer integrated platforms. Failure to integrate raises churn risk while seamless onboarding and strict SLAs materially strengthen banks' bargaining position.
- Bundled demand: 72% (Accenture 2024)
- Negotiation leverage: broader wallet ⇒ better pricing
- Churn risk if not integrated
- Onboarding + SLAs = stronger retention
Information transparency and RFP discipline
Widely available rate data and standardized RFPs increase buyer leverage by enabling apples-to-apples cost comparisons; 2024 surveys show roughly 65% of procurement teams favor standardized RFPs, driving negotiation on total cost and service KPIs. Procurement-led processes emphasize total cost of ownership and measurable service metrics, so vendors need case studies and outcomes to win; differentiated expertise can justify premium pricing.
- Standardized RFPs: 65% (2024)
- Focus: total cost & service KPIs
- Win criteria: case studies, measurable outcomes
- Pricing edge: differentiated expertise
Buyers hold leverage as firms shop rates; demand rises for bundled lending, treasury, wealth
Buyers hold strong leverage: business borrowers regularly shop rates (fed funds 5.25–5.50%, prime 8.50% in mid‑2024), compressing yields and covenants. Mid‑market firms (64% use 2+ banks) and API-led treasury shifts lower switching costs, while HNW flows (> $1tn robo/hybrid AUM) increase portability. Demand for bundled lending+treasury+wealth (72%) and standardized RFPs (65%) intensify price and service negotiation.
| Metric | 2024 Value |
|---|---|
| Fed funds target | 5.25–5.50% |
| Prime rate | 8.50% |
| Corporates with 2+ banks | 64% |
| Robo/hybrid AUM | > $1 trillion |
| Prefer integrated platforms | 72% |
| Standardized RFPs | 65% |
What You See Is What You Get
First Business Porter's Five Forces Analysis
This preview shows the exact First Business Porter's Five Forces Analysis you'll receive immediately after purchase—no mockups or placeholders. The document displayed is fully formatted and ready to download the moment you buy. You're viewing the final, deliverable file, prepared for immediate use.
Original: $10.00
-65%$10.00
$3.50Description
Go Beyond the Preview—Access the Full Strategic Report
First Business faces moderate buyer power, niche supplier influence, rising fintech substitutes, and medium entry barriers that keep rivalry intense. This snapshot flags key risks and strategic levers. The full report reveals the forces shaping First Business’s industry and strategic implications. Unlock the complete Porter's Five Forces Analysis to get detailed, actionable insights.
Suppliers Bargaining Power
Concentration of core tech vendors
Banking depends on a few core processors—FIS, Fiserv and Jack Henry—which together account for roughly 80% of the US core market, giving those vendors strong pricing leverage. Core replacements commonly take 18–36 months and cost millions, raising switching barriers and locking in clients. Smaller banks face margin pressure and limited customization, while larger banks improve negotiation power via scale and 5–10 year commitments.
Funding mix and wholesale dependence
Depositors supply low-cost funding but businesses can move large balances quickly, as seen at Silicon Valley Bank where roughly $42 billion of withdrawals occurred in one day in March 2023 and about 94% of deposits were uninsured. Reliance on brokered or wholesale funding increases sensitivity to market spreads and raises funding costs. In stressed periods access and pricing can tighten abruptly. Strong relationship deposits reduce this supplier power.
Talent as a strategic supplier
Experienced bankers, wealth advisors and credit underwriters remain scarce in niche commercial segments, with industry surveys in 2024 reporting compensation increases of about 5–7% as firms compete for talent.
Competitive labor markets therefore raise hiring and retention costs, and key producers command premium pay and benefits because client relationships often follow them, boosting their bargaining power.
Robust succession planning and development pipelines reduce concentration risk; firms with formal programs cut turnover of senior producers by double-digit percentages in benchmark studies.
Third‑party fintech and data dependencies
Third‑party APIs, fraud tools and analytics providers control critical capabilities in payments and digital banking; by 2024 roughly 70% of digital finance workflows depended on external APIs, concentrating supplier power and raising vendor due diligence and compliance burdens that limit switching. Usage-based fees and annual price escalators (often 10–15% YoY) can compound costs, while co-innovation partnerships redistribute value and mitigate lock‑in.
- APIs: 70% dependency
- Fraud losses: ~$32B industry impact
- Price escalators: 10–15% YoY
- Mitigation: co‑innovation partnerships
Correspondent banking and capital markets access
Liquidity lines, loan participations and hedging counterparties materially affect availability and pricing; banks maintain liquidity coverage ratios above 100% in 2024, tightening terms for weaker counterparties. Market volatility in 2024 has periodically widened spreads and increased collateral calls, elevating supplier leverage. Diversifying counterparties lowers concentration risk and a strong credit profile secures better pricing and fewer covenants.
- Liquidity lines: LCR >100% (2024)
- Concentration: diversify >3-5 counterparties
- Volatility: wider spreads → higher collateral
- Credit strength: investment-grade terms
Core processors ~80%; $42B outflows; diversify >3-5
Supplier power is high: three core processors hold ~80% US market, creating pricing leverage and long, costly migrations. Deposit concentration risks materialize quickly (SVB: ~$42B withdrawals in one day); uninsured deposits ~94% at failure. External APIs/fraud vendors underpin ~70% of digital workflows with 10–15% YoY price escalators. Diversify >3–5 counterparties; LCRs >100% ease funding stress.
| Metric | 2024 Value |
|---|---|
| Core vendors share | ~80% |
| SVB one-day outflows | $42B |
| API dependency | 70% |
| Price escalators | 10–15% YoY |
| LCR | >100% |
What is included in the product
Detailed Word Document
Uncovers key competitive drivers—buyer and supplier power, rivalry, new-entry and substitute threats—affecting First Business, with data-backed insights on disruptive forces, barriers protecting incumbency, and strategic implications for pricing, profitability and market positioning; fully editable for reports and decks.
Customizable Excel Spreadsheet
A concise one-sheet Porter's Five Forces diagnostic for First Business—translate competitive pressures into actionable steps with adjustable force scores and an instant radar chart for quick strategic alignment.
Customers Bargaining Power
Price sensitivity in commercial lending
Business borrowers routinely shop rates and fees; with the fed funds target at 5.25–5.50% and prime at 8.50% in mid‑2024, pricing is highly comparable across lenders. Competitive bid processes compress yields and covenants, while larger credits draw aggressive pricing from regional and national banks. Relationship-based cross‑sell often offsets pure rate competition by adding fee income and retention.
Multi-banking and ease of switching
Mid-market firms commonly keep multiple banking relationships; a 2024 Accenture study found about 64% of corporates use 2+ banks, raising customer bargaining power. Modern API-led treasury migration cuts switching costs, enabling wallet-share shifts without full exits. Sticky services and tailored solutions (cash-pooling, supply-chain finance) remain key defenses for bank primacy.
HNW wealth clients’ portability
HNW clients can reallocate assets within days seeking better performance, fees or service, driving high portability; robo and hybrid advisors, whose AUM exceeded $1 trillion in 2024, supply transparent fee benchmarks (roughly 0.25–0.75% on managed portfolios). Personalized financial and tax-aware planning materially improves retention, while realized performance and trust remain the decisive factors for HNW switches.
Demand for integrated solutions
Clients increasingly demand bundled lending, treasury and wealth offerings and can use broad relationships to negotiate pricing and fee waivers; a 2024 Accenture survey found 72% of corporate and affluent clients prefer integrated platforms. Failure to integrate raises churn risk while seamless onboarding and strict SLAs materially strengthen banks' bargaining position.
- Bundled demand: 72% (Accenture 2024)
- Negotiation leverage: broader wallet ⇒ better pricing
- Churn risk if not integrated
- Onboarding + SLAs = stronger retention
Information transparency and RFP discipline
Widely available rate data and standardized RFPs increase buyer leverage by enabling apples-to-apples cost comparisons; 2024 surveys show roughly 65% of procurement teams favor standardized RFPs, driving negotiation on total cost and service KPIs. Procurement-led processes emphasize total cost of ownership and measurable service metrics, so vendors need case studies and outcomes to win; differentiated expertise can justify premium pricing.
- Standardized RFPs: 65% (2024)
- Focus: total cost & service KPIs
- Win criteria: case studies, measurable outcomes
- Pricing edge: differentiated expertise
Buyers hold leverage as firms shop rates; demand rises for bundled lending, treasury, wealth
Buyers hold strong leverage: business borrowers regularly shop rates (fed funds 5.25–5.50%, prime 8.50% in mid‑2024), compressing yields and covenants. Mid‑market firms (64% use 2+ banks) and API-led treasury shifts lower switching costs, while HNW flows (> $1tn robo/hybrid AUM) increase portability. Demand for bundled lending+treasury+wealth (72%) and standardized RFPs (65%) intensify price and service negotiation.
| Metric | 2024 Value |
|---|---|
| Fed funds target | 5.25–5.50% |
| Prime rate | 8.50% |
| Corporates with 2+ banks | 64% |
| Robo/hybrid AUM | > $1 trillion |
| Prefer integrated platforms | 72% |
| Standardized RFPs | 65% |
What You See Is What You Get
First Business Porter's Five Forces Analysis
This preview shows the exact First Business Porter's Five Forces Analysis you'll receive immediately after purchase—no mockups or placeholders. The document displayed is fully formatted and ready to download the moment you buy. You're viewing the final, deliverable file, prepared for immediate use.











