First Pacific Porter's Five Forces Analysis

Elevate Your Analysis with the Complete Porter's Five Forces Analysis
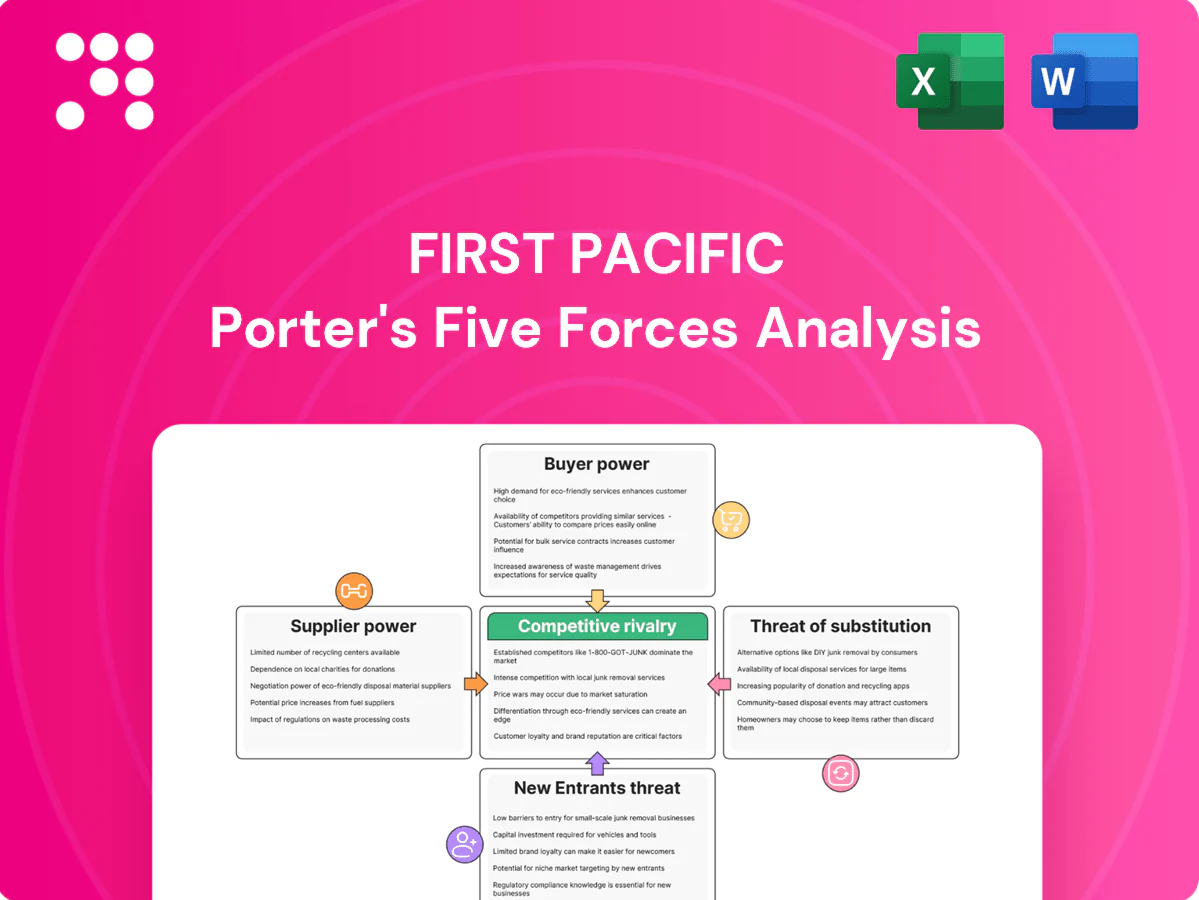
First Pacific faces moderate buyer power, concentrated suppliers in key segments, and a manageable threat of new entrants due to regulatory and capital hurdles; rivalry is intense across its core markets while substitutes present limited disruption today. This brief snapshot only scratches the surface. Unlock the full Porter's Five Forces Analysis to explore First Pacific’s competitive dynamics, market pressures, and strategic advantages in detail.
Suppliers Bargaining Power

Diverse input bases dilute single-source leverage
First Pacific’s holdings as of 2024 include PLDT (telecom), Indofood (food) and Metro Pacific Investments (infrastructure), creating a broad supplier set and diluting single-source leverage. This diversification reduces dependency on any one supplier category and allows cross-portfolio scale to standardize terms and hedge input volatility. Nevertheless, specialized inputs per sector—spectrum/equipment for telecom, commodities for food, concession-specific contractors for infrastructure—retain localized supplier power.
Specialized tech and equipment vendors hold sway
Telecom networks depend on a few global RAN, core and fiber suppliers—Ericsson, Huawei and Nokia held about 77% of global RAN market share in 2023–24, while fiber suppliers like Prysmian and Corning dominate volumes. Proprietary standards and 7–10 year replacement cycles raise switching costs and entrench vendors. Framework agreements and multivendor strategies mitigate risk, but supplier bargaining power remains moderate to high.

Agri-commodities and packaging expose cost pass-through risks
Consumer foods rely heavily on commodity inputs — palm oil, wheat, sugar — and packaging resins, which together can represent roughly 20–40% of COGS in many FMCG categories; palm oil traded around $700–900/ton in 2024, amplifying supplier leverage during spikes. Global price swings give upstream suppliers temporary bargaining power, though hedging, contract farming and vertical integration reduce but do not eliminate pass-through risk. Final pricing power still hinges on brand strength and category elasticity, with staple categories showing lower pass-through ability than premium segments.

Regulatory and concession suppliers act as quasi-monopolists
Infrastructure for First Pacific depends on government concessions, right-of-way and tariff-setting, so regulators effectively supply access under non-market terms. Their bargaining power is strong because approvals, permits and compliance gates control project timing and revenue models. Performance metrics and public-policy objectives (tariff caps, service KPIs) materially shape contract terms and renegotiations.
- Regulatory control: concessions, permits, tariffs
- Bargaining leverage: approval and compliance gates
- Contract drivers: KPI-linked tariffs and public-policy clauses
Skilled labor and contractors impact project timelines
- 2024 labor shortage: increases supplier leverage
- Localized expertise: higher switching costs
- Delays: portfolio-level IRR and cashflow impact
- Mitigation: long-term and performance contracts
Diversified portfolio reduces single-supplier risk, but sector suppliers retain strong leverage
First Pacific’s diversified portfolio dilutes single‑supplier dependence but sectoral inputs retain localized power. Telecom: top three RAN vendors held ~77% global share (2023–24), raising switching costs. Foods: commodities (palm oil ~800/t in 2024) drive 20–40% COGS volatility. Infrastructure: regulatory concessions and 2024 skilled‑labor shortages give suppliers strong leverage.
| Segment | 2024 metric | Supplier power |
|---|---|---|
| Telecom | RAN top3 ~77% | High |
| Food | Palm oil ~800/ton; 20–40% COGS | Moderate |
| Infrastructure | Regulatory control; skilled‑labor shortages 2024 | High |
What is included in the product
 Detailed Word Document
Tailored exclusively for First Pacific, this Porter’s Five Forces analysis uncovers key drivers of competition, supplier and buyer influence, entry barriers, substitutes, and emerging threats to assess pricing power and strategic vulnerability.

 Customizable Excel Spreadsheet
A concise, one-sheet Five Forces summary for First Pacific—relieves analysis complexity and is ready to drop into pitch decks or boardroom slides.
Customers Bargaining Power

Telecom subscribers show price sensitivity but face switching frictions
Mobile users are highly price-aware, especially in prepaid-dominated markets where global unique mobile subscribers reached about 5.9 billion in 2024 (GSMA), and prepaid shares in many emerging regions often exceed 70%. Number portability and aggressive promotions raise churn and tactical switching, boosting buyer power, while wide coverage, bundled offers and loyalty programs impose effective switching costs. Net effect: moderate buyer power with episodic volatility.
Retailers and modern trade negotiate hard on food margins
Supermarkets and national distributors control shelf space and promotional slots, extracting rebates and extended payment terms that pressured suppliers in 2024; private label penetration reached about 18% in key markets that year. Strong brands and must-have SKUs help First Pacific negotiate better net prices and placement. Fragmented traditional trade dilutes average buyer power across channels, reducing consolidated buyer leverage.

Infrastructure offtakers are captive but politically influential
Toll road users and utility customers are largely captive due to long concession terms (commonly 20–30 years as of 2024), limiting direct alternatives; however, public sentiment and political oversight increasingly shape tariff adjustments. High-profile complaints can prompt regulatory reviews or fines, amplifying buyer influence. Strong service quality and proactive stakeholder engagement are key mitigants.

Enterprise and wholesale telecom customers bargain on scale
Large corporates and carrier customers buy high-volume connectivity and use formal procurement to extract volume discounts and strict SLAs; multi-year contracts, typically 3–5 years, stabilize traffic but compress margins as list-price discounts often exceed 20% in practice (2024 market practice). Value-added services such as managed WAN, security, and cloud on-ramps shift negotiations from pure price to blended-value deals.
- High-volume purchases drive >20% typical discounts
- Contracts usually 3–5 years, stabilizing volumes
- SLAs and penalties are strong procurement levers
- Value-added services reduce pure price bargaining
Commodity customers in resources shift with market cycles
Commodity customers in resources shift with market cycles: when supply is tight buyers concede on price and terms, while in downturns they extract discounts and demand flexibility; Brent crude averaged about 86 USD/bbl in 2024, reflecting softer mid-year pricing that strengthened buyer leverage. Spot vs contract mix drives realized buyer power and portfolio hedging reduces cyclical exposure for suppliers.
- Buyers concede in tight markets
- Downturns -> discounts/flexibility
- Spot vs contract = actual power
- Hedging smooths cycle risk
Buyer power shifts: mobile churn, retail private labels; 5.9bn
Customer bargaining power is moderate and volatile: mobile users (5.9bn globally in 2024; prepaid >70% in many emerging markets) drive churn; retail buyers push private‑label growth (≈18% share), while toll/utility customers are captive under 20–30 year concessions; corporates secure >20% volume discounts via 3–5 year contracts; commodity buyers swing power with cycles (Brent ≈86 USD/bbl in 2024).
| Segment | Buyer Power | Key metrics (2024) |
|---|---|---|
| Mobile | Moderate | 5.9bn subs; prepaid >70% |
| Retail | High | Private label ≈18% |
| Toll/Utilities | Low | Concessions 20–30 yrs |
| Corporate | High | Contracts 3–5 yrs; >20% discounts |
| Commodities | Variable | Brent ≈86 USD/bbl |
Preview the Actual Deliverable
First Pacific Porter's Five Forces Analysis
This Porter's Five Forces analysis of First Pacific is the exact, fully formatted document you see in preview—covering industry rivalry, buyer and supplier power, threat of entrants and substitutes. No placeholders or samples. Purchase grants immediate access to this same file, ready to download and use.

Elevate Your Analysis with the Complete Porter's Five Forces Analysis
First Pacific faces moderate buyer power, concentrated suppliers in key segments, and a manageable threat of new entrants due to regulatory and capital hurdles; rivalry is intense across its core markets while substitutes present limited disruption today. This brief snapshot only scratches the surface. Unlock the full Porter's Five Forces Analysis to explore First Pacific’s competitive dynamics, market pressures, and strategic advantages in detail.
Suppliers Bargaining Power
Diverse input bases dilute single-source leverage
First Pacific’s holdings as of 2024 include PLDT (telecom), Indofood (food) and Metro Pacific Investments (infrastructure), creating a broad supplier set and diluting single-source leverage. This diversification reduces dependency on any one supplier category and allows cross-portfolio scale to standardize terms and hedge input volatility. Nevertheless, specialized inputs per sector—spectrum/equipment for telecom, commodities for food, concession-specific contractors for infrastructure—retain localized supplier power.
Specialized tech and equipment vendors hold sway
Telecom networks depend on a few global RAN, core and fiber suppliers—Ericsson, Huawei and Nokia held about 77% of global RAN market share in 2023–24, while fiber suppliers like Prysmian and Corning dominate volumes. Proprietary standards and 7–10 year replacement cycles raise switching costs and entrench vendors. Framework agreements and multivendor strategies mitigate risk, but supplier bargaining power remains moderate to high.
Agri-commodities and packaging expose cost pass-through risks
Consumer foods rely heavily on commodity inputs — palm oil, wheat, sugar — and packaging resins, which together can represent roughly 20–40% of COGS in many FMCG categories; palm oil traded around $700–900/ton in 2024, amplifying supplier leverage during spikes. Global price swings give upstream suppliers temporary bargaining power, though hedging, contract farming and vertical integration reduce but do not eliminate pass-through risk. Final pricing power still hinges on brand strength and category elasticity, with staple categories showing lower pass-through ability than premium segments.
Regulatory and concession suppliers act as quasi-monopolists
Infrastructure for First Pacific depends on government concessions, right-of-way and tariff-setting, so regulators effectively supply access under non-market terms. Their bargaining power is strong because approvals, permits and compliance gates control project timing and revenue models. Performance metrics and public-policy objectives (tariff caps, service KPIs) materially shape contract terms and renegotiations.
- Regulatory control: concessions, permits, tariffs
- Bargaining leverage: approval and compliance gates
- Contract drivers: KPI-linked tariffs and public-policy clauses
Skilled labor and contractors impact project timelines
- 2024 labor shortage: increases supplier leverage
- Localized expertise: higher switching costs
- Delays: portfolio-level IRR and cashflow impact
- Mitigation: long-term and performance contracts
Diversified portfolio reduces single-supplier risk, but sector suppliers retain strong leverage
First Pacific’s diversified portfolio dilutes single‑supplier dependence but sectoral inputs retain localized power. Telecom: top three RAN vendors held ~77% global share (2023–24), raising switching costs. Foods: commodities (palm oil ~800/t in 2024) drive 20–40% COGS volatility. Infrastructure: regulatory concessions and 2024 skilled‑labor shortages give suppliers strong leverage.
| Segment | 2024 metric | Supplier power |
|---|---|---|
| Telecom | RAN top3 ~77% | High |
| Food | Palm oil ~800/ton; 20–40% COGS | Moderate |
| Infrastructure | Regulatory control; skilled‑labor shortages 2024 | High |
What is included in the product
Detailed Word Document
Tailored exclusively for First Pacific, this Porter’s Five Forces analysis uncovers key drivers of competition, supplier and buyer influence, entry barriers, substitutes, and emerging threats to assess pricing power and strategic vulnerability.
Customizable Excel Spreadsheet
A concise, one-sheet Five Forces summary for First Pacific—relieves analysis complexity and is ready to drop into pitch decks or boardroom slides.
Customers Bargaining Power
Telecom subscribers show price sensitivity but face switching frictions
Mobile users are highly price-aware, especially in prepaid-dominated markets where global unique mobile subscribers reached about 5.9 billion in 2024 (GSMA), and prepaid shares in many emerging regions often exceed 70%. Number portability and aggressive promotions raise churn and tactical switching, boosting buyer power, while wide coverage, bundled offers and loyalty programs impose effective switching costs. Net effect: moderate buyer power with episodic volatility.
Retailers and modern trade negotiate hard on food margins
Supermarkets and national distributors control shelf space and promotional slots, extracting rebates and extended payment terms that pressured suppliers in 2024; private label penetration reached about 18% in key markets that year. Strong brands and must-have SKUs help First Pacific negotiate better net prices and placement. Fragmented traditional trade dilutes average buyer power across channels, reducing consolidated buyer leverage.
Infrastructure offtakers are captive but politically influential
Toll road users and utility customers are largely captive due to long concession terms (commonly 20–30 years as of 2024), limiting direct alternatives; however, public sentiment and political oversight increasingly shape tariff adjustments. High-profile complaints can prompt regulatory reviews or fines, amplifying buyer influence. Strong service quality and proactive stakeholder engagement are key mitigants.
Enterprise and wholesale telecom customers bargain on scale
Large corporates and carrier customers buy high-volume connectivity and use formal procurement to extract volume discounts and strict SLAs; multi-year contracts, typically 3–5 years, stabilize traffic but compress margins as list-price discounts often exceed 20% in practice (2024 market practice). Value-added services such as managed WAN, security, and cloud on-ramps shift negotiations from pure price to blended-value deals.
- High-volume purchases drive >20% typical discounts
- Contracts usually 3–5 years, stabilizing volumes
- SLAs and penalties are strong procurement levers
- Value-added services reduce pure price bargaining
Commodity customers in resources shift with market cycles
Commodity customers in resources shift with market cycles: when supply is tight buyers concede on price and terms, while in downturns they extract discounts and demand flexibility; Brent crude averaged about 86 USD/bbl in 2024, reflecting softer mid-year pricing that strengthened buyer leverage. Spot vs contract mix drives realized buyer power and portfolio hedging reduces cyclical exposure for suppliers.
- Buyers concede in tight markets
- Downturns -> discounts/flexibility
- Spot vs contract = actual power
- Hedging smooths cycle risk
Buyer power shifts: mobile churn, retail private labels; 5.9bn
Customer bargaining power is moderate and volatile: mobile users (5.9bn globally in 2024; prepaid >70% in many emerging markets) drive churn; retail buyers push private‑label growth (≈18% share), while toll/utility customers are captive under 20–30 year concessions; corporates secure >20% volume discounts via 3–5 year contracts; commodity buyers swing power with cycles (Brent ≈86 USD/bbl in 2024).
| Segment | Buyer Power | Key metrics (2024) |
|---|---|---|
| Mobile | Moderate | 5.9bn subs; prepaid >70% |
| Retail | High | Private label ≈18% |
| Toll/Utilities | Low | Concessions 20–30 yrs |
| Corporate | High | Contracts 3–5 yrs; >20% discounts |
| Commodities | Variable | Brent ≈86 USD/bbl |
Preview the Actual Deliverable
First Pacific Porter's Five Forces Analysis
This Porter's Five Forces analysis of First Pacific is the exact, fully formatted document you see in preview—covering industry rivalry, buyer and supplier power, threat of entrants and substitutes. No placeholders or samples. Purchase grants immediate access to this same file, ready to download and use.
Original: $10.00
-65%$10.00
$3.50Description
Elevate Your Analysis with the Complete Porter's Five Forces Analysis
First Pacific faces moderate buyer power, concentrated suppliers in key segments, and a manageable threat of new entrants due to regulatory and capital hurdles; rivalry is intense across its core markets while substitutes present limited disruption today. This brief snapshot only scratches the surface. Unlock the full Porter's Five Forces Analysis to explore First Pacific’s competitive dynamics, market pressures, and strategic advantages in detail.
Suppliers Bargaining Power
Diverse input bases dilute single-source leverage
First Pacific’s holdings as of 2024 include PLDT (telecom), Indofood (food) and Metro Pacific Investments (infrastructure), creating a broad supplier set and diluting single-source leverage. This diversification reduces dependency on any one supplier category and allows cross-portfolio scale to standardize terms and hedge input volatility. Nevertheless, specialized inputs per sector—spectrum/equipment for telecom, commodities for food, concession-specific contractors for infrastructure—retain localized supplier power.
Specialized tech and equipment vendors hold sway
Telecom networks depend on a few global RAN, core and fiber suppliers—Ericsson, Huawei and Nokia held about 77% of global RAN market share in 2023–24, while fiber suppliers like Prysmian and Corning dominate volumes. Proprietary standards and 7–10 year replacement cycles raise switching costs and entrench vendors. Framework agreements and multivendor strategies mitigate risk, but supplier bargaining power remains moderate to high.
Agri-commodities and packaging expose cost pass-through risks
Consumer foods rely heavily on commodity inputs — palm oil, wheat, sugar — and packaging resins, which together can represent roughly 20–40% of COGS in many FMCG categories; palm oil traded around $700–900/ton in 2024, amplifying supplier leverage during spikes. Global price swings give upstream suppliers temporary bargaining power, though hedging, contract farming and vertical integration reduce but do not eliminate pass-through risk. Final pricing power still hinges on brand strength and category elasticity, with staple categories showing lower pass-through ability than premium segments.
Regulatory and concession suppliers act as quasi-monopolists
Infrastructure for First Pacific depends on government concessions, right-of-way and tariff-setting, so regulators effectively supply access under non-market terms. Their bargaining power is strong because approvals, permits and compliance gates control project timing and revenue models. Performance metrics and public-policy objectives (tariff caps, service KPIs) materially shape contract terms and renegotiations.
- Regulatory control: concessions, permits, tariffs
- Bargaining leverage: approval and compliance gates
- Contract drivers: KPI-linked tariffs and public-policy clauses
Skilled labor and contractors impact project timelines
- 2024 labor shortage: increases supplier leverage
- Localized expertise: higher switching costs
- Delays: portfolio-level IRR and cashflow impact
- Mitigation: long-term and performance contracts
Diversified portfolio reduces single-supplier risk, but sector suppliers retain strong leverage
First Pacific’s diversified portfolio dilutes single‑supplier dependence but sectoral inputs retain localized power. Telecom: top three RAN vendors held ~77% global share (2023–24), raising switching costs. Foods: commodities (palm oil ~800/t in 2024) drive 20–40% COGS volatility. Infrastructure: regulatory concessions and 2024 skilled‑labor shortages give suppliers strong leverage.
| Segment | 2024 metric | Supplier power |
|---|---|---|
| Telecom | RAN top3 ~77% | High |
| Food | Palm oil ~800/ton; 20–40% COGS | Moderate |
| Infrastructure | Regulatory control; skilled‑labor shortages 2024 | High |
What is included in the product
Detailed Word Document
Tailored exclusively for First Pacific, this Porter’s Five Forces analysis uncovers key drivers of competition, supplier and buyer influence, entry barriers, substitutes, and emerging threats to assess pricing power and strategic vulnerability.
Customizable Excel Spreadsheet
A concise, one-sheet Five Forces summary for First Pacific—relieves analysis complexity and is ready to drop into pitch decks or boardroom slides.
Customers Bargaining Power
Telecom subscribers show price sensitivity but face switching frictions
Mobile users are highly price-aware, especially in prepaid-dominated markets where global unique mobile subscribers reached about 5.9 billion in 2024 (GSMA), and prepaid shares in many emerging regions often exceed 70%. Number portability and aggressive promotions raise churn and tactical switching, boosting buyer power, while wide coverage, bundled offers and loyalty programs impose effective switching costs. Net effect: moderate buyer power with episodic volatility.
Retailers and modern trade negotiate hard on food margins
Supermarkets and national distributors control shelf space and promotional slots, extracting rebates and extended payment terms that pressured suppliers in 2024; private label penetration reached about 18% in key markets that year. Strong brands and must-have SKUs help First Pacific negotiate better net prices and placement. Fragmented traditional trade dilutes average buyer power across channels, reducing consolidated buyer leverage.
Infrastructure offtakers are captive but politically influential
Toll road users and utility customers are largely captive due to long concession terms (commonly 20–30 years as of 2024), limiting direct alternatives; however, public sentiment and political oversight increasingly shape tariff adjustments. High-profile complaints can prompt regulatory reviews or fines, amplifying buyer influence. Strong service quality and proactive stakeholder engagement are key mitigants.
Enterprise and wholesale telecom customers bargain on scale
Large corporates and carrier customers buy high-volume connectivity and use formal procurement to extract volume discounts and strict SLAs; multi-year contracts, typically 3–5 years, stabilize traffic but compress margins as list-price discounts often exceed 20% in practice (2024 market practice). Value-added services such as managed WAN, security, and cloud on-ramps shift negotiations from pure price to blended-value deals.
- High-volume purchases drive >20% typical discounts
- Contracts usually 3–5 years, stabilizing volumes
- SLAs and penalties are strong procurement levers
- Value-added services reduce pure price bargaining
Commodity customers in resources shift with market cycles
Commodity customers in resources shift with market cycles: when supply is tight buyers concede on price and terms, while in downturns they extract discounts and demand flexibility; Brent crude averaged about 86 USD/bbl in 2024, reflecting softer mid-year pricing that strengthened buyer leverage. Spot vs contract mix drives realized buyer power and portfolio hedging reduces cyclical exposure for suppliers.
- Buyers concede in tight markets
- Downturns -> discounts/flexibility
- Spot vs contract = actual power
- Hedging smooths cycle risk
Buyer power shifts: mobile churn, retail private labels; 5.9bn
Customer bargaining power is moderate and volatile: mobile users (5.9bn globally in 2024; prepaid >70% in many emerging markets) drive churn; retail buyers push private‑label growth (≈18% share), while toll/utility customers are captive under 20–30 year concessions; corporates secure >20% volume discounts via 3–5 year contracts; commodity buyers swing power with cycles (Brent ≈86 USD/bbl in 2024).
| Segment | Buyer Power | Key metrics (2024) |
|---|---|---|
| Mobile | Moderate | 5.9bn subs; prepaid >70% |
| Retail | High | Private label ≈18% |
| Toll/Utilities | Low | Concessions 20–30 yrs |
| Corporate | High | Contracts 3–5 yrs; >20% discounts |
| Commodities | Variable | Brent ≈86 USD/bbl |
Preview the Actual Deliverable
First Pacific Porter's Five Forces Analysis
This Porter's Five Forces analysis of First Pacific is the exact, fully formatted document you see in preview—covering industry rivalry, buyer and supplier power, threat of entrants and substitutes. No placeholders or samples. Purchase grants immediate access to this same file, ready to download and use.











