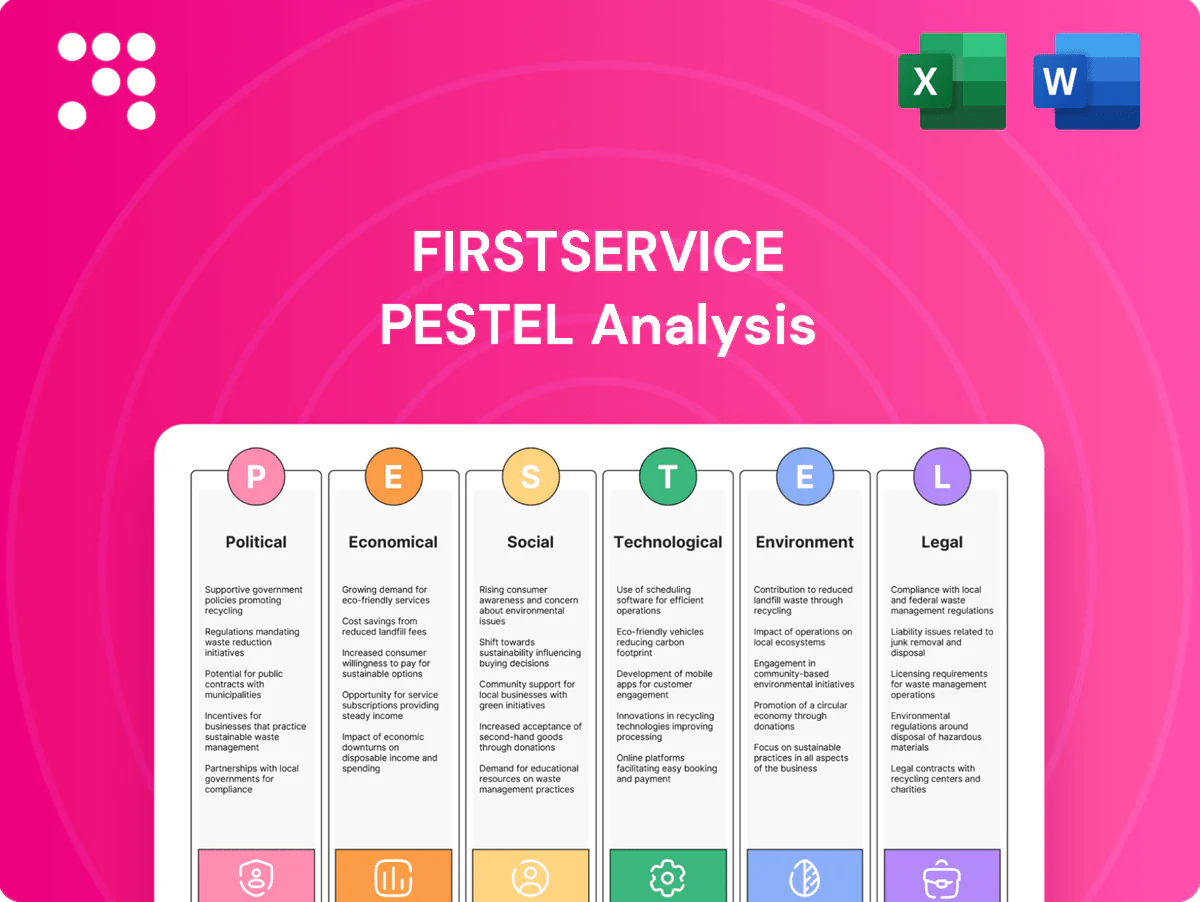
FirstService PESTLE Analysis

Plan Smarter. Present Sharper. Compete Stronger.
Unlock strategic clarity with our PESTLE Analysis of FirstService—three to five concise insights into political, economic, social, technological, legal, and environmental forces reshaping the business. Perfect for investors, consultants, and executives, this analysis turns external trends into actionable recommendations you can use immediately. Purchase the full report to access the complete, editable breakdown and make smarter, faster decisions.
Political factors

Municipal bylaws impact
Municipal bylaw changes on building codes, parking, noise and short‑term rentals across some 90,000 US local governments and roughly 3,700 Canadian municipalities reshape FirstService service scope and costs. The company must adapt procedures city‑by‑city and province/state‑by‑province/state to remain compliant. Close ties with councils and regulators help anticipate shifts and reduce operational disruption.
Housing policy shifts
Housing policy shifts — from affordable housing pushes to condominium governance and HOA rule changes — reshape demand for FirstService services: NLIHC estimated a 7.2 million shortfall of affordable rentals (2023), while FirstService Residential reports managing about 1.2 million homes, creating scale for management work. Subsidies and LIHTC-driven projects increase development-related service demand; tighter governance and compliance rules raise reporting and board-support burdens.

Infrastructure and resilience funds
Federal and state/provincial grants — driven by the US Infrastructure Investment and Jobs Act (IIJA) $1.2 trillion and the Inflation Reduction Act $369 billion — are expanding resiliency and retrofit maintenance pipelines that benefit property managers like FirstService. Accessing these programs requires careful navigation of procurement and eligibility rules, often adding administrative uplift. Timing and continuity of grant disbursements directly affect project backlog visibility and revenue phasing for service providers.

Immigration and labor stance
Immigration policies shape availability of frontline technicians and community staff for FirstService; Canada's 2024 immigration plan targets 485,000 new permanent residents and the US H-2B seasonal visa cap remains 66,000, influencing recruitment pipelines, wage pressure and time-to-hire across markets.
- Impact: tighter regimes → higher wages, longer hires
- Benefit: supportive policies → easier multi-market staffing
- Metric: Canada 2024 target 485,000; US H-2B cap 66,000
Trade and procurement exposure
Tariffs on lumber, steel and HVAC components materially raise FirstService project costs and can delay schedules; lumber prices swung over 50% in 2020–22 and steel rose ~60% in 2020–21, illustrating supply volatility. Cross‑border US‑Canada rules shape sourcing for key brands and logistics, affecting lead times and margins. Stable trade policy reduces pricing swings and client change orders, protecting margins.
- Tariff impact: input cost inflation and schedule risk
- Cross‑border: US‑Canada sourcing & lead‑time exposure
- Policy stability: lowers pricing volatility and change‑order incidence
Fragmented bylaws, funding surge and input shocks strain housing services and retrofit pipelines
Municipal bylaw fragmentation (≈90,000 US local governments, ≈3,700 Canadian municipalities) and housing policy shifts (FirstService Residential ≈1.2M homes) raise compliance and service demand. Federal grants (IIJA $1.2T, IRA $369B) boost retrofit pipelines; immigration targets (Canada 485,000; US H-2B 66,000) and input volatility (lumber +50%, steel +60%) pressure staffing and margins.
| Metric | Value |
|---|---|
| US local governments | ≈90,000 |
| Canadian municipalities | ≈3,700 |
| Managed homes | ≈1.2M |
| Canada 2024 target | 485,000 |
| US H-2B cap | 66,000 |
| IIJA / IRA | $1.2T / $369B |
What is included in the product
 Detailed Word Document
Explores how macro-environmental factors uniquely affect FirstService across Political, Economic, Social, Technological, Environmental and Legal dimensions, with data-driven insights, forward-looking scenarios and practical implications for executives and investors.

 Customizable Excel Spreadsheet
Condensed FirstService PESTLE provides a clear, visually segmented summary of external risks and opportunities—easy to drop into presentations, share across teams, and annotate for region- or business-specific planning.
Economic factors

Interest rates sensitivity
Higher rates, with the fed funds rate around 5.25–5.50% in 2024 and 30‑year mortgage averages near 6.7% (Freddie Mac 2024), often defer major HOA renovations and capital projects as financing and special assessments become costlier. Lower rates unlock refinancing and reserve-funded upgrades by reducing borrowing costs and raising cash flow. Rate cycles shift revenue mix toward recurring management fees in high‑rate periods and discretionary project work when rates fall.
Housing cycle dynamics
New condo and strata supply expands FirstService's addressable management units, even as higher borrowing costs—30-year US mortgage rates near 7% in 2024–25—cool demand and shift company emphasis toward retention and ancillary services (concierge, maintenance, renovations). Regional divergence across Canada and the US requires flexible resource allocation and targeted marketing to preserve margins.

Inflation and wage pressure
Inflation (US CPI +3.4% in 2024) and roughly 4% wage growth pressured FirstService's service inputs and labor costs, making margin pass‑through harder. Contract indexing and transparent fee models enable recovery by tying fees to inflation. Investment in productivity tools and routing optimization (reducing travel and idle time) helps offset cost creep and preserve operating margins.

Insurance market hardening
Insurance market hardening has pushed commercial property and liability premiums roughly 20–30% higher in 2023–24, straining condominium and HOA budgets and prompting boards to trim nonessential services or phase capital projects to preserve reserves. FirstService can monetize risk-mitigation offerings (loss-prevention, roofing, claims advocacy) that demonstrably reduce renewal increases and help retain clients.
- Higher premiums: ~20–30% increase 2023–24
- Board responses: cut services/phase projects
- Opportunity: risk-mitigation services offset attrition
Franchisee capital access
FirstService Brands growth is sensitive to small-business financing; tight credit in 2024 slowed territory expansion and delayed equipment refresh cycles, with many franchisees citing higher borrowing costs after the Fed rate hikes between 2022–24.
Strong unit economics—average unit EBITDA margins in core brands reported by FirstService Brands management above 20%—and franchisor support programs have improved lender confidence and facilitated refinancing in 2024.
- Franchisee capital access: constrained by higher rates
- Impact: slower territory growth, delayed capex
- Offset: >20% unit EBITDA, stronger lender appetite
Fragmented bylaws, funding surge and input shocks strain housing services and retrofit pipelines
Higher rates (fed funds 5.25–5.50% 2024; 30‑yr mortgage ~6.7–7.0% 2024–25) compress HOA capital projects, shifting revenue to recurring management fees; inflation (US CPI ~3.4% 2024) and ~4% wage growth squeeze margins despite contract indexing. Insurance hardening (+20–30% 2023–24) forces boards to cut projects; FirstService can upsell risk‑mitigation. Franchisee growth slowed by tighter small‑business credit, offset by >20% unit EBITDA.
| Metric | Value |
|---|---|
| Fed funds (2024) | 5.25–5.50% |
| 30‑yr mortgage (2024–25) | 6.7–7.0% |
| US CPI (2024) | ~3.4% |
| Insurance premiums (2023–24) | +20–30% |
| Unit EBITDA | >20% |
Preview Before You Purchase
FirstService PESTLE Analysis
The preview shown here is the exact FirstService PESTLE Analysis you’ll receive after purchase—fully formatted and ready to use. It contains the same structured political, economic, social, technological, legal, and environmental insights visible here. No placeholders or teasers—this is the final downloadable file delivered immediately after checkout.

Plan Smarter. Present Sharper. Compete Stronger.
Unlock strategic clarity with our PESTLE Analysis of FirstService—three to five concise insights into political, economic, social, technological, legal, and environmental forces reshaping the business. Perfect for investors, consultants, and executives, this analysis turns external trends into actionable recommendations you can use immediately. Purchase the full report to access the complete, editable breakdown and make smarter, faster decisions.
Political factors
Municipal bylaws impact
Municipal bylaw changes on building codes, parking, noise and short‑term rentals across some 90,000 US local governments and roughly 3,700 Canadian municipalities reshape FirstService service scope and costs. The company must adapt procedures city‑by‑city and province/state‑by‑province/state to remain compliant. Close ties with councils and regulators help anticipate shifts and reduce operational disruption.
Housing policy shifts
Housing policy shifts — from affordable housing pushes to condominium governance and HOA rule changes — reshape demand for FirstService services: NLIHC estimated a 7.2 million shortfall of affordable rentals (2023), while FirstService Residential reports managing about 1.2 million homes, creating scale for management work. Subsidies and LIHTC-driven projects increase development-related service demand; tighter governance and compliance rules raise reporting and board-support burdens.
Infrastructure and resilience funds
Federal and state/provincial grants — driven by the US Infrastructure Investment and Jobs Act (IIJA) $1.2 trillion and the Inflation Reduction Act $369 billion — are expanding resiliency and retrofit maintenance pipelines that benefit property managers like FirstService. Accessing these programs requires careful navigation of procurement and eligibility rules, often adding administrative uplift. Timing and continuity of grant disbursements directly affect project backlog visibility and revenue phasing for service providers.
Immigration and labor stance
Immigration policies shape availability of frontline technicians and community staff for FirstService; Canada's 2024 immigration plan targets 485,000 new permanent residents and the US H-2B seasonal visa cap remains 66,000, influencing recruitment pipelines, wage pressure and time-to-hire across markets.
- Impact: tighter regimes → higher wages, longer hires
- Benefit: supportive policies → easier multi-market staffing
- Metric: Canada 2024 target 485,000; US H-2B cap 66,000
Trade and procurement exposure
Tariffs on lumber, steel and HVAC components materially raise FirstService project costs and can delay schedules; lumber prices swung over 50% in 2020–22 and steel rose ~60% in 2020–21, illustrating supply volatility. Cross‑border US‑Canada rules shape sourcing for key brands and logistics, affecting lead times and margins. Stable trade policy reduces pricing swings and client change orders, protecting margins.
- Tariff impact: input cost inflation and schedule risk
- Cross‑border: US‑Canada sourcing & lead‑time exposure
- Policy stability: lowers pricing volatility and change‑order incidence
Fragmented bylaws, funding surge and input shocks strain housing services and retrofit pipelines
Municipal bylaw fragmentation (≈90,000 US local governments, ≈3,700 Canadian municipalities) and housing policy shifts (FirstService Residential ≈1.2M homes) raise compliance and service demand. Federal grants (IIJA $1.2T, IRA $369B) boost retrofit pipelines; immigration targets (Canada 485,000; US H-2B 66,000) and input volatility (lumber +50%, steel +60%) pressure staffing and margins.
| Metric | Value |
|---|---|
| US local governments | ≈90,000 |
| Canadian municipalities | ≈3,700 |
| Managed homes | ≈1.2M |
| Canada 2024 target | 485,000 |
| US H-2B cap | 66,000 |
| IIJA / IRA | $1.2T / $369B |
What is included in the product
Detailed Word Document
Explores how macro-environmental factors uniquely affect FirstService across Political, Economic, Social, Technological, Environmental and Legal dimensions, with data-driven insights, forward-looking scenarios and practical implications for executives and investors.
Customizable Excel Spreadsheet
Condensed FirstService PESTLE provides a clear, visually segmented summary of external risks and opportunities—easy to drop into presentations, share across teams, and annotate for region- or business-specific planning.
Economic factors
Interest rates sensitivity
Higher rates, with the fed funds rate around 5.25–5.50% in 2024 and 30‑year mortgage averages near 6.7% (Freddie Mac 2024), often defer major HOA renovations and capital projects as financing and special assessments become costlier. Lower rates unlock refinancing and reserve-funded upgrades by reducing borrowing costs and raising cash flow. Rate cycles shift revenue mix toward recurring management fees in high‑rate periods and discretionary project work when rates fall.
Housing cycle dynamics
New condo and strata supply expands FirstService's addressable management units, even as higher borrowing costs—30-year US mortgage rates near 7% in 2024–25—cool demand and shift company emphasis toward retention and ancillary services (concierge, maintenance, renovations). Regional divergence across Canada and the US requires flexible resource allocation and targeted marketing to preserve margins.
Inflation and wage pressure
Inflation (US CPI +3.4% in 2024) and roughly 4% wage growth pressured FirstService's service inputs and labor costs, making margin pass‑through harder. Contract indexing and transparent fee models enable recovery by tying fees to inflation. Investment in productivity tools and routing optimization (reducing travel and idle time) helps offset cost creep and preserve operating margins.
Insurance market hardening
Insurance market hardening has pushed commercial property and liability premiums roughly 20–30% higher in 2023–24, straining condominium and HOA budgets and prompting boards to trim nonessential services or phase capital projects to preserve reserves. FirstService can monetize risk-mitigation offerings (loss-prevention, roofing, claims advocacy) that demonstrably reduce renewal increases and help retain clients.
- Higher premiums: ~20–30% increase 2023–24
- Board responses: cut services/phase projects
- Opportunity: risk-mitigation services offset attrition
Franchisee capital access
FirstService Brands growth is sensitive to small-business financing; tight credit in 2024 slowed territory expansion and delayed equipment refresh cycles, with many franchisees citing higher borrowing costs after the Fed rate hikes between 2022–24.
Strong unit economics—average unit EBITDA margins in core brands reported by FirstService Brands management above 20%—and franchisor support programs have improved lender confidence and facilitated refinancing in 2024.
- Franchisee capital access: constrained by higher rates
- Impact: slower territory growth, delayed capex
- Offset: >20% unit EBITDA, stronger lender appetite
Fragmented bylaws, funding surge and input shocks strain housing services and retrofit pipelines
Higher rates (fed funds 5.25–5.50% 2024; 30‑yr mortgage ~6.7–7.0% 2024–25) compress HOA capital projects, shifting revenue to recurring management fees; inflation (US CPI ~3.4% 2024) and ~4% wage growth squeeze margins despite contract indexing. Insurance hardening (+20–30% 2023–24) forces boards to cut projects; FirstService can upsell risk‑mitigation. Franchisee growth slowed by tighter small‑business credit, offset by >20% unit EBITDA.
| Metric | Value |
|---|---|
| Fed funds (2024) | 5.25–5.50% |
| 30‑yr mortgage (2024–25) | 6.7–7.0% |
| US CPI (2024) | ~3.4% |
| Insurance premiums (2023–24) | +20–30% |
| Unit EBITDA | >20% |
Preview Before You Purchase
FirstService PESTLE Analysis
The preview shown here is the exact FirstService PESTLE Analysis you’ll receive after purchase—fully formatted and ready to use. It contains the same structured political, economic, social, technological, legal, and environmental insights visible here. No placeholders or teasers—this is the final downloadable file delivered immediately after checkout.
Description
Plan Smarter. Present Sharper. Compete Stronger.
Unlock strategic clarity with our PESTLE Analysis of FirstService—three to five concise insights into political, economic, social, technological, legal, and environmental forces reshaping the business. Perfect for investors, consultants, and executives, this analysis turns external trends into actionable recommendations you can use immediately. Purchase the full report to access the complete, editable breakdown and make smarter, faster decisions.
Political factors
Municipal bylaws impact
Municipal bylaw changes on building codes, parking, noise and short‑term rentals across some 90,000 US local governments and roughly 3,700 Canadian municipalities reshape FirstService service scope and costs. The company must adapt procedures city‑by‑city and province/state‑by‑province/state to remain compliant. Close ties with councils and regulators help anticipate shifts and reduce operational disruption.
Housing policy shifts
Housing policy shifts — from affordable housing pushes to condominium governance and HOA rule changes — reshape demand for FirstService services: NLIHC estimated a 7.2 million shortfall of affordable rentals (2023), while FirstService Residential reports managing about 1.2 million homes, creating scale for management work. Subsidies and LIHTC-driven projects increase development-related service demand; tighter governance and compliance rules raise reporting and board-support burdens.
Infrastructure and resilience funds
Federal and state/provincial grants — driven by the US Infrastructure Investment and Jobs Act (IIJA) $1.2 trillion and the Inflation Reduction Act $369 billion — are expanding resiliency and retrofit maintenance pipelines that benefit property managers like FirstService. Accessing these programs requires careful navigation of procurement and eligibility rules, often adding administrative uplift. Timing and continuity of grant disbursements directly affect project backlog visibility and revenue phasing for service providers.
Immigration and labor stance
Immigration policies shape availability of frontline technicians and community staff for FirstService; Canada's 2024 immigration plan targets 485,000 new permanent residents and the US H-2B seasonal visa cap remains 66,000, influencing recruitment pipelines, wage pressure and time-to-hire across markets.
- Impact: tighter regimes → higher wages, longer hires
- Benefit: supportive policies → easier multi-market staffing
- Metric: Canada 2024 target 485,000; US H-2B cap 66,000
Trade and procurement exposure
Tariffs on lumber, steel and HVAC components materially raise FirstService project costs and can delay schedules; lumber prices swung over 50% in 2020–22 and steel rose ~60% in 2020–21, illustrating supply volatility. Cross‑border US‑Canada rules shape sourcing for key brands and logistics, affecting lead times and margins. Stable trade policy reduces pricing swings and client change orders, protecting margins.
- Tariff impact: input cost inflation and schedule risk
- Cross‑border: US‑Canada sourcing & lead‑time exposure
- Policy stability: lowers pricing volatility and change‑order incidence
Fragmented bylaws, funding surge and input shocks strain housing services and retrofit pipelines
Municipal bylaw fragmentation (≈90,000 US local governments, ≈3,700 Canadian municipalities) and housing policy shifts (FirstService Residential ≈1.2M homes) raise compliance and service demand. Federal grants (IIJA $1.2T, IRA $369B) boost retrofit pipelines; immigration targets (Canada 485,000; US H-2B 66,000) and input volatility (lumber +50%, steel +60%) pressure staffing and margins.
| Metric | Value |
|---|---|
| US local governments | ≈90,000 |
| Canadian municipalities | ≈3,700 |
| Managed homes | ≈1.2M |
| Canada 2024 target | 485,000 |
| US H-2B cap | 66,000 |
| IIJA / IRA | $1.2T / $369B |
What is included in the product
Detailed Word Document
Explores how macro-environmental factors uniquely affect FirstService across Political, Economic, Social, Technological, Environmental and Legal dimensions, with data-driven insights, forward-looking scenarios and practical implications for executives and investors.
Customizable Excel Spreadsheet
Condensed FirstService PESTLE provides a clear, visually segmented summary of external risks and opportunities—easy to drop into presentations, share across teams, and annotate for region- or business-specific planning.
Economic factors
Interest rates sensitivity
Higher rates, with the fed funds rate around 5.25–5.50% in 2024 and 30‑year mortgage averages near 6.7% (Freddie Mac 2024), often defer major HOA renovations and capital projects as financing and special assessments become costlier. Lower rates unlock refinancing and reserve-funded upgrades by reducing borrowing costs and raising cash flow. Rate cycles shift revenue mix toward recurring management fees in high‑rate periods and discretionary project work when rates fall.
Housing cycle dynamics
New condo and strata supply expands FirstService's addressable management units, even as higher borrowing costs—30-year US mortgage rates near 7% in 2024–25—cool demand and shift company emphasis toward retention and ancillary services (concierge, maintenance, renovations). Regional divergence across Canada and the US requires flexible resource allocation and targeted marketing to preserve margins.
Inflation and wage pressure
Inflation (US CPI +3.4% in 2024) and roughly 4% wage growth pressured FirstService's service inputs and labor costs, making margin pass‑through harder. Contract indexing and transparent fee models enable recovery by tying fees to inflation. Investment in productivity tools and routing optimization (reducing travel and idle time) helps offset cost creep and preserve operating margins.
Insurance market hardening
Insurance market hardening has pushed commercial property and liability premiums roughly 20–30% higher in 2023–24, straining condominium and HOA budgets and prompting boards to trim nonessential services or phase capital projects to preserve reserves. FirstService can monetize risk-mitigation offerings (loss-prevention, roofing, claims advocacy) that demonstrably reduce renewal increases and help retain clients.
- Higher premiums: ~20–30% increase 2023–24
- Board responses: cut services/phase projects
- Opportunity: risk-mitigation services offset attrition
Franchisee capital access
FirstService Brands growth is sensitive to small-business financing; tight credit in 2024 slowed territory expansion and delayed equipment refresh cycles, with many franchisees citing higher borrowing costs after the Fed rate hikes between 2022–24.
Strong unit economics—average unit EBITDA margins in core brands reported by FirstService Brands management above 20%—and franchisor support programs have improved lender confidence and facilitated refinancing in 2024.
- Franchisee capital access: constrained by higher rates
- Impact: slower territory growth, delayed capex
- Offset: >20% unit EBITDA, stronger lender appetite
Fragmented bylaws, funding surge and input shocks strain housing services and retrofit pipelines
Higher rates (fed funds 5.25–5.50% 2024; 30‑yr mortgage ~6.7–7.0% 2024–25) compress HOA capital projects, shifting revenue to recurring management fees; inflation (US CPI ~3.4% 2024) and ~4% wage growth squeeze margins despite contract indexing. Insurance hardening (+20–30% 2023–24) forces boards to cut projects; FirstService can upsell risk‑mitigation. Franchisee growth slowed by tighter small‑business credit, offset by >20% unit EBITDA.
| Metric | Value |
|---|---|
| Fed funds (2024) | 5.25–5.50% |
| 30‑yr mortgage (2024–25) | 6.7–7.0% |
| US CPI (2024) | ~3.4% |
| Insurance premiums (2023–24) | +20–30% |
| Unit EBITDA | >20% |
Preview Before You Purchase
FirstService PESTLE Analysis
The preview shown here is the exact FirstService PESTLE Analysis you’ll receive after purchase—fully formatted and ready to use. It contains the same structured political, economic, social, technological, legal, and environmental insights visible here. No placeholders or teasers—this is the final downloadable file delivered immediately after checkout.











