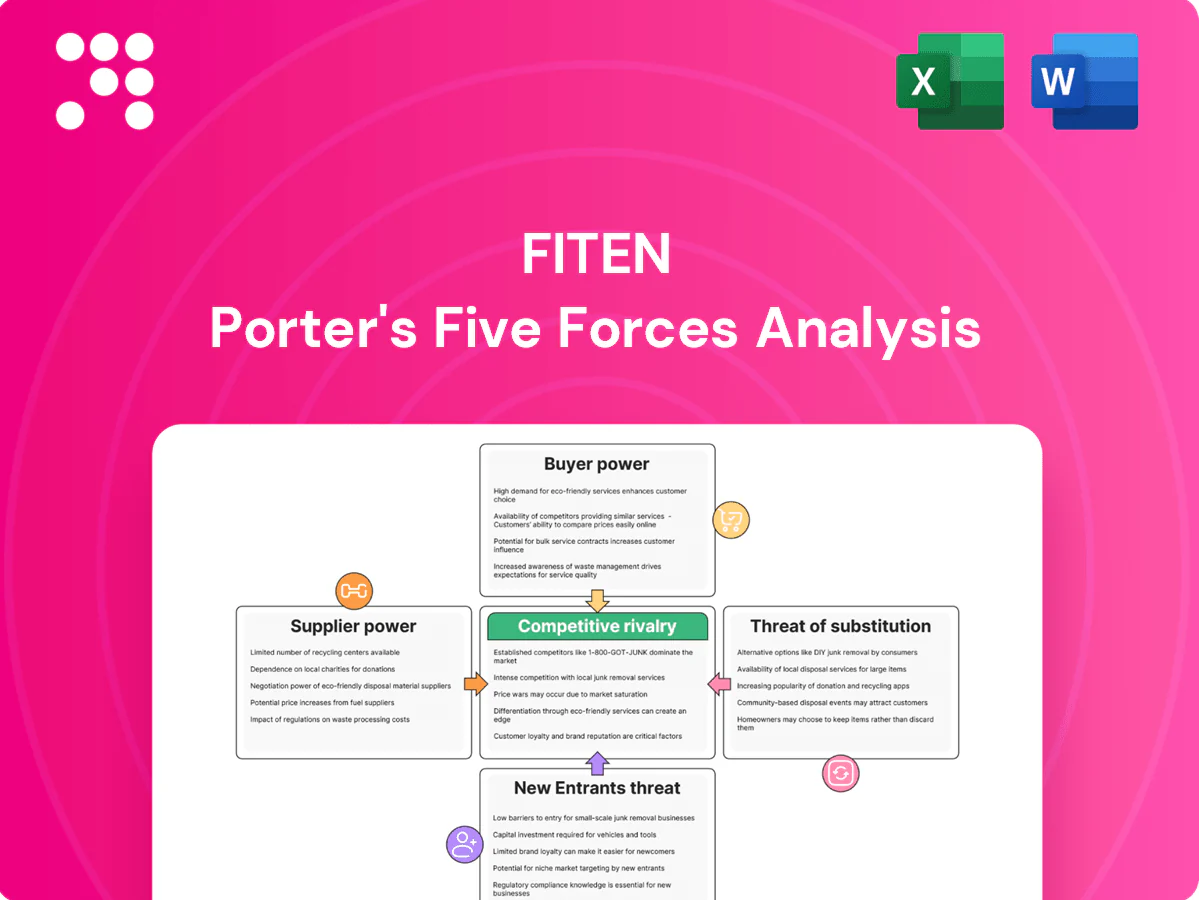
Fiten Porter's Five Forces Analysis

Elevate Your Analysis with the Complete Porter's Five Forces Analysis
Fiten’s Porter's Five Forces Analysis distills competitive pressures—from supplier leverage to substitute threats—into a concise strategic snapshot. The report highlights where Fiten holds advantage and where market risks persist. This brief teaser only scratches the surface; unlock the full analysis for force-by-force ratings, visuals, and actionable recommendations to inform investment or strategy.
Suppliers Bargaining Power

Tier-1 PV module makers concentrated
Global module supply is concentrated among Tier-1 firms, with China holding about 85% of manufacturing capacity in 2024, giving those makers leverage on pricing, delivery and warranty terms. Volatility in polysilicon and freight costs continues to transmit quickly to installers’ BOMs. Fiten can mitigate supplier power via multi-sourcing and framework contracts, but peak-demand periods still tighten terms. Local inventory buffers reduce disruption yet tie up working capital.
Inverter and battery OEM dependencies
String/central inverters and storage systems are concentrated among a few certified OEMs—top 5 inverter vendors account for over 60% of global shipments in 2024—raising switching costs via compatibility, monitoring and service ties. Firmware locks, warranty terms and spare-part control amplify supplier leverage; approved-vendor tender lists further restrict options. Diversifying SKUs and cross-training technicians cuts lock-in and reduces downtime risk.

Mounting, BOS, and grid-connection components
Racking, cabling and switchgear are broad markets but DSOs/standards often mandate specific protections and meters, constraining supplier choice. BOS typically represents ~25–30% of PV capex in 2024, and specialized components can have lead times >12 weeks, slowing cash conversion. Volume bundling can secure 5–12% discounts, yet rooftop customization limits standardization. Local distributors improve availability but commonly capture 5–15% margin.

Service subcontractors and skilled labor
Installation crews, roofers, electricians and O&M specialists held leverage in tight 2024 labor markets, with certification barriers (electrical, HSE, working at heights) shrinking the substitutable pool and peak-season day rates observed rising up to ~25%, complicating scheduling and margins.
- Labor scarcity: certification narrows pool ~20%
- Seasonal spikes: day rates +25%
- Mitigation: in-house teams
- Mitigation: long-term subcontractor agreements
Currency, trade policy, and warranty risk
FX swings (EUR/USD moved roughly 7% intrayear in 2024) change landed costs and give suppliers room to adjust pricing; tariffs and compliance rules (WTO reported average applied MFN tariff ~3.2% in 2023) shift more bargaining weight toward OEM contract terms, while extended warranty liabilities increase OEM exposure. Bankability and insurer backing for warranties narrow acceptable suppliers; hedging and insurance mitigate but do not remove supplier leverage.
- FX volatility: EUR/USD ~7% swing in 2024
- Tariff baseline: WTO average applied MFN tariff ~3.2% (2023)
- Warranty bankability restricts supplier pool
- Hedging/insurance reduce but do not eliminate supplier leverage
Supply concentrated: China ~85% modules; top‑5 inverters >60%; BOS 25–30%
Supplier power is high: China held ~85% of PV module capacity in 2024, concentrating pricing and lead‑time leverage. Top‑5 inverter vendors accounted for >60% of shipments, raising switching costs; BOS remains ~25–30% of capex with key items >12‑week lead times. Labor tightness pushed peak day rates +25% and FX (EUR/USD ~7% intrayear) amplified landed‑cost volatility.
| Metric | 2024 |
|---|---|
| Module capacity (China) | ~85% |
| Top‑5 inverter share | >60% |
| BOS share of capex | 25–30% |
| Peak labor rate rise | +25% |
| EUR/USD swing | ~7% |
What is included in the product
 Detailed Word Document
Tailored Porter's Five Forces analysis for Fiten that uncovers key drivers of competition, customer influence, supplier power, and market entry risks, identifying disruptive threats and substitutes that could erode market share. Detailed, data-backed insights highlight pricing pressures, barriers protecting incumbents, and strategic levers to strengthen Fiten’s competitive position.

 Customizable Excel Spreadsheet
Clear one-sheet Fiten Porter's Five Forces—instantly reveal strategic pressure with customizable force levels, spider chart visuals and no-macro ease, so teams quickly identify threats, plan responses and copy findings directly into decks or dashboards.
Customers Bargaining Power

Price transparency and competitive bidding
Both C&I and residential buyers routinely compare multiple quotes and public benchmarks, with 2024 auction-weighted bids often ranging 0.03–0.04 USD/kWh, amplifying buyer leverage. Tenders focus on LCOE and payback (many buyers targeting paybacks under six years), squeezing margins. Buyers push turnkey pricing and bundled O&M with 5–10% discount expectations; Fiten must defend price via quality, yield guarantees and strict SLAs.
Sensitivity to incentives and financing
Buyer willingness-to-pay is highly tied to incentives like the US 30% federal investment tax credit (ITC); when subsidies tighten customers demand deeper discounts or stronger performance guarantees. Offering financing or PPA structures shifts value from capex to cash-flow, broadening affordability and creating 10–25 year contractual lock-in that reduces buyer bargaining power.

Low pre-installation switching costs
Before contract signature customers can switch installers with minimal cost, leveraging rival offers to extract better terms. Standardized components in 2024 make proposals directly comparable, driving price-based selection. Rapid, data-driven proposals and site assessments allow Fiten to shorten decision cycles and reduce pre-install churn.

Post-install lock-in via O&M and platforms
After commissioning, monitoring software, warranties and consolidated service history create significant switching frictions for buyers; service-level agreements commonly target 99.9% uptime to justify ongoing loyalty. Buyers still demand responsive support and uptime guarantees, while performance-linked O&M aligns incentives and reduces disputes. Strong after-sales records progressively weaken buyers' renegotiation power.
- 99.9% SLA
- Performance-linked O&M reduces conflict
- Warranties + service history = higher switching cost
Reputation and referral effects
Online reviews and local referrals magnify buyer influence—studies in 2024 show roughly 88% of consumers consult reviews before hiring, rewarding top performers and punishing service issues. Large C&I clients use brand and reputational risk to demand tighter SLAs and penalties, while residential referral chains can shift regional share by several percentage points. Proactive QA/QC and transparent issue resolution reduce buyer bargaining power and churn.
- 88% review influence (2024)
- Large C&I demand tighter SLAs
- Referrals drive regional share shifts
Bids 0.03–0.04 USD/kWh, under 6-year paybacks; 10–25y PPAs lock buyers, 5–10% margin squeeze
Buyers compare bids (2024 auction-weighted 0.03–0.04 USD/kWh), target paybacks <6 years and seek 5–10% turnkey/O&M discounts, pressuring margins. Financing/PPA options shift to cash-flow and create 10–25 year lock-ins that reduce bargaining power. Post-commissioning 99.9% SLAs, warranties and service history raise switching costs; 88% consult reviews, amplifying reputational effects.
| Metric | 2024 Value |
|---|---|
| Auction-weighted bid | 0.03–0.04 USD/kWh |
| Target payback | <6 years |
| Typical discount demand | 5–10% |
| PPA lock-in | 10–25 years |
| Review influence | 88% |
| SLA | 99.9% |
Preview the Actual Deliverable
Fiten Porter's Five Forces Analysis
This preview shows the exact Fiten Porter's Five Forces Analysis you'll receive—no mockups, no placeholders. The document is fully formatted and ready for immediate download upon purchase. It presents a complete, professional assessment of competitive forces, implications and strategic recommendations. You’ll get this identical file instantly after payment.

Elevate Your Analysis with the Complete Porter's Five Forces Analysis
Fiten’s Porter's Five Forces Analysis distills competitive pressures—from supplier leverage to substitute threats—into a concise strategic snapshot. The report highlights where Fiten holds advantage and where market risks persist. This brief teaser only scratches the surface; unlock the full analysis for force-by-force ratings, visuals, and actionable recommendations to inform investment or strategy.
Suppliers Bargaining Power
Tier-1 PV module makers concentrated
Global module supply is concentrated among Tier-1 firms, with China holding about 85% of manufacturing capacity in 2024, giving those makers leverage on pricing, delivery and warranty terms. Volatility in polysilicon and freight costs continues to transmit quickly to installers’ BOMs. Fiten can mitigate supplier power via multi-sourcing and framework contracts, but peak-demand periods still tighten terms. Local inventory buffers reduce disruption yet tie up working capital.
Inverter and battery OEM dependencies
String/central inverters and storage systems are concentrated among a few certified OEMs—top 5 inverter vendors account for over 60% of global shipments in 2024—raising switching costs via compatibility, monitoring and service ties. Firmware locks, warranty terms and spare-part control amplify supplier leverage; approved-vendor tender lists further restrict options. Diversifying SKUs and cross-training technicians cuts lock-in and reduces downtime risk.
Mounting, BOS, and grid-connection components
Racking, cabling and switchgear are broad markets but DSOs/standards often mandate specific protections and meters, constraining supplier choice. BOS typically represents ~25–30% of PV capex in 2024, and specialized components can have lead times >12 weeks, slowing cash conversion. Volume bundling can secure 5–12% discounts, yet rooftop customization limits standardization. Local distributors improve availability but commonly capture 5–15% margin.
Service subcontractors and skilled labor
Installation crews, roofers, electricians and O&M specialists held leverage in tight 2024 labor markets, with certification barriers (electrical, HSE, working at heights) shrinking the substitutable pool and peak-season day rates observed rising up to ~25%, complicating scheduling and margins.
- Labor scarcity: certification narrows pool ~20%
- Seasonal spikes: day rates +25%
- Mitigation: in-house teams
- Mitigation: long-term subcontractor agreements
Currency, trade policy, and warranty risk
FX swings (EUR/USD moved roughly 7% intrayear in 2024) change landed costs and give suppliers room to adjust pricing; tariffs and compliance rules (WTO reported average applied MFN tariff ~3.2% in 2023) shift more bargaining weight toward OEM contract terms, while extended warranty liabilities increase OEM exposure. Bankability and insurer backing for warranties narrow acceptable suppliers; hedging and insurance mitigate but do not remove supplier leverage.
- FX volatility: EUR/USD ~7% swing in 2024
- Tariff baseline: WTO average applied MFN tariff ~3.2% (2023)
- Warranty bankability restricts supplier pool
- Hedging/insurance reduce but do not eliminate supplier leverage
Supply concentrated: China ~85% modules; top‑5 inverters >60%; BOS 25–30%
Supplier power is high: China held ~85% of PV module capacity in 2024, concentrating pricing and lead‑time leverage. Top‑5 inverter vendors accounted for >60% of shipments, raising switching costs; BOS remains ~25–30% of capex with key items >12‑week lead times. Labor tightness pushed peak day rates +25% and FX (EUR/USD ~7% intrayear) amplified landed‑cost volatility.
| Metric | 2024 |
|---|---|
| Module capacity (China) | ~85% |
| Top‑5 inverter share | >60% |
| BOS share of capex | 25–30% |
| Peak labor rate rise | +25% |
| EUR/USD swing | ~7% |
What is included in the product
Detailed Word Document
Tailored Porter's Five Forces analysis for Fiten that uncovers key drivers of competition, customer influence, supplier power, and market entry risks, identifying disruptive threats and substitutes that could erode market share. Detailed, data-backed insights highlight pricing pressures, barriers protecting incumbents, and strategic levers to strengthen Fiten’s competitive position.
Customizable Excel Spreadsheet
Clear one-sheet Fiten Porter's Five Forces—instantly reveal strategic pressure with customizable force levels, spider chart visuals and no-macro ease, so teams quickly identify threats, plan responses and copy findings directly into decks or dashboards.
Customers Bargaining Power
Price transparency and competitive bidding
Both C&I and residential buyers routinely compare multiple quotes and public benchmarks, with 2024 auction-weighted bids often ranging 0.03–0.04 USD/kWh, amplifying buyer leverage. Tenders focus on LCOE and payback (many buyers targeting paybacks under six years), squeezing margins. Buyers push turnkey pricing and bundled O&M with 5–10% discount expectations; Fiten must defend price via quality, yield guarantees and strict SLAs.
Sensitivity to incentives and financing
Buyer willingness-to-pay is highly tied to incentives like the US 30% federal investment tax credit (ITC); when subsidies tighten customers demand deeper discounts or stronger performance guarantees. Offering financing or PPA structures shifts value from capex to cash-flow, broadening affordability and creating 10–25 year contractual lock-in that reduces buyer bargaining power.
Low pre-installation switching costs
Before contract signature customers can switch installers with minimal cost, leveraging rival offers to extract better terms. Standardized components in 2024 make proposals directly comparable, driving price-based selection. Rapid, data-driven proposals and site assessments allow Fiten to shorten decision cycles and reduce pre-install churn.
Post-install lock-in via O&M and platforms
After commissioning, monitoring software, warranties and consolidated service history create significant switching frictions for buyers; service-level agreements commonly target 99.9% uptime to justify ongoing loyalty. Buyers still demand responsive support and uptime guarantees, while performance-linked O&M aligns incentives and reduces disputes. Strong after-sales records progressively weaken buyers' renegotiation power.
- 99.9% SLA
- Performance-linked O&M reduces conflict
- Warranties + service history = higher switching cost
Reputation and referral effects
Online reviews and local referrals magnify buyer influence—studies in 2024 show roughly 88% of consumers consult reviews before hiring, rewarding top performers and punishing service issues. Large C&I clients use brand and reputational risk to demand tighter SLAs and penalties, while residential referral chains can shift regional share by several percentage points. Proactive QA/QC and transparent issue resolution reduce buyer bargaining power and churn.
- 88% review influence (2024)
- Large C&I demand tighter SLAs
- Referrals drive regional share shifts
Bids 0.03–0.04 USD/kWh, under 6-year paybacks; 10–25y PPAs lock buyers, 5–10% margin squeeze
Buyers compare bids (2024 auction-weighted 0.03–0.04 USD/kWh), target paybacks <6 years and seek 5–10% turnkey/O&M discounts, pressuring margins. Financing/PPA options shift to cash-flow and create 10–25 year lock-ins that reduce bargaining power. Post-commissioning 99.9% SLAs, warranties and service history raise switching costs; 88% consult reviews, amplifying reputational effects.
| Metric | 2024 Value |
|---|---|
| Auction-weighted bid | 0.03–0.04 USD/kWh |
| Target payback | <6 years |
| Typical discount demand | 5–10% |
| PPA lock-in | 10–25 years |
| Review influence | 88% |
| SLA | 99.9% |
Preview the Actual Deliverable
Fiten Porter's Five Forces Analysis
This preview shows the exact Fiten Porter's Five Forces Analysis you'll receive—no mockups, no placeholders. The document is fully formatted and ready for immediate download upon purchase. It presents a complete, professional assessment of competitive forces, implications and strategic recommendations. You’ll get this identical file instantly after payment.
Description
Elevate Your Analysis with the Complete Porter's Five Forces Analysis
Fiten’s Porter's Five Forces Analysis distills competitive pressures—from supplier leverage to substitute threats—into a concise strategic snapshot. The report highlights where Fiten holds advantage and where market risks persist. This brief teaser only scratches the surface; unlock the full analysis for force-by-force ratings, visuals, and actionable recommendations to inform investment or strategy.
Suppliers Bargaining Power
Tier-1 PV module makers concentrated
Global module supply is concentrated among Tier-1 firms, with China holding about 85% of manufacturing capacity in 2024, giving those makers leverage on pricing, delivery and warranty terms. Volatility in polysilicon and freight costs continues to transmit quickly to installers’ BOMs. Fiten can mitigate supplier power via multi-sourcing and framework contracts, but peak-demand periods still tighten terms. Local inventory buffers reduce disruption yet tie up working capital.
Inverter and battery OEM dependencies
String/central inverters and storage systems are concentrated among a few certified OEMs—top 5 inverter vendors account for over 60% of global shipments in 2024—raising switching costs via compatibility, monitoring and service ties. Firmware locks, warranty terms and spare-part control amplify supplier leverage; approved-vendor tender lists further restrict options. Diversifying SKUs and cross-training technicians cuts lock-in and reduces downtime risk.
Mounting, BOS, and grid-connection components
Racking, cabling and switchgear are broad markets but DSOs/standards often mandate specific protections and meters, constraining supplier choice. BOS typically represents ~25–30% of PV capex in 2024, and specialized components can have lead times >12 weeks, slowing cash conversion. Volume bundling can secure 5–12% discounts, yet rooftop customization limits standardization. Local distributors improve availability but commonly capture 5–15% margin.
Service subcontractors and skilled labor
Installation crews, roofers, electricians and O&M specialists held leverage in tight 2024 labor markets, with certification barriers (electrical, HSE, working at heights) shrinking the substitutable pool and peak-season day rates observed rising up to ~25%, complicating scheduling and margins.
- Labor scarcity: certification narrows pool ~20%
- Seasonal spikes: day rates +25%
- Mitigation: in-house teams
- Mitigation: long-term subcontractor agreements
Currency, trade policy, and warranty risk
FX swings (EUR/USD moved roughly 7% intrayear in 2024) change landed costs and give suppliers room to adjust pricing; tariffs and compliance rules (WTO reported average applied MFN tariff ~3.2% in 2023) shift more bargaining weight toward OEM contract terms, while extended warranty liabilities increase OEM exposure. Bankability and insurer backing for warranties narrow acceptable suppliers; hedging and insurance mitigate but do not remove supplier leverage.
- FX volatility: EUR/USD ~7% swing in 2024
- Tariff baseline: WTO average applied MFN tariff ~3.2% (2023)
- Warranty bankability restricts supplier pool
- Hedging/insurance reduce but do not eliminate supplier leverage
Supply concentrated: China ~85% modules; top‑5 inverters >60%; BOS 25–30%
Supplier power is high: China held ~85% of PV module capacity in 2024, concentrating pricing and lead‑time leverage. Top‑5 inverter vendors accounted for >60% of shipments, raising switching costs; BOS remains ~25–30% of capex with key items >12‑week lead times. Labor tightness pushed peak day rates +25% and FX (EUR/USD ~7% intrayear) amplified landed‑cost volatility.
| Metric | 2024 |
|---|---|
| Module capacity (China) | ~85% |
| Top‑5 inverter share | >60% |
| BOS share of capex | 25–30% |
| Peak labor rate rise | +25% |
| EUR/USD swing | ~7% |
What is included in the product
Detailed Word Document
Tailored Porter's Five Forces analysis for Fiten that uncovers key drivers of competition, customer influence, supplier power, and market entry risks, identifying disruptive threats and substitutes that could erode market share. Detailed, data-backed insights highlight pricing pressures, barriers protecting incumbents, and strategic levers to strengthen Fiten’s competitive position.
Customizable Excel Spreadsheet
Clear one-sheet Fiten Porter's Five Forces—instantly reveal strategic pressure with customizable force levels, spider chart visuals and no-macro ease, so teams quickly identify threats, plan responses and copy findings directly into decks or dashboards.
Customers Bargaining Power
Price transparency and competitive bidding
Both C&I and residential buyers routinely compare multiple quotes and public benchmarks, with 2024 auction-weighted bids often ranging 0.03–0.04 USD/kWh, amplifying buyer leverage. Tenders focus on LCOE and payback (many buyers targeting paybacks under six years), squeezing margins. Buyers push turnkey pricing and bundled O&M with 5–10% discount expectations; Fiten must defend price via quality, yield guarantees and strict SLAs.
Sensitivity to incentives and financing
Buyer willingness-to-pay is highly tied to incentives like the US 30% federal investment tax credit (ITC); when subsidies tighten customers demand deeper discounts or stronger performance guarantees. Offering financing or PPA structures shifts value from capex to cash-flow, broadening affordability and creating 10–25 year contractual lock-in that reduces buyer bargaining power.
Low pre-installation switching costs
Before contract signature customers can switch installers with minimal cost, leveraging rival offers to extract better terms. Standardized components in 2024 make proposals directly comparable, driving price-based selection. Rapid, data-driven proposals and site assessments allow Fiten to shorten decision cycles and reduce pre-install churn.
Post-install lock-in via O&M and platforms
After commissioning, monitoring software, warranties and consolidated service history create significant switching frictions for buyers; service-level agreements commonly target 99.9% uptime to justify ongoing loyalty. Buyers still demand responsive support and uptime guarantees, while performance-linked O&M aligns incentives and reduces disputes. Strong after-sales records progressively weaken buyers' renegotiation power.
- 99.9% SLA
- Performance-linked O&M reduces conflict
- Warranties + service history = higher switching cost
Reputation and referral effects
Online reviews and local referrals magnify buyer influence—studies in 2024 show roughly 88% of consumers consult reviews before hiring, rewarding top performers and punishing service issues. Large C&I clients use brand and reputational risk to demand tighter SLAs and penalties, while residential referral chains can shift regional share by several percentage points. Proactive QA/QC and transparent issue resolution reduce buyer bargaining power and churn.
- 88% review influence (2024)
- Large C&I demand tighter SLAs
- Referrals drive regional share shifts
Bids 0.03–0.04 USD/kWh, under 6-year paybacks; 10–25y PPAs lock buyers, 5–10% margin squeeze
Buyers compare bids (2024 auction-weighted 0.03–0.04 USD/kWh), target paybacks <6 years and seek 5–10% turnkey/O&M discounts, pressuring margins. Financing/PPA options shift to cash-flow and create 10–25 year lock-ins that reduce bargaining power. Post-commissioning 99.9% SLAs, warranties and service history raise switching costs; 88% consult reviews, amplifying reputational effects.
| Metric | 2024 Value |
|---|---|
| Auction-weighted bid | 0.03–0.04 USD/kWh |
| Target payback | <6 years |
| Typical discount demand | 5–10% |
| PPA lock-in | 10–25 years |
| Review influence | 88% |
| SLA | 99.9% |
Preview the Actual Deliverable
Fiten Porter's Five Forces Analysis
This preview shows the exact Fiten Porter's Five Forces Analysis you'll receive—no mockups, no placeholders. The document is fully formatted and ready for immediate download upon purchase. It presents a complete, professional assessment of competitive forces, implications and strategic recommendations. You’ll get this identical file instantly after payment.











