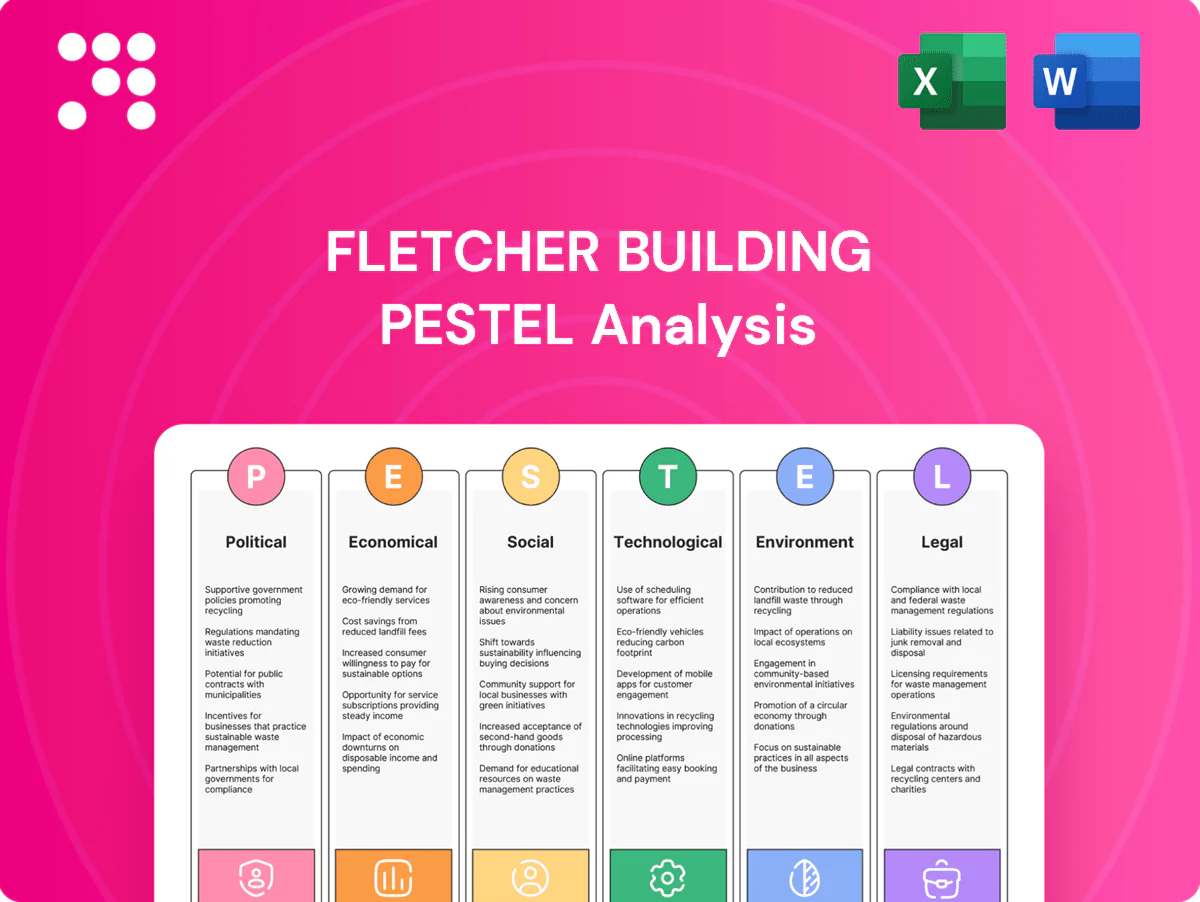
Fletcher Building PESTLE Analysis

Your Shortcut to Market Insight Starts Here
Understand how political shifts, economic cycles, and sustainability trends are reshaping Fletcher Building’s competitive landscape with our targeted PESTLE analysis. This concise briefing highlights risks and opportunities to inform investment and strategic decisions. Purchase the full report for the complete, ready-to-use breakdown and actionable recommendations.
Political factors

NZ and AU infrastructure spending cycles
Government capital programs in New Zealand and Australia directly shape Fletcher Building’s project pipeline, with multi‑year transport, water and social infrastructure programs forming the backbone of public-sector demand. Election cycles — New Zealand held a general election in 2023 and Australia faces a federal election by 2025 — introduce timing and reprioritization risks. Multi‑year budgets help stabilize demand but allocations can shift between cycles. Active government engagement and tender readiness are therefore critical to capture allocated projects.
Housing policy and incentives
Policies such as first‑home grants, density rules and urban rezoning directly shape residential volumes, driving Fletcher Building to scale subdivision and prefabrication capacity when governments push affordable housing programs and to restrain starts when investor lending is tightened.

Procurement and local content rules
Public procurement represents about 12% of GDP (OECD) and increasingly embeds local content and sustainability criteria, boosting demand for domestic concrete, steel and timber producers. This trend can benefit Fletcher Building’s materials divisions but imposes heavier documentation and audit burdens for compliance. Strategic sourcing, supplier consolidation and third-party sustainability certification materially strengthen tender competitiveness.

Trade relations and tariffs
Bilateral relations under the 1983 CER framework keep AU–NZ supply chains fluid for inputs like steel, chemicals and machinery, supporting Fletcher Building's regional sourcing in 2024.
Tariff shifts or antidumping measures can widen cost gaps versus offshore rivals, increasing margin pressure during trade disputes.
Stable AU–NZ ties help, but global tensions add volatility; hedging and supplier diversification reduce exposure.
Regional and council planning regimes
Local government planning decisions across New Zealands 67 territorial authorities directly affect Fletcher Building project approvals and timelines; the 2023 RMA reforms continue to reshape consenting pathways. Infrastructure consents, zoning and impact assessments can materially delay or accelerate projects, while proactive stakeholder engagement reduces objections and rework. Early design alignment with new planning codes cuts approval risk and cost.
- 67 territorial authorities: local variance
- 2023 RMA reforms: changed consenting framework
- Stakeholder engagement lowers rework/appeals
NZ and AU public procurement, elections and rules reshape materials demand and timing
Government capital programs in NZ and AU shape Fletcher Building’s pipeline; NZ held a general election in 2023 and AU faces a federal election by 2025, creating timing/reprioritization risk. Public procurement is ~12% of GDP (OECD), with local content and sustainability rules boosting materials demand but raising compliance burdens. NZ’s 67 territorial authorities and 2023 RMA reforms materially affect consenting timelines.
| Metric | Value |
|---|---|
| Public procurement | ~12% GDP (OECD) |
| Territorial authorities | 67 |
| CER | Since 1983 |
| NZ election | 2023 |
| AU federal election | By 2025 |
What is included in the product
 Detailed Word Document
Explores how macro-environmental factors uniquely affect Fletcher Building across Political, Economic, Social, Technological, Environmental and Legal dimensions, with data-backed trends and region-specific regulatory context; designed for executives and investors, it delivers actionable, forward-looking insights ready for inclusion in plans, pitch decks or reports.

 Customizable Excel Spreadsheet
A concise, visually segmented Fletcher Building PESTLE summary that supports quick alignment across teams, is easily dropped into presentations or planning sessions, and editable for regional or business-line specific notes.
Economic factors

Construction cycle and GDP sensitivity
Construction demand for Fletcher Building (NZX: FBU) is highly pro‑cyclical with GDP and business investment; New Zealand GDP growth slowed to about 0.8% in 2024, compressing volumes and margins while expansions raise plant utilisation. Backlog across residential, commercial and infrastructure contracts smooths volatility—Fletcher reported diverse orderbooks in FY2024 with revenues near NZ$6.9bn. Scenario planning is used to rebalance capacity and preserve margins.
Interest rates and housing affordability
Policy rates drive mortgage costs and feasibility for developers; New Zealand’s OCR around 5.5% in 2024 pushed typical fixed mortgage rates to roughly 6.5–7.0%, squeezing affordability and project feasibility. Higher rates dampened residential starts and renovations—consents fell ~10% y/y in parts of 2024—while easing would support a rebound. Fletcher’s exposure across price points helps hedge swings, and dynamic pricing plus tight inventory control protect cash flow and margin resilience.

Input cost inflation and FX
Energy, cement clinker, aggregates, steel and freight materially drive Fletcher Building’s COGS, with industry reports showing commodity price volatility pushing construction input costs higher in 2024–25. NZD and AUD movements (NZD ~0.57 USD, AUD ~0.65 USD in mid‑2025) raise costs for imported equipment and materials. Pass‑through via surcharges or indexation remains vital to protect margins. Ongoing operational efficiency programs offset residual inflationary pressure.

Labor availability and wage pressure
Skilled trades and project-management shortages push up wages and subcontractor rates for Fletcher Building; FY24 revenue NZ$8.8b and ~13,000 employees concentrate delivery risk across high-cost projects. Migration settings and apprenticeship pipelines constrain supply, while productivity tools and modular methods cut labor intensity and cycle times. Strategic workforce planning sustains delivery capacity and margins.
- Wage pressure: higher subcontractor rates
- Supply: migration & apprenticeship pipelines
- Efficiency: modular methods & digital tools
- Mitigation: strategic workforce planning
Commodity and housing market volatility
Fluctuating commodity prices—lumber and steel swings—shift relative attractiveness of materials, pressuring margins; Fletcher Building reported NZD 6.4bn revenue in FY2024, highlighting material-cost sensitivity. Housing price volatility undermines developer confidence and presales, with New Zealand dwelling values down ~6% year‑on‑year to mid‑2024. Strong exposure to repair and maintenance provides resilience, while disciplined bidding preserves margins in softer markets.
- Commodity sensitivity: NZD 6.4bn FY2024 revenue
- Housing swing: NZ dwelling values ~‑6% y/y (mid‑2024)
- Resilience: repair/maintenance mix
- Risk control: disciplined bidding protects returns
NZ and AU public procurement, elections and rules reshape materials demand and timing
Construction demand is pro‑cyclical (NZ GDP ~0.8% in 2024) with backlog smoothing volumes; Fletcher reported revenues near NZ$6.9bn (FY2024). OCR ~5.5% lifted mortgage rates to ~6.5–7.0%, consents fell ~10% y/y and NZ dwelling values were down ~6% mid‑2024. Commodity volatility and NZD ~0.57 USD (mid‑2025) drive input costs and margin pressure.
| Metric | Value |
|---|---|
| NZ GDP (2024) | ~0.8% |
| OCR (2024) | ~5.5% |
| Mortgage rates | ~6.5–7.0% |
| Consents | ‑10% y/y |
| Dwelling values | ‑6% y/y |
| NZD/USD (mid‑2025) | ~0.57 |
| Fletcher rev (FY2024) | ~NZ$6.9bn |
Same Document Delivered
Fletcher Building PESTLE Analysis
The preview shown here is the exact document you'll receive after purchase—fully formatted and ready to use. This Fletcher Building PESTLE Analysis contains the same layout, content, and professional structure visible now. No placeholders or teasers: after checkout you’ll instantly download this final, ready-to-use file.

Your Shortcut to Market Insight Starts Here
Understand how political shifts, economic cycles, and sustainability trends are reshaping Fletcher Building’s competitive landscape with our targeted PESTLE analysis. This concise briefing highlights risks and opportunities to inform investment and strategic decisions. Purchase the full report for the complete, ready-to-use breakdown and actionable recommendations.
Political factors
NZ and AU infrastructure spending cycles
Government capital programs in New Zealand and Australia directly shape Fletcher Building’s project pipeline, with multi‑year transport, water and social infrastructure programs forming the backbone of public-sector demand. Election cycles — New Zealand held a general election in 2023 and Australia faces a federal election by 2025 — introduce timing and reprioritization risks. Multi‑year budgets help stabilize demand but allocations can shift between cycles. Active government engagement and tender readiness are therefore critical to capture allocated projects.
Housing policy and incentives
Policies such as first‑home grants, density rules and urban rezoning directly shape residential volumes, driving Fletcher Building to scale subdivision and prefabrication capacity when governments push affordable housing programs and to restrain starts when investor lending is tightened.
Procurement and local content rules
Public procurement represents about 12% of GDP (OECD) and increasingly embeds local content and sustainability criteria, boosting demand for domestic concrete, steel and timber producers. This trend can benefit Fletcher Building’s materials divisions but imposes heavier documentation and audit burdens for compliance. Strategic sourcing, supplier consolidation and third-party sustainability certification materially strengthen tender competitiveness.
Trade relations and tariffs
Bilateral relations under the 1983 CER framework keep AU–NZ supply chains fluid for inputs like steel, chemicals and machinery, supporting Fletcher Building's regional sourcing in 2024.
Tariff shifts or antidumping measures can widen cost gaps versus offshore rivals, increasing margin pressure during trade disputes.
Stable AU–NZ ties help, but global tensions add volatility; hedging and supplier diversification reduce exposure.
Regional and council planning regimes
Local government planning decisions across New Zealands 67 territorial authorities directly affect Fletcher Building project approvals and timelines; the 2023 RMA reforms continue to reshape consenting pathways. Infrastructure consents, zoning and impact assessments can materially delay or accelerate projects, while proactive stakeholder engagement reduces objections and rework. Early design alignment with new planning codes cuts approval risk and cost.
- 67 territorial authorities: local variance
- 2023 RMA reforms: changed consenting framework
- Stakeholder engagement lowers rework/appeals
NZ and AU public procurement, elections and rules reshape materials demand and timing
Government capital programs in NZ and AU shape Fletcher Building’s pipeline; NZ held a general election in 2023 and AU faces a federal election by 2025, creating timing/reprioritization risk. Public procurement is ~12% of GDP (OECD), with local content and sustainability rules boosting materials demand but raising compliance burdens. NZ’s 67 territorial authorities and 2023 RMA reforms materially affect consenting timelines.
| Metric | Value |
|---|---|
| Public procurement | ~12% GDP (OECD) |
| Territorial authorities | 67 |
| CER | Since 1983 |
| NZ election | 2023 |
| AU federal election | By 2025 |
What is included in the product
Detailed Word Document
Explores how macro-environmental factors uniquely affect Fletcher Building across Political, Economic, Social, Technological, Environmental and Legal dimensions, with data-backed trends and region-specific regulatory context; designed for executives and investors, it delivers actionable, forward-looking insights ready for inclusion in plans, pitch decks or reports.
Customizable Excel Spreadsheet
A concise, visually segmented Fletcher Building PESTLE summary that supports quick alignment across teams, is easily dropped into presentations or planning sessions, and editable for regional or business-line specific notes.
Economic factors
Construction cycle and GDP sensitivity
Construction demand for Fletcher Building (NZX: FBU) is highly pro‑cyclical with GDP and business investment; New Zealand GDP growth slowed to about 0.8% in 2024, compressing volumes and margins while expansions raise plant utilisation. Backlog across residential, commercial and infrastructure contracts smooths volatility—Fletcher reported diverse orderbooks in FY2024 with revenues near NZ$6.9bn. Scenario planning is used to rebalance capacity and preserve margins.
Interest rates and housing affordability
Policy rates drive mortgage costs and feasibility for developers; New Zealand’s OCR around 5.5% in 2024 pushed typical fixed mortgage rates to roughly 6.5–7.0%, squeezing affordability and project feasibility. Higher rates dampened residential starts and renovations—consents fell ~10% y/y in parts of 2024—while easing would support a rebound. Fletcher’s exposure across price points helps hedge swings, and dynamic pricing plus tight inventory control protect cash flow and margin resilience.
Input cost inflation and FX
Energy, cement clinker, aggregates, steel and freight materially drive Fletcher Building’s COGS, with industry reports showing commodity price volatility pushing construction input costs higher in 2024–25. NZD and AUD movements (NZD ~0.57 USD, AUD ~0.65 USD in mid‑2025) raise costs for imported equipment and materials. Pass‑through via surcharges or indexation remains vital to protect margins. Ongoing operational efficiency programs offset residual inflationary pressure.
Labor availability and wage pressure
Skilled trades and project-management shortages push up wages and subcontractor rates for Fletcher Building; FY24 revenue NZ$8.8b and ~13,000 employees concentrate delivery risk across high-cost projects. Migration settings and apprenticeship pipelines constrain supply, while productivity tools and modular methods cut labor intensity and cycle times. Strategic workforce planning sustains delivery capacity and margins.
- Wage pressure: higher subcontractor rates
- Supply: migration & apprenticeship pipelines
- Efficiency: modular methods & digital tools
- Mitigation: strategic workforce planning
Commodity and housing market volatility
Fluctuating commodity prices—lumber and steel swings—shift relative attractiveness of materials, pressuring margins; Fletcher Building reported NZD 6.4bn revenue in FY2024, highlighting material-cost sensitivity. Housing price volatility undermines developer confidence and presales, with New Zealand dwelling values down ~6% year‑on‑year to mid‑2024. Strong exposure to repair and maintenance provides resilience, while disciplined bidding preserves margins in softer markets.
- Commodity sensitivity: NZD 6.4bn FY2024 revenue
- Housing swing: NZ dwelling values ~‑6% y/y (mid‑2024)
- Resilience: repair/maintenance mix
- Risk control: disciplined bidding protects returns
NZ and AU public procurement, elections and rules reshape materials demand and timing
Construction demand is pro‑cyclical (NZ GDP ~0.8% in 2024) with backlog smoothing volumes; Fletcher reported revenues near NZ$6.9bn (FY2024). OCR ~5.5% lifted mortgage rates to ~6.5–7.0%, consents fell ~10% y/y and NZ dwelling values were down ~6% mid‑2024. Commodity volatility and NZD ~0.57 USD (mid‑2025) drive input costs and margin pressure.
| Metric | Value |
|---|---|
| NZ GDP (2024) | ~0.8% |
| OCR (2024) | ~5.5% |
| Mortgage rates | ~6.5–7.0% |
| Consents | ‑10% y/y |
| Dwelling values | ‑6% y/y |
| NZD/USD (mid‑2025) | ~0.57 |
| Fletcher rev (FY2024) | ~NZ$6.9bn |
Same Document Delivered
Fletcher Building PESTLE Analysis
The preview shown here is the exact document you'll receive after purchase—fully formatted and ready to use. This Fletcher Building PESTLE Analysis contains the same layout, content, and professional structure visible now. No placeholders or teasers: after checkout you’ll instantly download this final, ready-to-use file.
Original: $10.00
-65%$10.00
$3.50Description
Your Shortcut to Market Insight Starts Here
Understand how political shifts, economic cycles, and sustainability trends are reshaping Fletcher Building’s competitive landscape with our targeted PESTLE analysis. This concise briefing highlights risks and opportunities to inform investment and strategic decisions. Purchase the full report for the complete, ready-to-use breakdown and actionable recommendations.
Political factors
NZ and AU infrastructure spending cycles
Government capital programs in New Zealand and Australia directly shape Fletcher Building’s project pipeline, with multi‑year transport, water and social infrastructure programs forming the backbone of public-sector demand. Election cycles — New Zealand held a general election in 2023 and Australia faces a federal election by 2025 — introduce timing and reprioritization risks. Multi‑year budgets help stabilize demand but allocations can shift between cycles. Active government engagement and tender readiness are therefore critical to capture allocated projects.
Housing policy and incentives
Policies such as first‑home grants, density rules and urban rezoning directly shape residential volumes, driving Fletcher Building to scale subdivision and prefabrication capacity when governments push affordable housing programs and to restrain starts when investor lending is tightened.
Procurement and local content rules
Public procurement represents about 12% of GDP (OECD) and increasingly embeds local content and sustainability criteria, boosting demand for domestic concrete, steel and timber producers. This trend can benefit Fletcher Building’s materials divisions but imposes heavier documentation and audit burdens for compliance. Strategic sourcing, supplier consolidation and third-party sustainability certification materially strengthen tender competitiveness.
Trade relations and tariffs
Bilateral relations under the 1983 CER framework keep AU–NZ supply chains fluid for inputs like steel, chemicals and machinery, supporting Fletcher Building's regional sourcing in 2024.
Tariff shifts or antidumping measures can widen cost gaps versus offshore rivals, increasing margin pressure during trade disputes.
Stable AU–NZ ties help, but global tensions add volatility; hedging and supplier diversification reduce exposure.
Regional and council planning regimes
Local government planning decisions across New Zealands 67 territorial authorities directly affect Fletcher Building project approvals and timelines; the 2023 RMA reforms continue to reshape consenting pathways. Infrastructure consents, zoning and impact assessments can materially delay or accelerate projects, while proactive stakeholder engagement reduces objections and rework. Early design alignment with new planning codes cuts approval risk and cost.
- 67 territorial authorities: local variance
- 2023 RMA reforms: changed consenting framework
- Stakeholder engagement lowers rework/appeals
NZ and AU public procurement, elections and rules reshape materials demand and timing
Government capital programs in NZ and AU shape Fletcher Building’s pipeline; NZ held a general election in 2023 and AU faces a federal election by 2025, creating timing/reprioritization risk. Public procurement is ~12% of GDP (OECD), with local content and sustainability rules boosting materials demand but raising compliance burdens. NZ’s 67 territorial authorities and 2023 RMA reforms materially affect consenting timelines.
| Metric | Value |
|---|---|
| Public procurement | ~12% GDP (OECD) |
| Territorial authorities | 67 |
| CER | Since 1983 |
| NZ election | 2023 |
| AU federal election | By 2025 |
What is included in the product
Detailed Word Document
Explores how macro-environmental factors uniquely affect Fletcher Building across Political, Economic, Social, Technological, Environmental and Legal dimensions, with data-backed trends and region-specific regulatory context; designed for executives and investors, it delivers actionable, forward-looking insights ready for inclusion in plans, pitch decks or reports.
Customizable Excel Spreadsheet
A concise, visually segmented Fletcher Building PESTLE summary that supports quick alignment across teams, is easily dropped into presentations or planning sessions, and editable for regional or business-line specific notes.
Economic factors
Construction cycle and GDP sensitivity
Construction demand for Fletcher Building (NZX: FBU) is highly pro‑cyclical with GDP and business investment; New Zealand GDP growth slowed to about 0.8% in 2024, compressing volumes and margins while expansions raise plant utilisation. Backlog across residential, commercial and infrastructure contracts smooths volatility—Fletcher reported diverse orderbooks in FY2024 with revenues near NZ$6.9bn. Scenario planning is used to rebalance capacity and preserve margins.
Interest rates and housing affordability
Policy rates drive mortgage costs and feasibility for developers; New Zealand’s OCR around 5.5% in 2024 pushed typical fixed mortgage rates to roughly 6.5–7.0%, squeezing affordability and project feasibility. Higher rates dampened residential starts and renovations—consents fell ~10% y/y in parts of 2024—while easing would support a rebound. Fletcher’s exposure across price points helps hedge swings, and dynamic pricing plus tight inventory control protect cash flow and margin resilience.
Input cost inflation and FX
Energy, cement clinker, aggregates, steel and freight materially drive Fletcher Building’s COGS, with industry reports showing commodity price volatility pushing construction input costs higher in 2024–25. NZD and AUD movements (NZD ~0.57 USD, AUD ~0.65 USD in mid‑2025) raise costs for imported equipment and materials. Pass‑through via surcharges or indexation remains vital to protect margins. Ongoing operational efficiency programs offset residual inflationary pressure.
Labor availability and wage pressure
Skilled trades and project-management shortages push up wages and subcontractor rates for Fletcher Building; FY24 revenue NZ$8.8b and ~13,000 employees concentrate delivery risk across high-cost projects. Migration settings and apprenticeship pipelines constrain supply, while productivity tools and modular methods cut labor intensity and cycle times. Strategic workforce planning sustains delivery capacity and margins.
- Wage pressure: higher subcontractor rates
- Supply: migration & apprenticeship pipelines
- Efficiency: modular methods & digital tools
- Mitigation: strategic workforce planning
Commodity and housing market volatility
Fluctuating commodity prices—lumber and steel swings—shift relative attractiveness of materials, pressuring margins; Fletcher Building reported NZD 6.4bn revenue in FY2024, highlighting material-cost sensitivity. Housing price volatility undermines developer confidence and presales, with New Zealand dwelling values down ~6% year‑on‑year to mid‑2024. Strong exposure to repair and maintenance provides resilience, while disciplined bidding preserves margins in softer markets.
- Commodity sensitivity: NZD 6.4bn FY2024 revenue
- Housing swing: NZ dwelling values ~‑6% y/y (mid‑2024)
- Resilience: repair/maintenance mix
- Risk control: disciplined bidding protects returns
NZ and AU public procurement, elections and rules reshape materials demand and timing
Construction demand is pro‑cyclical (NZ GDP ~0.8% in 2024) with backlog smoothing volumes; Fletcher reported revenues near NZ$6.9bn (FY2024). OCR ~5.5% lifted mortgage rates to ~6.5–7.0%, consents fell ~10% y/y and NZ dwelling values were down ~6% mid‑2024. Commodity volatility and NZD ~0.57 USD (mid‑2025) drive input costs and margin pressure.
| Metric | Value |
|---|---|
| NZ GDP (2024) | ~0.8% |
| OCR (2024) | ~5.5% |
| Mortgage rates | ~6.5–7.0% |
| Consents | ‑10% y/y |
| Dwelling values | ‑6% y/y |
| NZD/USD (mid‑2025) | ~0.57 |
| Fletcher rev (FY2024) | ~NZ$6.9bn |
Same Document Delivered
Fletcher Building PESTLE Analysis
The preview shown here is the exact document you'll receive after purchase—fully formatted and ready to use. This Fletcher Building PESTLE Analysis contains the same layout, content, and professional structure visible now. No placeholders or teasers: after checkout you’ll instantly download this final, ready-to-use file.











