Flex Business Model Canvas

Business Model Canvas snapshot: value propositions, customer segments, revenue streams
Explore Flex’s strategic playbook with a concise Business Model Canvas overview that maps its value propositions, customer segments, and revenue streams. See how operational choices drive scale and margin in competitive markets. Purchase the full, editable Canvas for a complete nine-block analysis ready for strategy or investment use.
Partnerships

Tier-1 component and materials suppliers
Secure Tier-1 ties to semiconductor, battery, optics, metals and polymer suppliers underpin continuity and pricing leverage, with the global semiconductor market near $600B in 2024 supporting volume agreements. Multi-sourcing across regions cuts shortage exposure and geopolitical risk, historically lowering stockout incidence by ~30% in documented programs. Vendor-managed inventory and consignment reduce working capital needs, often trimming inventory on hand by 10–25%, while joint forecasting aligns capacity with customer ramps to avoid costly under- or over-capacity.
Technology and IP partners
Alliances with chipmakers, software platforms and automation providers accelerate design-in and certification, leveraging a global semiconductor market of about $600B in 2024 to secure supply and scale. Access to vendor reference designs shortens development cycles from years to months and increases first-pass validation. Licensing arrangements lower commercial and technical risk while enabling product differentiation, and co-innovation agreements protect IP and share downstream value.

Logistics and fulfillment providers
Global carriers, 3PLs, and customs brokers form the backbone of inbound/outbound flows; the global 3PL market was about $1.3 trillion in 2024, handling growing e-commerce and B2B volumes. Multi-node distribution can cut lead times ~20% and lower logistics spend ~15% through inventory proximity and route optimization. Trade compliance partners reduce customs delays and penalties—industry reports show up to 40% fewer clearance incidents. Real-time visibility tools boost ETA accuracy ~30% and speed exception resolution.

Equipment and tooling manufacturers
OEMs for SMT lines, robotics and test equipment drive throughput and yield improvements of 20–40% in modern flex lines; preventive maintenance partnerships can cut unplanned downtime by up to 50% and extend MTBF, while rapid tooling vendors accelerate NPI and localization, often shortening ramp time by 30–60%. Financing and buyback programs smooth capex cycles and improve ROIC, lowering effective equipment cost by 10–25%.
- SMT/robotics/test: +20–40% throughput
- Preventive maintenance: −up to 50% downtime
- Rapid tooling: −30–60% NPI time
- Financing/buyback: −10–25% effective capex
Regulatory, quality, and sustainability bodies
Collaboration with ISO (≈24,000 standards), FDA (typical 510(k) review ~120 days) and IATF auditors plus eco-standards groups ensures compliance and speeds market access; early engagement has reduced approval timelines by months for regulated products. ESG partners enable carbon accounting and circularity programs as >90% of large firms publish sustainability reports in 2024. Training alliances keep staff current on evolving requirements.
- ISO coverage: ≈24,000 standards
- FDA review: ~120 days (510(k))
- ESG reporting: >90% large firms (2024)
Tier-1 sourcing cuts stockouts ~30%, VMI saves 10-25% WC
Tier-1 supplier ties (semiconductors ~$600B, batteries, optics) and multi-sourcing cut stockout risk ~30% and lower working capital via VMI/consignment (−10–25%). Carrier/3PL partnerships (3PL market ~$1.3T) and real-time visibility improve ETA accuracy ~30% and cut logistics spend ~15%. Regulator/standards and OEM/tooling alliances speed market access (FDA 510(k) ~120 days; ISO ≈24,000).
| Partner | Metric | Impact |
|---|---|---|
| Semiconductors | $600B (2024) | Supply scale |
| 3PL | $1.3T (2024) | −15% logistics |
| Standards | ISO ≈24,000 | Faster approvals |
What is included in the product
 Detailed Word Document
A comprehensive, pre-written Flex Business Model Canvas tailored to a company’s strategy, covering 9 classic BMC blocks with full narratives, channels, value propositions and competitive advantages, plus linked SWOT and real-data validation—ideal for presentations, funding discussions, and informed decision-making.

 Customizable Excel Spreadsheet
Flex Business Model Canvas accelerates strategic clarity by mapping core components on an editable one-page layout, eliminating hours spent formatting and aligning teams for faster decisions.
Activities

Design, engineering, and DFM/DFX
Translate customer concepts into manufacturable electronics, mechanicals, and software, targeting first-pass manufacturability rates above 85%. Apply DFM/DFX to reduce cost, risk, and time, achieving 10–30% lower unit costs and 20–40% fewer re-spins. Run simulations and validation to meet regulatory standards, cutting physical testing by up to 50%. Manage BOM optimization and obsolescence to reduce material cost 5–15% and lower redesign events ~15%.
NPI, prototyping, and pilot builds
Run rapid EVT/DVT/PVT cycles with iterative prototypes and controlled pilot builds (typically 100–500 units) to validate designs and establish golden samples and process windows. In 2024 supplier qualification and materials onboarding averaged about 12–16 weeks, so quantify suppliers early. Use pilot lines to de-risk ramps and target PVT yields before full-scale investment.

High-mix, high-volume manufacturing
Operate SMT, box-build, molding and final assembly with strict QC achieving >95% first-pass yield and lot-level traceability; automation and inline test systems enable ~99% serial traceability and ~25% faster test cycles. Flex capacity across sites balances demand, reducing backlog variance by ~30%. Enforce lean practices to improve OEE by 10–20% and lower unit cost.

Supply chain orchestration and planning
Forecast, procure, and allocate constrained components globally while coordinating logistics, customs, and inventory positioning to sustain >95% fill rates; run S&OP and CPFR with customers and suppliers to align demand and supply. Use analytics—in 2024 firms reported ~20% forecast accuracy gains from ML—to manage risk, cost, and service levels across multi-tier networks.
- forecast
- procure & allocate
- logistics & customs
- S&OP & CPFR
- analytics & risk
After-sales services and lifecycle management
- repair, refurb, returns
- spares management, failure analytics
- rework, upgrades, EOL transitions
- reuse, recycling, circular economy
DFM/DFX cuts cost 10–30%, re-spins 20–40%, 95%+ yield
Translate designs to manufacturable products with DFM/DFX (10–30% unit cost cut, 20–40% fewer re-spins), run EVT/DVT/PVT pilot builds (100–500 units) to de-risk ramps, operate multi-site SMT/assembly (>95% first-pass yield) and manage supply, S&OP and aftermarket services (aftermarket up to 60% lifecycle profit).
| Activity | KPI | 2024 Benchmark |
|---|---|---|
| DFM/DFX | Cost reduction / Re-spins | 10–30% / 20–40% |
| Supplier onboarding | Lead time | 12–16 weeks |
| Forecasting | Accuracy gain | ~20% |
| After-sales | Lifecycle profit | Up to 60% |
What You See Is What You Get
Business Model Canvas
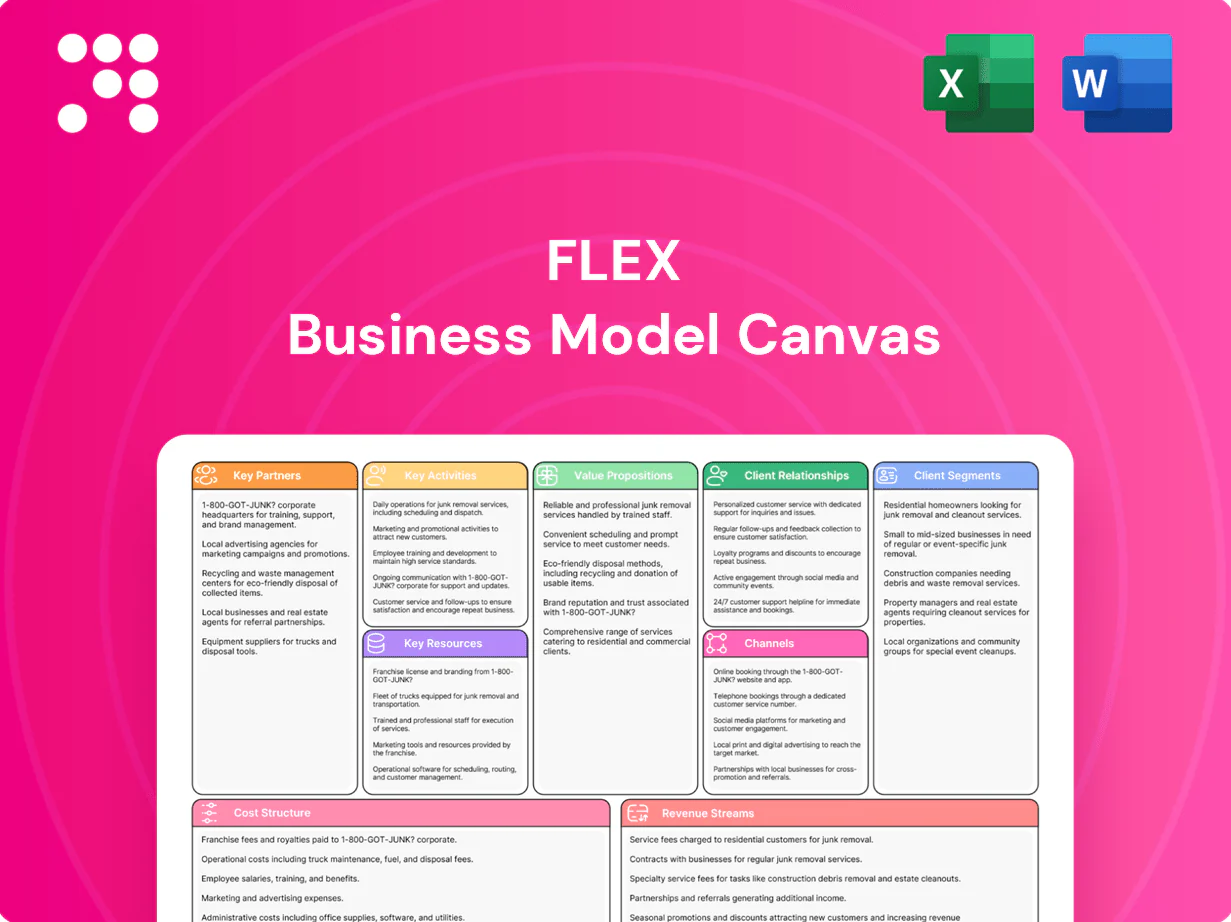
The Flex Business Model Canvas shown here is the exact deliverable you’ll receive—it’s not a mockup or sample. When you purchase, you’ll download this same, fully editable document formatted for immediate use. No hidden pages, no altered layouts; what you see is what you get.

Business Model Canvas snapshot: value propositions, customer segments, revenue streams
Explore Flex’s strategic playbook with a concise Business Model Canvas overview that maps its value propositions, customer segments, and revenue streams. See how operational choices drive scale and margin in competitive markets. Purchase the full, editable Canvas for a complete nine-block analysis ready for strategy or investment use.
Partnerships
Tier-1 component and materials suppliers
Secure Tier-1 ties to semiconductor, battery, optics, metals and polymer suppliers underpin continuity and pricing leverage, with the global semiconductor market near $600B in 2024 supporting volume agreements. Multi-sourcing across regions cuts shortage exposure and geopolitical risk, historically lowering stockout incidence by ~30% in documented programs. Vendor-managed inventory and consignment reduce working capital needs, often trimming inventory on hand by 10–25%, while joint forecasting aligns capacity with customer ramps to avoid costly under- or over-capacity.
Technology and IP partners
Alliances with chipmakers, software platforms and automation providers accelerate design-in and certification, leveraging a global semiconductor market of about $600B in 2024 to secure supply and scale. Access to vendor reference designs shortens development cycles from years to months and increases first-pass validation. Licensing arrangements lower commercial and technical risk while enabling product differentiation, and co-innovation agreements protect IP and share downstream value.
Logistics and fulfillment providers
Global carriers, 3PLs, and customs brokers form the backbone of inbound/outbound flows; the global 3PL market was about $1.3 trillion in 2024, handling growing e-commerce and B2B volumes. Multi-node distribution can cut lead times ~20% and lower logistics spend ~15% through inventory proximity and route optimization. Trade compliance partners reduce customs delays and penalties—industry reports show up to 40% fewer clearance incidents. Real-time visibility tools boost ETA accuracy ~30% and speed exception resolution.
Equipment and tooling manufacturers
OEMs for SMT lines, robotics and test equipment drive throughput and yield improvements of 20–40% in modern flex lines; preventive maintenance partnerships can cut unplanned downtime by up to 50% and extend MTBF, while rapid tooling vendors accelerate NPI and localization, often shortening ramp time by 30–60%. Financing and buyback programs smooth capex cycles and improve ROIC, lowering effective equipment cost by 10–25%.
- SMT/robotics/test: +20–40% throughput
- Preventive maintenance: −up to 50% downtime
- Rapid tooling: −30–60% NPI time
- Financing/buyback: −10–25% effective capex
Regulatory, quality, and sustainability bodies
Collaboration with ISO (≈24,000 standards), FDA (typical 510(k) review ~120 days) and IATF auditors plus eco-standards groups ensures compliance and speeds market access; early engagement has reduced approval timelines by months for regulated products. ESG partners enable carbon accounting and circularity programs as >90% of large firms publish sustainability reports in 2024. Training alliances keep staff current on evolving requirements.
- ISO coverage: ≈24,000 standards
- FDA review: ~120 days (510(k))
- ESG reporting: >90% large firms (2024)
Tier-1 sourcing cuts stockouts ~30%, VMI saves 10-25% WC
Tier-1 supplier ties (semiconductors ~$600B, batteries, optics) and multi-sourcing cut stockout risk ~30% and lower working capital via VMI/consignment (−10–25%). Carrier/3PL partnerships (3PL market ~$1.3T) and real-time visibility improve ETA accuracy ~30% and cut logistics spend ~15%. Regulator/standards and OEM/tooling alliances speed market access (FDA 510(k) ~120 days; ISO ≈24,000).
| Partner | Metric | Impact |
|---|---|---|
| Semiconductors | $600B (2024) | Supply scale |
| 3PL | $1.3T (2024) | −15% logistics |
| Standards | ISO ≈24,000 | Faster approvals |
What is included in the product
Detailed Word Document
A comprehensive, pre-written Flex Business Model Canvas tailored to a company’s strategy, covering 9 classic BMC blocks with full narratives, channels, value propositions and competitive advantages, plus linked SWOT and real-data validation—ideal for presentations, funding discussions, and informed decision-making.
Customizable Excel Spreadsheet
Flex Business Model Canvas accelerates strategic clarity by mapping core components on an editable one-page layout, eliminating hours spent formatting and aligning teams for faster decisions.
Activities
Design, engineering, and DFM/DFX
Translate customer concepts into manufacturable electronics, mechanicals, and software, targeting first-pass manufacturability rates above 85%. Apply DFM/DFX to reduce cost, risk, and time, achieving 10–30% lower unit costs and 20–40% fewer re-spins. Run simulations and validation to meet regulatory standards, cutting physical testing by up to 50%. Manage BOM optimization and obsolescence to reduce material cost 5–15% and lower redesign events ~15%.
NPI, prototyping, and pilot builds
Run rapid EVT/DVT/PVT cycles with iterative prototypes and controlled pilot builds (typically 100–500 units) to validate designs and establish golden samples and process windows. In 2024 supplier qualification and materials onboarding averaged about 12–16 weeks, so quantify suppliers early. Use pilot lines to de-risk ramps and target PVT yields before full-scale investment.
High-mix, high-volume manufacturing
Operate SMT, box-build, molding and final assembly with strict QC achieving >95% first-pass yield and lot-level traceability; automation and inline test systems enable ~99% serial traceability and ~25% faster test cycles. Flex capacity across sites balances demand, reducing backlog variance by ~30%. Enforce lean practices to improve OEE by 10–20% and lower unit cost.
Supply chain orchestration and planning
Forecast, procure, and allocate constrained components globally while coordinating logistics, customs, and inventory positioning to sustain >95% fill rates; run S&OP and CPFR with customers and suppliers to align demand and supply. Use analytics—in 2024 firms reported ~20% forecast accuracy gains from ML—to manage risk, cost, and service levels across multi-tier networks.
- forecast
- procure & allocate
- logistics & customs
- S&OP & CPFR
- analytics & risk
After-sales services and lifecycle management
- repair, refurb, returns
- spares management, failure analytics
- rework, upgrades, EOL transitions
- reuse, recycling, circular economy
DFM/DFX cuts cost 10–30%, re-spins 20–40%, 95%+ yield
Translate designs to manufacturable products with DFM/DFX (10–30% unit cost cut, 20–40% fewer re-spins), run EVT/DVT/PVT pilot builds (100–500 units) to de-risk ramps, operate multi-site SMT/assembly (>95% first-pass yield) and manage supply, S&OP and aftermarket services (aftermarket up to 60% lifecycle profit).
| Activity | KPI | 2024 Benchmark |
|---|---|---|
| DFM/DFX | Cost reduction / Re-spins | 10–30% / 20–40% |
| Supplier onboarding | Lead time | 12–16 weeks |
| Forecasting | Accuracy gain | ~20% |
| After-sales | Lifecycle profit | Up to 60% |
What You See Is What You Get
Business Model Canvas
The Flex Business Model Canvas shown here is the exact deliverable you’ll receive—it’s not a mockup or sample. When you purchase, you’ll download this same, fully editable document formatted for immediate use. No hidden pages, no altered layouts; what you see is what you get.
Original: $10.00
-65%$10.00
$3.50Description
Business Model Canvas snapshot: value propositions, customer segments, revenue streams
Explore Flex’s strategic playbook with a concise Business Model Canvas overview that maps its value propositions, customer segments, and revenue streams. See how operational choices drive scale and margin in competitive markets. Purchase the full, editable Canvas for a complete nine-block analysis ready for strategy or investment use.
Partnerships
Tier-1 component and materials suppliers
Secure Tier-1 ties to semiconductor, battery, optics, metals and polymer suppliers underpin continuity and pricing leverage, with the global semiconductor market near $600B in 2024 supporting volume agreements. Multi-sourcing across regions cuts shortage exposure and geopolitical risk, historically lowering stockout incidence by ~30% in documented programs. Vendor-managed inventory and consignment reduce working capital needs, often trimming inventory on hand by 10–25%, while joint forecasting aligns capacity with customer ramps to avoid costly under- or over-capacity.
Technology and IP partners
Alliances with chipmakers, software platforms and automation providers accelerate design-in and certification, leveraging a global semiconductor market of about $600B in 2024 to secure supply and scale. Access to vendor reference designs shortens development cycles from years to months and increases first-pass validation. Licensing arrangements lower commercial and technical risk while enabling product differentiation, and co-innovation agreements protect IP and share downstream value.
Logistics and fulfillment providers
Global carriers, 3PLs, and customs brokers form the backbone of inbound/outbound flows; the global 3PL market was about $1.3 trillion in 2024, handling growing e-commerce and B2B volumes. Multi-node distribution can cut lead times ~20% and lower logistics spend ~15% through inventory proximity and route optimization. Trade compliance partners reduce customs delays and penalties—industry reports show up to 40% fewer clearance incidents. Real-time visibility tools boost ETA accuracy ~30% and speed exception resolution.
Equipment and tooling manufacturers
OEMs for SMT lines, robotics and test equipment drive throughput and yield improvements of 20–40% in modern flex lines; preventive maintenance partnerships can cut unplanned downtime by up to 50% and extend MTBF, while rapid tooling vendors accelerate NPI and localization, often shortening ramp time by 30–60%. Financing and buyback programs smooth capex cycles and improve ROIC, lowering effective equipment cost by 10–25%.
- SMT/robotics/test: +20–40% throughput
- Preventive maintenance: −up to 50% downtime
- Rapid tooling: −30–60% NPI time
- Financing/buyback: −10–25% effective capex
Regulatory, quality, and sustainability bodies
Collaboration with ISO (≈24,000 standards), FDA (typical 510(k) review ~120 days) and IATF auditors plus eco-standards groups ensures compliance and speeds market access; early engagement has reduced approval timelines by months for regulated products. ESG partners enable carbon accounting and circularity programs as >90% of large firms publish sustainability reports in 2024. Training alliances keep staff current on evolving requirements.
- ISO coverage: ≈24,000 standards
- FDA review: ~120 days (510(k))
- ESG reporting: >90% large firms (2024)
Tier-1 sourcing cuts stockouts ~30%, VMI saves 10-25% WC
Tier-1 supplier ties (semiconductors ~$600B, batteries, optics) and multi-sourcing cut stockout risk ~30% and lower working capital via VMI/consignment (−10–25%). Carrier/3PL partnerships (3PL market ~$1.3T) and real-time visibility improve ETA accuracy ~30% and cut logistics spend ~15%. Regulator/standards and OEM/tooling alliances speed market access (FDA 510(k) ~120 days; ISO ≈24,000).
| Partner | Metric | Impact |
|---|---|---|
| Semiconductors | $600B (2024) | Supply scale |
| 3PL | $1.3T (2024) | −15% logistics |
| Standards | ISO ≈24,000 | Faster approvals |
What is included in the product
Detailed Word Document
A comprehensive, pre-written Flex Business Model Canvas tailored to a company’s strategy, covering 9 classic BMC blocks with full narratives, channels, value propositions and competitive advantages, plus linked SWOT and real-data validation—ideal for presentations, funding discussions, and informed decision-making.
Customizable Excel Spreadsheet
Flex Business Model Canvas accelerates strategic clarity by mapping core components on an editable one-page layout, eliminating hours spent formatting and aligning teams for faster decisions.
Activities
Design, engineering, and DFM/DFX
Translate customer concepts into manufacturable electronics, mechanicals, and software, targeting first-pass manufacturability rates above 85%. Apply DFM/DFX to reduce cost, risk, and time, achieving 10–30% lower unit costs and 20–40% fewer re-spins. Run simulations and validation to meet regulatory standards, cutting physical testing by up to 50%. Manage BOM optimization and obsolescence to reduce material cost 5–15% and lower redesign events ~15%.
NPI, prototyping, and pilot builds
Run rapid EVT/DVT/PVT cycles with iterative prototypes and controlled pilot builds (typically 100–500 units) to validate designs and establish golden samples and process windows. In 2024 supplier qualification and materials onboarding averaged about 12–16 weeks, so quantify suppliers early. Use pilot lines to de-risk ramps and target PVT yields before full-scale investment.
High-mix, high-volume manufacturing
Operate SMT, box-build, molding and final assembly with strict QC achieving >95% first-pass yield and lot-level traceability; automation and inline test systems enable ~99% serial traceability and ~25% faster test cycles. Flex capacity across sites balances demand, reducing backlog variance by ~30%. Enforce lean practices to improve OEE by 10–20% and lower unit cost.
Supply chain orchestration and planning
Forecast, procure, and allocate constrained components globally while coordinating logistics, customs, and inventory positioning to sustain >95% fill rates; run S&OP and CPFR with customers and suppliers to align demand and supply. Use analytics—in 2024 firms reported ~20% forecast accuracy gains from ML—to manage risk, cost, and service levels across multi-tier networks.
- forecast
- procure & allocate
- logistics & customs
- S&OP & CPFR
- analytics & risk
After-sales services and lifecycle management
- repair, refurb, returns
- spares management, failure analytics
- rework, upgrades, EOL transitions
- reuse, recycling, circular economy
DFM/DFX cuts cost 10–30%, re-spins 20–40%, 95%+ yield
Translate designs to manufacturable products with DFM/DFX (10–30% unit cost cut, 20–40% fewer re-spins), run EVT/DVT/PVT pilot builds (100–500 units) to de-risk ramps, operate multi-site SMT/assembly (>95% first-pass yield) and manage supply, S&OP and aftermarket services (aftermarket up to 60% lifecycle profit).
| Activity | KPI | 2024 Benchmark |
|---|---|---|
| DFM/DFX | Cost reduction / Re-spins | 10–30% / 20–40% |
| Supplier onboarding | Lead time | 12–16 weeks |
| Forecasting | Accuracy gain | ~20% |
| After-sales | Lifecycle profit | Up to 60% |
What You See Is What You Get
Business Model Canvas
The Flex Business Model Canvas shown here is the exact deliverable you’ll receive—it’s not a mockup or sample. When you purchase, you’ll download this same, fully editable document formatted for immediate use. No hidden pages, no altered layouts; what you see is what you get.











