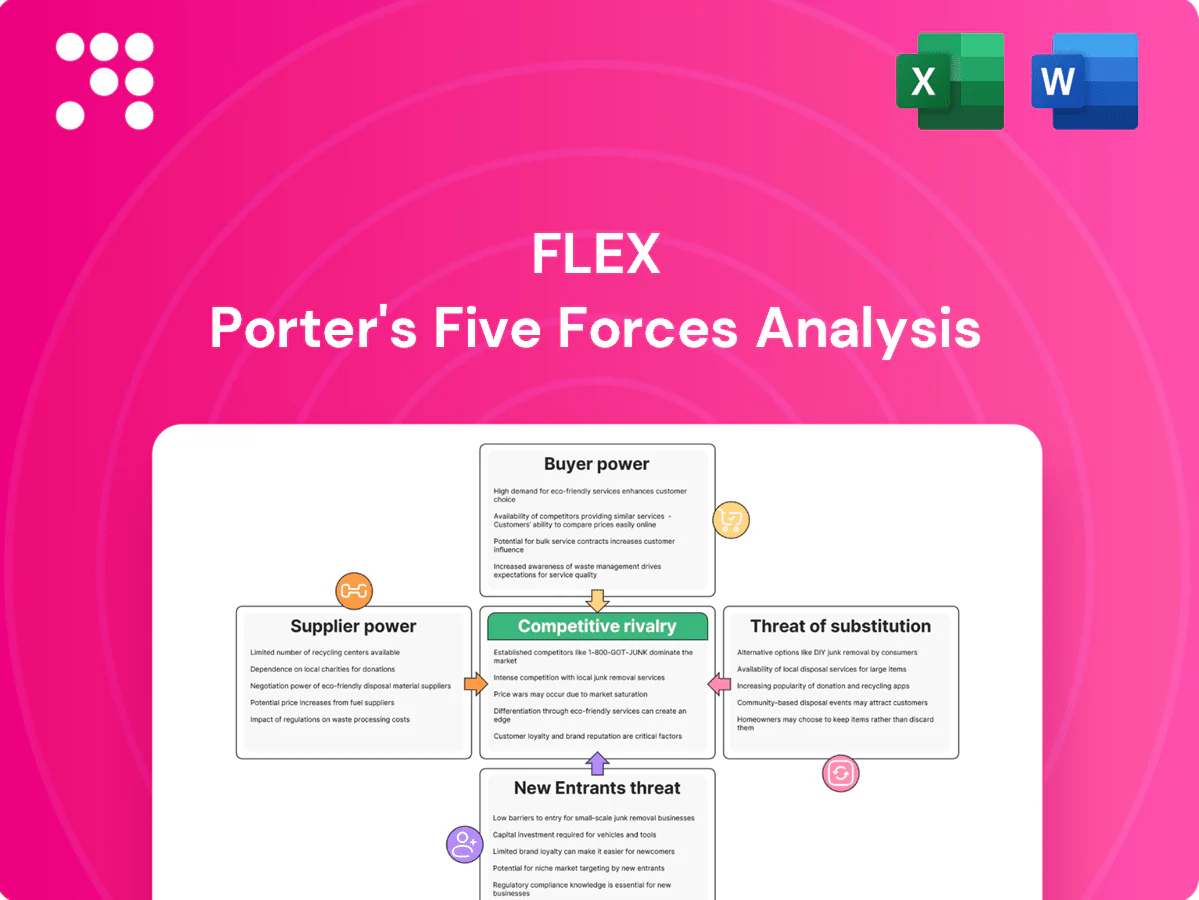
Flex Porter's Five Forces Analysis

From Overview to Strategy Blueprint
Flex’s Porter’s Five Forces snapshot highlights competitive rivalry, supplier and buyer power, threat of entrants and substitutes, and strategic pressure points shaping margins and growth. The full report reveals force-by-force ratings, data-driven implications, and visuals to quantify threats and opportunities. Ready to move beyond the basics? Unlock the complete analysis to inform investment and strategy decisions.
Suppliers Bargaining Power

Concentrated chip vendors
Semiconductor supply is concentrated, with TSMC accounting for roughly 54% of pure‑play foundry revenue in 2023–24, giving major foundries and IDMs outsized leverage to tighten terms and allocations. This raises supplier pricing and lead‑time power in upcycles. Flex counters with improved demand forecasting, vendor‑managed inventory and strategic supply agreements. Allocation risk, however, can still disrupt schedules and compress margins.
Specialized materials inputs
High-spec inputs (PCBs, batteries, sensors, optics) are concentrated: 2024 estimates show China/Taiwan account for ~75–80% of advanced battery and PCB capacity, qualification cycles of 6–12 months and rigorous certifications raise switching costs, suppliers with proprietary IP command price premiums, and dual-sourcing remains pursued but often infeasible for many high-spec parts.

Regional and geopolitical risk
Suppliers clustered in Asia (about 60–70% of global electronics manufacturing capacity in 2024) expose Flex to tariffs, export controls and chokepoint logistics, amplifying supplier leverage. Geopolitical shocks shift bargaining power to suppliers with capacity in safe jurisdictions, while Flex mitigates risk via regionalization and multi-node sourcing. Nearshoring, however, raised cost baselines by double-digit percentage points for many segments in 2024, strengthening supplier price discipline.

Automation and equipment reliance
SMT lines, testing gear and factory software are concentrated among 2024 leaders ASMPT, Fuji, Panasonic, Mycronic, Teradyne and Advantest, creating supplier concentration and tooling lock-in that raises switching frictions. Integration complexity plus service contracts and spare parts deepen supplier leverage, while Flex offsets this by negotiating fleet-wide deals to dilute per-unit supplier power.
- Concentrated vendor set: ASMPT/Fuji/Panasonic/Mycronic/Teradyne/Advantest
- Lock-in: tooling + software integration raises switching costs
- Embedding: service contracts & spare parts increase dependence
- Mitigation: fleet-wide Flex deals reduce supplier leverage
Sustainability and compliance
RoHS restricts 10 substance groups, and combined REACH, PFAS scrutiny and mandatory ESG audits shrink the pool of compliant suppliers, concentrating bargaining power and allowing compliance premiums to flow to EMS providers.
Flex’s stringent sustainability rules can further limit sourcing, though preferred supplier programs help standardize expectations and reduce cost variability.
- RoHS: 10 restricted substance groups
- REACH/PFAS: tighter lists increase supplier filtering
- ESG audits: raise compliance premiums
- Preferred supplier programs: standardize costs
Concentrated fabs and tooling leaders drive supplier power; mitigated by multi-node sourcing
Supplier power is high: TSMC held ~54% pure‑play foundry revenue (2023–24), Asia held ~60–70% electronics capacity (2024) and China/Taiwan ~75–80% advanced battery/PCB capacity (2024), concentrating leverage. Tooling leaders (ASMPT, Fuji, Panasonic, Mycronic, Teradyne, Advantest) create lock‑in; compliance (RoHS/REACH/PFAS) raises premiums. Flex mitigates via multi‑node sourcing, fleet deals and preferred suppliers.
| Metric | 2024 | Impact |
|---|---|---|
| Foundry share (TSMC) | ~54% | Allocation/pricing power |
| Asia electronics capacity | 60–70% | Geopolitical risk |
| Battery/PCB capacity (CN/TW) | 75–80% | Switching costs |
What is included in the product
 Detailed Word Document
Comprehensive Porter's Five Forces analysis tailored to Flex, uncovering competitive intensity, supplier and buyer power, threat of substitutes and new entrants, and potential disruptors. Includes data-driven commentary on pricing and profitability pressures, strategic implications for market positioning, and a fully editable Word format for easy customization and reporting.

 Customizable Excel Spreadsheet
A single, customizable Five Forces worksheet that turns messy market research into instant strategic clarity—adjust pressures, swap data, and produce radar visuals for decks in seconds. No macros, easy to copy into reports, and ideal for testing scenarios like new entrants or regulation changes.
Customers Bargaining Power

Large OEM concentration
Customers are global OEMs with scale and procurement sophistication, running competitive bids and enforcing price-down roadmaps that compress margins; their volume grants them strong bargaining power over rates and contract terms. Flex mitigates this by offering value-added engineering, integrated supply-chain solutions and lifecycle support to preserve pricing and stickiness.
Dual-sourcing norms
Many OEMs qualify multiple EMS partners per program, enabling price benchmarking and rapid reallocation of volumes; buyer leverage increases when designs are well-documented and transferable. Dual-sourcing norms intensify competition for margins, while Flex’s scale (FY2024 revenue about $24.7 billion) lets it invest in co-development and NPI excellence. These capabilities create stickiness that mitigates pure price-based switching.

Switching costs vary
In regulated verticals (medical, automotive) requalification timelines typically span 6–24 months and can cost hundreds of thousands to several million dollars, tempering buyer power. Consumer electronics and accessory programs shift in weeks–months, increasing buyer leverage. Where Flex embeds test IP and process know-how, switching becomes materially harder. Early design engagement raises exit frictions further.

Design and JDM influence
When Flex provides design, DFX, or JDM/ODM services it shapes specifications and BOMs, shifting buyer focus from pure unit price to total cost of ownership and speed-to-market; Flex reported fiscal 2024 revenue of about $26.1 billion, reflecting growing value-added services demand. Buyers still demand transparency and recurrent cost-downs, but deeper engineering content lets Flex capture higher margin and longer-duration contracts.
- Design influence: shifts negotiation to TCO and speed
- Buyer pressure: ongoing transparency and cost-downs
- Value capture: increases with engineering depth and program ownership
Service-level and SLAs
Buyers force strict KPIs on yield, on-time delivery and quality with penalty clauses commonly reaching up to 10% of contract value; performance-linked fees are widespread in 2024 and drive continuous pricing pressure. Strong SLA performance, however, secures preferred-supplier status and can deliver double-digit share gains for Flex. Flex leverages over 100 manufacturing sites across 30 countries to justify premium pricing through resiliency and nearshoring advantages.
- Penalty levels: up to 10% of contract value
- Performance fees: widespread in 2024 contracts
- Preferred status: double-digit share uplift
- Footprint: 100+ sites in 30 countries
OEM price pressure offset by engineering, scale and supply-chain integration to protect margins
Customers (global OEMs) exert strong price and contract leverage via competitive bids and multi-sourcing, compressing margins. Flex offsets this through engineering, supply-chain integration and scale, preserving stickiness and TCO focus. Regulated verticals raise switching costs (6–24 months requalification), while consumer programs remain highly contestable.
| Metric | 2024 |
|---|---|
| Revenue | $24.7B |
| Sites | 100+ |
| Penalty clauses | up to 10% |
| Requalification | 6–24 months |
Same Document Delivered
Flex Porter's Five Forces Analysis
This preview shows the exact Flex Porter's Five Forces Analysis you'll receive immediately after purchase—no surprises or placeholders. The document is fully formatted, professionally written, and ready for download and use the moment you buy. You’re viewing the final deliverable and will get instant access to this same file upon payment.

From Overview to Strategy Blueprint
Flex’s Porter’s Five Forces snapshot highlights competitive rivalry, supplier and buyer power, threat of entrants and substitutes, and strategic pressure points shaping margins and growth. The full report reveals force-by-force ratings, data-driven implications, and visuals to quantify threats and opportunities. Ready to move beyond the basics? Unlock the complete analysis to inform investment and strategy decisions.
Suppliers Bargaining Power
Concentrated chip vendors
Semiconductor supply is concentrated, with TSMC accounting for roughly 54% of pure‑play foundry revenue in 2023–24, giving major foundries and IDMs outsized leverage to tighten terms and allocations. This raises supplier pricing and lead‑time power in upcycles. Flex counters with improved demand forecasting, vendor‑managed inventory and strategic supply agreements. Allocation risk, however, can still disrupt schedules and compress margins.
Specialized materials inputs
High-spec inputs (PCBs, batteries, sensors, optics) are concentrated: 2024 estimates show China/Taiwan account for ~75–80% of advanced battery and PCB capacity, qualification cycles of 6–12 months and rigorous certifications raise switching costs, suppliers with proprietary IP command price premiums, and dual-sourcing remains pursued but often infeasible for many high-spec parts.
Regional and geopolitical risk
Suppliers clustered in Asia (about 60–70% of global electronics manufacturing capacity in 2024) expose Flex to tariffs, export controls and chokepoint logistics, amplifying supplier leverage. Geopolitical shocks shift bargaining power to suppliers with capacity in safe jurisdictions, while Flex mitigates risk via regionalization and multi-node sourcing. Nearshoring, however, raised cost baselines by double-digit percentage points for many segments in 2024, strengthening supplier price discipline.
Automation and equipment reliance
SMT lines, testing gear and factory software are concentrated among 2024 leaders ASMPT, Fuji, Panasonic, Mycronic, Teradyne and Advantest, creating supplier concentration and tooling lock-in that raises switching frictions. Integration complexity plus service contracts and spare parts deepen supplier leverage, while Flex offsets this by negotiating fleet-wide deals to dilute per-unit supplier power.
- Concentrated vendor set: ASMPT/Fuji/Panasonic/Mycronic/Teradyne/Advantest
- Lock-in: tooling + software integration raises switching costs
- Embedding: service contracts & spare parts increase dependence
- Mitigation: fleet-wide Flex deals reduce supplier leverage
Sustainability and compliance
RoHS restricts 10 substance groups, and combined REACH, PFAS scrutiny and mandatory ESG audits shrink the pool of compliant suppliers, concentrating bargaining power and allowing compliance premiums to flow to EMS providers.
Flex’s stringent sustainability rules can further limit sourcing, though preferred supplier programs help standardize expectations and reduce cost variability.
- RoHS: 10 restricted substance groups
- REACH/PFAS: tighter lists increase supplier filtering
- ESG audits: raise compliance premiums
- Preferred supplier programs: standardize costs
Concentrated fabs and tooling leaders drive supplier power; mitigated by multi-node sourcing
Supplier power is high: TSMC held ~54% pure‑play foundry revenue (2023–24), Asia held ~60–70% electronics capacity (2024) and China/Taiwan ~75–80% advanced battery/PCB capacity (2024), concentrating leverage. Tooling leaders (ASMPT, Fuji, Panasonic, Mycronic, Teradyne, Advantest) create lock‑in; compliance (RoHS/REACH/PFAS) raises premiums. Flex mitigates via multi‑node sourcing, fleet deals and preferred suppliers.
| Metric | 2024 | Impact |
|---|---|---|
| Foundry share (TSMC) | ~54% | Allocation/pricing power |
| Asia electronics capacity | 60–70% | Geopolitical risk |
| Battery/PCB capacity (CN/TW) | 75–80% | Switching costs |
What is included in the product
Detailed Word Document
Comprehensive Porter's Five Forces analysis tailored to Flex, uncovering competitive intensity, supplier and buyer power, threat of substitutes and new entrants, and potential disruptors. Includes data-driven commentary on pricing and profitability pressures, strategic implications for market positioning, and a fully editable Word format for easy customization and reporting.
Customizable Excel Spreadsheet
A single, customizable Five Forces worksheet that turns messy market research into instant strategic clarity—adjust pressures, swap data, and produce radar visuals for decks in seconds. No macros, easy to copy into reports, and ideal for testing scenarios like new entrants or regulation changes.
Customers Bargaining Power
Large OEM concentration
Customers are global OEMs with scale and procurement sophistication, running competitive bids and enforcing price-down roadmaps that compress margins; their volume grants them strong bargaining power over rates and contract terms. Flex mitigates this by offering value-added engineering, integrated supply-chain solutions and lifecycle support to preserve pricing and stickiness.
Dual-sourcing norms
Many OEMs qualify multiple EMS partners per program, enabling price benchmarking and rapid reallocation of volumes; buyer leverage increases when designs are well-documented and transferable. Dual-sourcing norms intensify competition for margins, while Flex’s scale (FY2024 revenue about $24.7 billion) lets it invest in co-development and NPI excellence. These capabilities create stickiness that mitigates pure price-based switching.
Switching costs vary
In regulated verticals (medical, automotive) requalification timelines typically span 6–24 months and can cost hundreds of thousands to several million dollars, tempering buyer power. Consumer electronics and accessory programs shift in weeks–months, increasing buyer leverage. Where Flex embeds test IP and process know-how, switching becomes materially harder. Early design engagement raises exit frictions further.
Design and JDM influence
When Flex provides design, DFX, or JDM/ODM services it shapes specifications and BOMs, shifting buyer focus from pure unit price to total cost of ownership and speed-to-market; Flex reported fiscal 2024 revenue of about $26.1 billion, reflecting growing value-added services demand. Buyers still demand transparency and recurrent cost-downs, but deeper engineering content lets Flex capture higher margin and longer-duration contracts.
- Design influence: shifts negotiation to TCO and speed
- Buyer pressure: ongoing transparency and cost-downs
- Value capture: increases with engineering depth and program ownership
Service-level and SLAs
Buyers force strict KPIs on yield, on-time delivery and quality with penalty clauses commonly reaching up to 10% of contract value; performance-linked fees are widespread in 2024 and drive continuous pricing pressure. Strong SLA performance, however, secures preferred-supplier status and can deliver double-digit share gains for Flex. Flex leverages over 100 manufacturing sites across 30 countries to justify premium pricing through resiliency and nearshoring advantages.
- Penalty levels: up to 10% of contract value
- Performance fees: widespread in 2024 contracts
- Preferred status: double-digit share uplift
- Footprint: 100+ sites in 30 countries
OEM price pressure offset by engineering, scale and supply-chain integration to protect margins
Customers (global OEMs) exert strong price and contract leverage via competitive bids and multi-sourcing, compressing margins. Flex offsets this through engineering, supply-chain integration and scale, preserving stickiness and TCO focus. Regulated verticals raise switching costs (6–24 months requalification), while consumer programs remain highly contestable.
| Metric | 2024 |
|---|---|
| Revenue | $24.7B |
| Sites | 100+ |
| Penalty clauses | up to 10% |
| Requalification | 6–24 months |
Same Document Delivered
Flex Porter's Five Forces Analysis
This preview shows the exact Flex Porter's Five Forces Analysis you'll receive immediately after purchase—no surprises or placeholders. The document is fully formatted, professionally written, and ready for download and use the moment you buy. You’re viewing the final deliverable and will get instant access to this same file upon payment.
Description
From Overview to Strategy Blueprint
Flex’s Porter’s Five Forces snapshot highlights competitive rivalry, supplier and buyer power, threat of entrants and substitutes, and strategic pressure points shaping margins and growth. The full report reveals force-by-force ratings, data-driven implications, and visuals to quantify threats and opportunities. Ready to move beyond the basics? Unlock the complete analysis to inform investment and strategy decisions.
Suppliers Bargaining Power
Concentrated chip vendors
Semiconductor supply is concentrated, with TSMC accounting for roughly 54% of pure‑play foundry revenue in 2023–24, giving major foundries and IDMs outsized leverage to tighten terms and allocations. This raises supplier pricing and lead‑time power in upcycles. Flex counters with improved demand forecasting, vendor‑managed inventory and strategic supply agreements. Allocation risk, however, can still disrupt schedules and compress margins.
Specialized materials inputs
High-spec inputs (PCBs, batteries, sensors, optics) are concentrated: 2024 estimates show China/Taiwan account for ~75–80% of advanced battery and PCB capacity, qualification cycles of 6–12 months and rigorous certifications raise switching costs, suppliers with proprietary IP command price premiums, and dual-sourcing remains pursued but often infeasible for many high-spec parts.
Regional and geopolitical risk
Suppliers clustered in Asia (about 60–70% of global electronics manufacturing capacity in 2024) expose Flex to tariffs, export controls and chokepoint logistics, amplifying supplier leverage. Geopolitical shocks shift bargaining power to suppliers with capacity in safe jurisdictions, while Flex mitigates risk via regionalization and multi-node sourcing. Nearshoring, however, raised cost baselines by double-digit percentage points for many segments in 2024, strengthening supplier price discipline.
Automation and equipment reliance
SMT lines, testing gear and factory software are concentrated among 2024 leaders ASMPT, Fuji, Panasonic, Mycronic, Teradyne and Advantest, creating supplier concentration and tooling lock-in that raises switching frictions. Integration complexity plus service contracts and spare parts deepen supplier leverage, while Flex offsets this by negotiating fleet-wide deals to dilute per-unit supplier power.
- Concentrated vendor set: ASMPT/Fuji/Panasonic/Mycronic/Teradyne/Advantest
- Lock-in: tooling + software integration raises switching costs
- Embedding: service contracts & spare parts increase dependence
- Mitigation: fleet-wide Flex deals reduce supplier leverage
Sustainability and compliance
RoHS restricts 10 substance groups, and combined REACH, PFAS scrutiny and mandatory ESG audits shrink the pool of compliant suppliers, concentrating bargaining power and allowing compliance premiums to flow to EMS providers.
Flex’s stringent sustainability rules can further limit sourcing, though preferred supplier programs help standardize expectations and reduce cost variability.
- RoHS: 10 restricted substance groups
- REACH/PFAS: tighter lists increase supplier filtering
- ESG audits: raise compliance premiums
- Preferred supplier programs: standardize costs
Concentrated fabs and tooling leaders drive supplier power; mitigated by multi-node sourcing
Supplier power is high: TSMC held ~54% pure‑play foundry revenue (2023–24), Asia held ~60–70% electronics capacity (2024) and China/Taiwan ~75–80% advanced battery/PCB capacity (2024), concentrating leverage. Tooling leaders (ASMPT, Fuji, Panasonic, Mycronic, Teradyne, Advantest) create lock‑in; compliance (RoHS/REACH/PFAS) raises premiums. Flex mitigates via multi‑node sourcing, fleet deals and preferred suppliers.
| Metric | 2024 | Impact |
|---|---|---|
| Foundry share (TSMC) | ~54% | Allocation/pricing power |
| Asia electronics capacity | 60–70% | Geopolitical risk |
| Battery/PCB capacity (CN/TW) | 75–80% | Switching costs |
What is included in the product
Detailed Word Document
Comprehensive Porter's Five Forces analysis tailored to Flex, uncovering competitive intensity, supplier and buyer power, threat of substitutes and new entrants, and potential disruptors. Includes data-driven commentary on pricing and profitability pressures, strategic implications for market positioning, and a fully editable Word format for easy customization and reporting.
Customizable Excel Spreadsheet
A single, customizable Five Forces worksheet that turns messy market research into instant strategic clarity—adjust pressures, swap data, and produce radar visuals for decks in seconds. No macros, easy to copy into reports, and ideal for testing scenarios like new entrants or regulation changes.
Customers Bargaining Power
Large OEM concentration
Customers are global OEMs with scale and procurement sophistication, running competitive bids and enforcing price-down roadmaps that compress margins; their volume grants them strong bargaining power over rates and contract terms. Flex mitigates this by offering value-added engineering, integrated supply-chain solutions and lifecycle support to preserve pricing and stickiness.
Dual-sourcing norms
Many OEMs qualify multiple EMS partners per program, enabling price benchmarking and rapid reallocation of volumes; buyer leverage increases when designs are well-documented and transferable. Dual-sourcing norms intensify competition for margins, while Flex’s scale (FY2024 revenue about $24.7 billion) lets it invest in co-development and NPI excellence. These capabilities create stickiness that mitigates pure price-based switching.
Switching costs vary
In regulated verticals (medical, automotive) requalification timelines typically span 6–24 months and can cost hundreds of thousands to several million dollars, tempering buyer power. Consumer electronics and accessory programs shift in weeks–months, increasing buyer leverage. Where Flex embeds test IP and process know-how, switching becomes materially harder. Early design engagement raises exit frictions further.
Design and JDM influence
When Flex provides design, DFX, or JDM/ODM services it shapes specifications and BOMs, shifting buyer focus from pure unit price to total cost of ownership and speed-to-market; Flex reported fiscal 2024 revenue of about $26.1 billion, reflecting growing value-added services demand. Buyers still demand transparency and recurrent cost-downs, but deeper engineering content lets Flex capture higher margin and longer-duration contracts.
- Design influence: shifts negotiation to TCO and speed
- Buyer pressure: ongoing transparency and cost-downs
- Value capture: increases with engineering depth and program ownership
Service-level and SLAs
Buyers force strict KPIs on yield, on-time delivery and quality with penalty clauses commonly reaching up to 10% of contract value; performance-linked fees are widespread in 2024 and drive continuous pricing pressure. Strong SLA performance, however, secures preferred-supplier status and can deliver double-digit share gains for Flex. Flex leverages over 100 manufacturing sites across 30 countries to justify premium pricing through resiliency and nearshoring advantages.
- Penalty levels: up to 10% of contract value
- Performance fees: widespread in 2024 contracts
- Preferred status: double-digit share uplift
- Footprint: 100+ sites in 30 countries
OEM price pressure offset by engineering, scale and supply-chain integration to protect margins
Customers (global OEMs) exert strong price and contract leverage via competitive bids and multi-sourcing, compressing margins. Flex offsets this through engineering, supply-chain integration and scale, preserving stickiness and TCO focus. Regulated verticals raise switching costs (6–24 months requalification), while consumer programs remain highly contestable.
| Metric | 2024 |
|---|---|
| Revenue | $24.7B |
| Sites | 100+ |
| Penalty clauses | up to 10% |
| Requalification | 6–24 months |
Same Document Delivered
Flex Porter's Five Forces Analysis
This preview shows the exact Flex Porter's Five Forces Analysis you'll receive immediately after purchase—no surprises or placeholders. The document is fully formatted, professionally written, and ready for download and use the moment you buy. You’re viewing the final deliverable and will get instant access to this same file upon payment.











