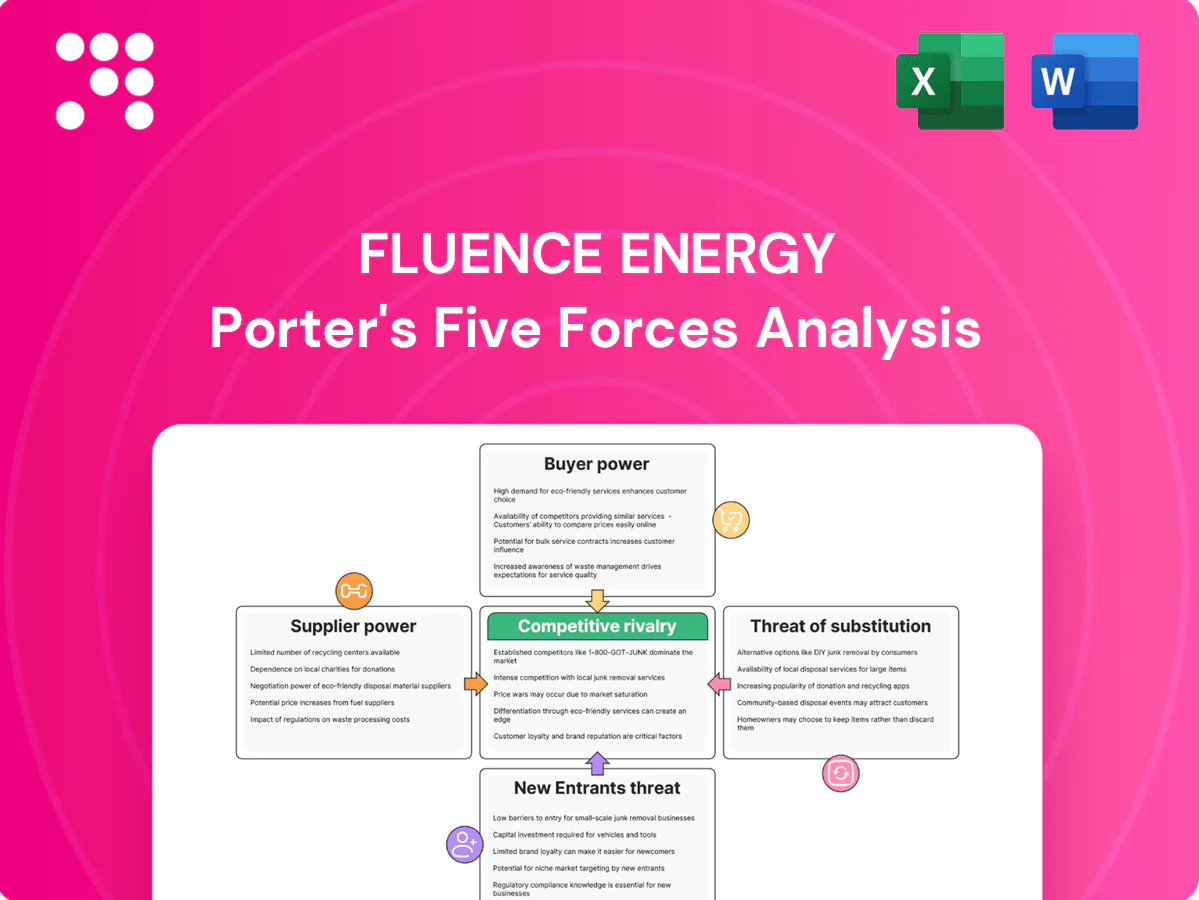
Fluence Energy Porter's Five Forces Analysis

A Must-Have Tool for Decision-Makers
Fluence Energy faces intense rivalry as project-based competition and price pressure collide with rising demand for grid-scale storage; supplier influence is moderate given specialized component sourcing, while buyer bargaining grows as utilities seek integrated solutions. Threat of new entrants is tempered by capital intensity and regulatory hurdles, but technological substitutes could alter margins. This brief snapshot only scratches the surface—unlock the full Porter’s Five Forces Analysis for force-by-force ratings, visuals, and actionable strategic insights.
Suppliers Bargaining Power

Concentrated battery cell suppliers
Li-ion cell supply is concentrated: the top five OEMs (CATL, LGES, Panasonic, Samsung SDI, SK On) held roughly 70% of global cell capacity in 2024, giving them pricing and allocation leverage. Long lead times of 12–18 months and stringent qualification raise Fluence’s dependence and force multi-year contracts to lock volumes. Average cell costs were near $100/kWh in 2024, so supplier-driven shifts or chemistry changes can reprice projects by double-digit percentages mid-pipeline.
Raw material volatility
Lithium, nickel and cobalt swings have driven battery pack cost volatility, with BNEF reporting an average pack price near $132/kWh in 2023 and raw materials comprising roughly 50–60% of pack costs; commodity-driven moves can shift pack margins materially and suppliers often pass through adjustments, limiting margin visibility. Hedging and chemistry diversification mitigate but do not eliminate exposure, complicating customer bids and EPC budgeting.

Inverters and power electronics
Key inverter and power-electronics components for Fluence are sourced from a limited set of certified vendors, often fewer than 10 per regional grid-code ecosystem, concentrating supplier power. Grid-code compliance (IEEE/UL/IEC standards) further narrows interchangeable options and drives suppliers with bankability pedigrees to command price premiums, commonly reported near 10–15%. Substitutions trigger project delays and re-testing that can add several months and materially increase costs.

Software and data dependencies
Some Fluence IQ analytics rely on third-party data and APIs, so changes in access terms or pricing can degrade features or raise costs; switching integrations is non-trivial because model retraining and validation introduce time and expense. Vendors owning unique datasets therefore hold bargaining leverage over feature availability and unit economics.
- Dependency: third-party APIs
- Switch cost: model retrain/validation
- Leverage: unique dataset vendors
Logistics and EPC partners
Specialized logistics for heavy, hazardous battery shipments raise supplier leverage over Fluence; 2024 industry reports show increased hazmat compliance complexity prolongs transit times and raises unit logistics costs. Port congestion and strict hazmat rules in 2024 pushed schedules out, amplifying carrier bargaining power. Regional EPC capacity bottlenecks in 2024 shifted pricing power to contractors, while penalty clauses transfer delay risk back down the supply chain.
- Specialized logistics: higher compliance burden (2024)
- Port congestion + hazmat rules: longer timelines (2024)
- Regional EPC constraints: contractor leverage (2024)
- Penalty clauses: delay risk borne by suppliers (2024)
Battery OEMs hold 70% capacity, causing 12-18 month waits and $100/kWh cell costs
Supplier power is high: top-five Li-ion OEMs held ~70% of global cell capacity in 2024, creating pricing/allocation leverage and 12–18 month lead times that force multi-year contracts. Cell costs ~ $100/kWh (2024) and pack prices ~$132/kWh (BNEF 2023) mean raw-material swings can change project economics by double-digit percent; inverters command ~10–15% premiums for bankability. API/data and hazmat logistics further raise switching costs.
| Metric | Value |
|---|---|
| Top-5 cell share (2024) | ~70% |
| Cell cost (2024) | $100/kWh |
| Pack price (2023) | $132/kWh |
| Lead times | 12–18 months |
| Inverter premium | 10–15% |
What is included in the product
 Detailed Word Document
Provides a targeted Porter's Five Forces assessment of Fluence Energy, examining competitive rivalry, supplier and buyer power, threat of new entrants and substitutes, and regulatory/technological disruptors to clarify pricing pressure, margin risks, and strategic defenses.

 Customizable Excel Spreadsheet
Clear, one-sheet Porter's Five Forces for Fluence Energy that instantly highlights competitive pain points and relief strategies, with adjustable pressure levels for changing market, regulatory, or technology scenarios—ready to drop into decks or dashboards.
Customers Bargaining Power

Large utility and IPP buyers
Large utilities and IPPs run competitive RFPs in 2024 with project sizes often 100–500+ MW, using volume and investment‑grade credit to demand aggressive pricing. Buyers push for strict performance guarantees and liquidated damages, shifting technical and commercial risk to vendors. Ongoing vendor consolidation (top suppliers capturing the bulk of bankable deals) tightens margin pressure for Fluence and peers.
Price transparency and LCOE focus
Customers benchmark Fluence offerings against frequent market-price updates and LCOE signals, with investment decisions driven by total cost of ownership and LCOS metrics; BNEF reported battery-pack prices around $129/kWh in 2024, tightening LCOS. Cell price declines are expected to flow through immediately to bids, and large buyers insist on commodity indexation (nickel, lithium) to cap supplier upside and preserve margins.

High technical and warranty requirements
Buyers demand stringent availability, safety, and degradation warranties that push Fluence to guarantee multi-year performance and uptime targets. Extended service and augmentation obligations transfer long-term operational and upgrade risk onto Fluence. Failure to meet KPIs can trigger liquidated damages and penalty clauses, concentrating lifecycle and financial exposure with the supplier. This elevates customer bargaining power by making contracts contingent on supplier risk management.

Switching costs with integration
Once EMS, SCADA, and market integrations are completed, switching costs for Fluence customers become high, locking utilities and developers into operational workflows and bidding processes; at the initial bid stage alternatives remain plentiful and price-sensitive. Multi-year software contracts in 2024 frequently extend client lock-in, yet many customers unbundle hardware and software to preserve negotiating leverage.
- High switching costs after integration
- Plentiful alternatives at bid stage
- 2024: multi-year software contracts increase lock-in
- Customers often unbundle to retain leverage
Project finance and bankability
Lenders demand proven vendors and enforce bankability for Fluence projects, pushing price discipline that narrows vendor margins and reduces differentiation; standardized financing terms make tech choice secondary to creditworthiness. Credit committees tightly scrutinize warranty backstops and reserve mechanisms, while buyers leverage financing contingencies to extract concessions on price and delivery.
- Bankability drives vendor selection
- Standardized terms limit differentiation
- Warranty reserves under committee scrutiny
- Financing contingencies used to negotiate concessions
100–500+ MW RFPs and $129/kWh packs drive aggressive pricing; buyers demand warranties
Large utilities/IPPs run 2024 RFPs of 100–500+ MW, using volume and credit to force aggressive pricing; BNEF reports battery-pack prices ≈ $129/kWh in 2024, pressuring LCOS. Buyers demand strict warranties, uptime SLAs and liquidated damages, shifting lifecycle risk to Fluence. High post‑integration switching costs raise lock‑in, but many buyers unbundle software to retain leverage.
| Metric | 2024 |
|---|---|
| Typical RFP size | 100–500+ MW |
| Battery-pack price | $129/kWh (BNEF) |
| Buyer tactics | Warranty, LDs, indexation |
Preview the Actual Deliverable
Fluence Energy Porter's Five Forces Analysis
This Fluence Energy Porter’s Five Forces analysis offers a concise, actionable assessment of competitive dynamics, supplier and buyer power, threats of entry and substitution, and industry rivalry. This preview is the exact document you’ll receive upon purchase—fully formatted and ready for immediate download. No placeholders or samples, just the final deliverable you can use right away.

A Must-Have Tool for Decision-Makers
Fluence Energy faces intense rivalry as project-based competition and price pressure collide with rising demand for grid-scale storage; supplier influence is moderate given specialized component sourcing, while buyer bargaining grows as utilities seek integrated solutions. Threat of new entrants is tempered by capital intensity and regulatory hurdles, but technological substitutes could alter margins. This brief snapshot only scratches the surface—unlock the full Porter’s Five Forces Analysis for force-by-force ratings, visuals, and actionable strategic insights.
Suppliers Bargaining Power
Concentrated battery cell suppliers
Li-ion cell supply is concentrated: the top five OEMs (CATL, LGES, Panasonic, Samsung SDI, SK On) held roughly 70% of global cell capacity in 2024, giving them pricing and allocation leverage. Long lead times of 12–18 months and stringent qualification raise Fluence’s dependence and force multi-year contracts to lock volumes. Average cell costs were near $100/kWh in 2024, so supplier-driven shifts or chemistry changes can reprice projects by double-digit percentages mid-pipeline.
Raw material volatility
Lithium, nickel and cobalt swings have driven battery pack cost volatility, with BNEF reporting an average pack price near $132/kWh in 2023 and raw materials comprising roughly 50–60% of pack costs; commodity-driven moves can shift pack margins materially and suppliers often pass through adjustments, limiting margin visibility. Hedging and chemistry diversification mitigate but do not eliminate exposure, complicating customer bids and EPC budgeting.
Inverters and power electronics
Key inverter and power-electronics components for Fluence are sourced from a limited set of certified vendors, often fewer than 10 per regional grid-code ecosystem, concentrating supplier power. Grid-code compliance (IEEE/UL/IEC standards) further narrows interchangeable options and drives suppliers with bankability pedigrees to command price premiums, commonly reported near 10–15%. Substitutions trigger project delays and re-testing that can add several months and materially increase costs.
Software and data dependencies
Some Fluence IQ analytics rely on third-party data and APIs, so changes in access terms or pricing can degrade features or raise costs; switching integrations is non-trivial because model retraining and validation introduce time and expense. Vendors owning unique datasets therefore hold bargaining leverage over feature availability and unit economics.
- Dependency: third-party APIs
- Switch cost: model retrain/validation
- Leverage: unique dataset vendors
Logistics and EPC partners
Specialized logistics for heavy, hazardous battery shipments raise supplier leverage over Fluence; 2024 industry reports show increased hazmat compliance complexity prolongs transit times and raises unit logistics costs. Port congestion and strict hazmat rules in 2024 pushed schedules out, amplifying carrier bargaining power. Regional EPC capacity bottlenecks in 2024 shifted pricing power to contractors, while penalty clauses transfer delay risk back down the supply chain.
- Specialized logistics: higher compliance burden (2024)
- Port congestion + hazmat rules: longer timelines (2024)
- Regional EPC constraints: contractor leverage (2024)
- Penalty clauses: delay risk borne by suppliers (2024)
Battery OEMs hold 70% capacity, causing 12-18 month waits and $100/kWh cell costs
Supplier power is high: top-five Li-ion OEMs held ~70% of global cell capacity in 2024, creating pricing/allocation leverage and 12–18 month lead times that force multi-year contracts. Cell costs ~ $100/kWh (2024) and pack prices ~$132/kWh (BNEF 2023) mean raw-material swings can change project economics by double-digit percent; inverters command ~10–15% premiums for bankability. API/data and hazmat logistics further raise switching costs.
| Metric | Value |
|---|---|
| Top-5 cell share (2024) | ~70% |
| Cell cost (2024) | $100/kWh |
| Pack price (2023) | $132/kWh |
| Lead times | 12–18 months |
| Inverter premium | 10–15% |
What is included in the product
Detailed Word Document
Provides a targeted Porter's Five Forces assessment of Fluence Energy, examining competitive rivalry, supplier and buyer power, threat of new entrants and substitutes, and regulatory/technological disruptors to clarify pricing pressure, margin risks, and strategic defenses.
Customizable Excel Spreadsheet
Clear, one-sheet Porter's Five Forces for Fluence Energy that instantly highlights competitive pain points and relief strategies, with adjustable pressure levels for changing market, regulatory, or technology scenarios—ready to drop into decks or dashboards.
Customers Bargaining Power
Large utility and IPP buyers
Large utilities and IPPs run competitive RFPs in 2024 with project sizes often 100–500+ MW, using volume and investment‑grade credit to demand aggressive pricing. Buyers push for strict performance guarantees and liquidated damages, shifting technical and commercial risk to vendors. Ongoing vendor consolidation (top suppliers capturing the bulk of bankable deals) tightens margin pressure for Fluence and peers.
Price transparency and LCOE focus
Customers benchmark Fluence offerings against frequent market-price updates and LCOE signals, with investment decisions driven by total cost of ownership and LCOS metrics; BNEF reported battery-pack prices around $129/kWh in 2024, tightening LCOS. Cell price declines are expected to flow through immediately to bids, and large buyers insist on commodity indexation (nickel, lithium) to cap supplier upside and preserve margins.
High technical and warranty requirements
Buyers demand stringent availability, safety, and degradation warranties that push Fluence to guarantee multi-year performance and uptime targets. Extended service and augmentation obligations transfer long-term operational and upgrade risk onto Fluence. Failure to meet KPIs can trigger liquidated damages and penalty clauses, concentrating lifecycle and financial exposure with the supplier. This elevates customer bargaining power by making contracts contingent on supplier risk management.
Switching costs with integration
Once EMS, SCADA, and market integrations are completed, switching costs for Fluence customers become high, locking utilities and developers into operational workflows and bidding processes; at the initial bid stage alternatives remain plentiful and price-sensitive. Multi-year software contracts in 2024 frequently extend client lock-in, yet many customers unbundle hardware and software to preserve negotiating leverage.
- High switching costs after integration
- Plentiful alternatives at bid stage
- 2024: multi-year software contracts increase lock-in
- Customers often unbundle to retain leverage
Project finance and bankability
Lenders demand proven vendors and enforce bankability for Fluence projects, pushing price discipline that narrows vendor margins and reduces differentiation; standardized financing terms make tech choice secondary to creditworthiness. Credit committees tightly scrutinize warranty backstops and reserve mechanisms, while buyers leverage financing contingencies to extract concessions on price and delivery.
- Bankability drives vendor selection
- Standardized terms limit differentiation
- Warranty reserves under committee scrutiny
- Financing contingencies used to negotiate concessions
100–500+ MW RFPs and $129/kWh packs drive aggressive pricing; buyers demand warranties
Large utilities/IPPs run 2024 RFPs of 100–500+ MW, using volume and credit to force aggressive pricing; BNEF reports battery-pack prices ≈ $129/kWh in 2024, pressuring LCOS. Buyers demand strict warranties, uptime SLAs and liquidated damages, shifting lifecycle risk to Fluence. High post‑integration switching costs raise lock‑in, but many buyers unbundle software to retain leverage.
| Metric | 2024 |
|---|---|
| Typical RFP size | 100–500+ MW |
| Battery-pack price | $129/kWh (BNEF) |
| Buyer tactics | Warranty, LDs, indexation |
Preview the Actual Deliverable
Fluence Energy Porter's Five Forces Analysis
This Fluence Energy Porter’s Five Forces analysis offers a concise, actionable assessment of competitive dynamics, supplier and buyer power, threats of entry and substitution, and industry rivalry. This preview is the exact document you’ll receive upon purchase—fully formatted and ready for immediate download. No placeholders or samples, just the final deliverable you can use right away.
Original: $10.00
-65%$10.00
$3.50Description
A Must-Have Tool for Decision-Makers
Fluence Energy faces intense rivalry as project-based competition and price pressure collide with rising demand for grid-scale storage; supplier influence is moderate given specialized component sourcing, while buyer bargaining grows as utilities seek integrated solutions. Threat of new entrants is tempered by capital intensity and regulatory hurdles, but technological substitutes could alter margins. This brief snapshot only scratches the surface—unlock the full Porter’s Five Forces Analysis for force-by-force ratings, visuals, and actionable strategic insights.
Suppliers Bargaining Power
Concentrated battery cell suppliers
Li-ion cell supply is concentrated: the top five OEMs (CATL, LGES, Panasonic, Samsung SDI, SK On) held roughly 70% of global cell capacity in 2024, giving them pricing and allocation leverage. Long lead times of 12–18 months and stringent qualification raise Fluence’s dependence and force multi-year contracts to lock volumes. Average cell costs were near $100/kWh in 2024, so supplier-driven shifts or chemistry changes can reprice projects by double-digit percentages mid-pipeline.
Raw material volatility
Lithium, nickel and cobalt swings have driven battery pack cost volatility, with BNEF reporting an average pack price near $132/kWh in 2023 and raw materials comprising roughly 50–60% of pack costs; commodity-driven moves can shift pack margins materially and suppliers often pass through adjustments, limiting margin visibility. Hedging and chemistry diversification mitigate but do not eliminate exposure, complicating customer bids and EPC budgeting.
Inverters and power electronics
Key inverter and power-electronics components for Fluence are sourced from a limited set of certified vendors, often fewer than 10 per regional grid-code ecosystem, concentrating supplier power. Grid-code compliance (IEEE/UL/IEC standards) further narrows interchangeable options and drives suppliers with bankability pedigrees to command price premiums, commonly reported near 10–15%. Substitutions trigger project delays and re-testing that can add several months and materially increase costs.
Software and data dependencies
Some Fluence IQ analytics rely on third-party data and APIs, so changes in access terms or pricing can degrade features or raise costs; switching integrations is non-trivial because model retraining and validation introduce time and expense. Vendors owning unique datasets therefore hold bargaining leverage over feature availability and unit economics.
- Dependency: third-party APIs
- Switch cost: model retrain/validation
- Leverage: unique dataset vendors
Logistics and EPC partners
Specialized logistics for heavy, hazardous battery shipments raise supplier leverage over Fluence; 2024 industry reports show increased hazmat compliance complexity prolongs transit times and raises unit logistics costs. Port congestion and strict hazmat rules in 2024 pushed schedules out, amplifying carrier bargaining power. Regional EPC capacity bottlenecks in 2024 shifted pricing power to contractors, while penalty clauses transfer delay risk back down the supply chain.
- Specialized logistics: higher compliance burden (2024)
- Port congestion + hazmat rules: longer timelines (2024)
- Regional EPC constraints: contractor leverage (2024)
- Penalty clauses: delay risk borne by suppliers (2024)
Battery OEMs hold 70% capacity, causing 12-18 month waits and $100/kWh cell costs
Supplier power is high: top-five Li-ion OEMs held ~70% of global cell capacity in 2024, creating pricing/allocation leverage and 12–18 month lead times that force multi-year contracts. Cell costs ~ $100/kWh (2024) and pack prices ~$132/kWh (BNEF 2023) mean raw-material swings can change project economics by double-digit percent; inverters command ~10–15% premiums for bankability. API/data and hazmat logistics further raise switching costs.
| Metric | Value |
|---|---|
| Top-5 cell share (2024) | ~70% |
| Cell cost (2024) | $100/kWh |
| Pack price (2023) | $132/kWh |
| Lead times | 12–18 months |
| Inverter premium | 10–15% |
What is included in the product
Detailed Word Document
Provides a targeted Porter's Five Forces assessment of Fluence Energy, examining competitive rivalry, supplier and buyer power, threat of new entrants and substitutes, and regulatory/technological disruptors to clarify pricing pressure, margin risks, and strategic defenses.
Customizable Excel Spreadsheet
Clear, one-sheet Porter's Five Forces for Fluence Energy that instantly highlights competitive pain points and relief strategies, with adjustable pressure levels for changing market, regulatory, or technology scenarios—ready to drop into decks or dashboards.
Customers Bargaining Power
Large utility and IPP buyers
Large utilities and IPPs run competitive RFPs in 2024 with project sizes often 100–500+ MW, using volume and investment‑grade credit to demand aggressive pricing. Buyers push for strict performance guarantees and liquidated damages, shifting technical and commercial risk to vendors. Ongoing vendor consolidation (top suppliers capturing the bulk of bankable deals) tightens margin pressure for Fluence and peers.
Price transparency and LCOE focus
Customers benchmark Fluence offerings against frequent market-price updates and LCOE signals, with investment decisions driven by total cost of ownership and LCOS metrics; BNEF reported battery-pack prices around $129/kWh in 2024, tightening LCOS. Cell price declines are expected to flow through immediately to bids, and large buyers insist on commodity indexation (nickel, lithium) to cap supplier upside and preserve margins.
High technical and warranty requirements
Buyers demand stringent availability, safety, and degradation warranties that push Fluence to guarantee multi-year performance and uptime targets. Extended service and augmentation obligations transfer long-term operational and upgrade risk onto Fluence. Failure to meet KPIs can trigger liquidated damages and penalty clauses, concentrating lifecycle and financial exposure with the supplier. This elevates customer bargaining power by making contracts contingent on supplier risk management.
Switching costs with integration
Once EMS, SCADA, and market integrations are completed, switching costs for Fluence customers become high, locking utilities and developers into operational workflows and bidding processes; at the initial bid stage alternatives remain plentiful and price-sensitive. Multi-year software contracts in 2024 frequently extend client lock-in, yet many customers unbundle hardware and software to preserve negotiating leverage.
- High switching costs after integration
- Plentiful alternatives at bid stage
- 2024: multi-year software contracts increase lock-in
- Customers often unbundle to retain leverage
Project finance and bankability
Lenders demand proven vendors and enforce bankability for Fluence projects, pushing price discipline that narrows vendor margins and reduces differentiation; standardized financing terms make tech choice secondary to creditworthiness. Credit committees tightly scrutinize warranty backstops and reserve mechanisms, while buyers leverage financing contingencies to extract concessions on price and delivery.
- Bankability drives vendor selection
- Standardized terms limit differentiation
- Warranty reserves under committee scrutiny
- Financing contingencies used to negotiate concessions
100–500+ MW RFPs and $129/kWh packs drive aggressive pricing; buyers demand warranties
Large utilities/IPPs run 2024 RFPs of 100–500+ MW, using volume and credit to force aggressive pricing; BNEF reports battery-pack prices ≈ $129/kWh in 2024, pressuring LCOS. Buyers demand strict warranties, uptime SLAs and liquidated damages, shifting lifecycle risk to Fluence. High post‑integration switching costs raise lock‑in, but many buyers unbundle software to retain leverage.
| Metric | 2024 |
|---|---|
| Typical RFP size | 100–500+ MW |
| Battery-pack price | $129/kWh (BNEF) |
| Buyer tactics | Warranty, LDs, indexation |
Preview the Actual Deliverable
Fluence Energy Porter's Five Forces Analysis
This Fluence Energy Porter’s Five Forces analysis offers a concise, actionable assessment of competitive dynamics, supplier and buyer power, threats of entry and substitution, and industry rivalry. This preview is the exact document you’ll receive upon purchase—fully formatted and ready for immediate download. No placeholders or samples, just the final deliverable you can use right away.











