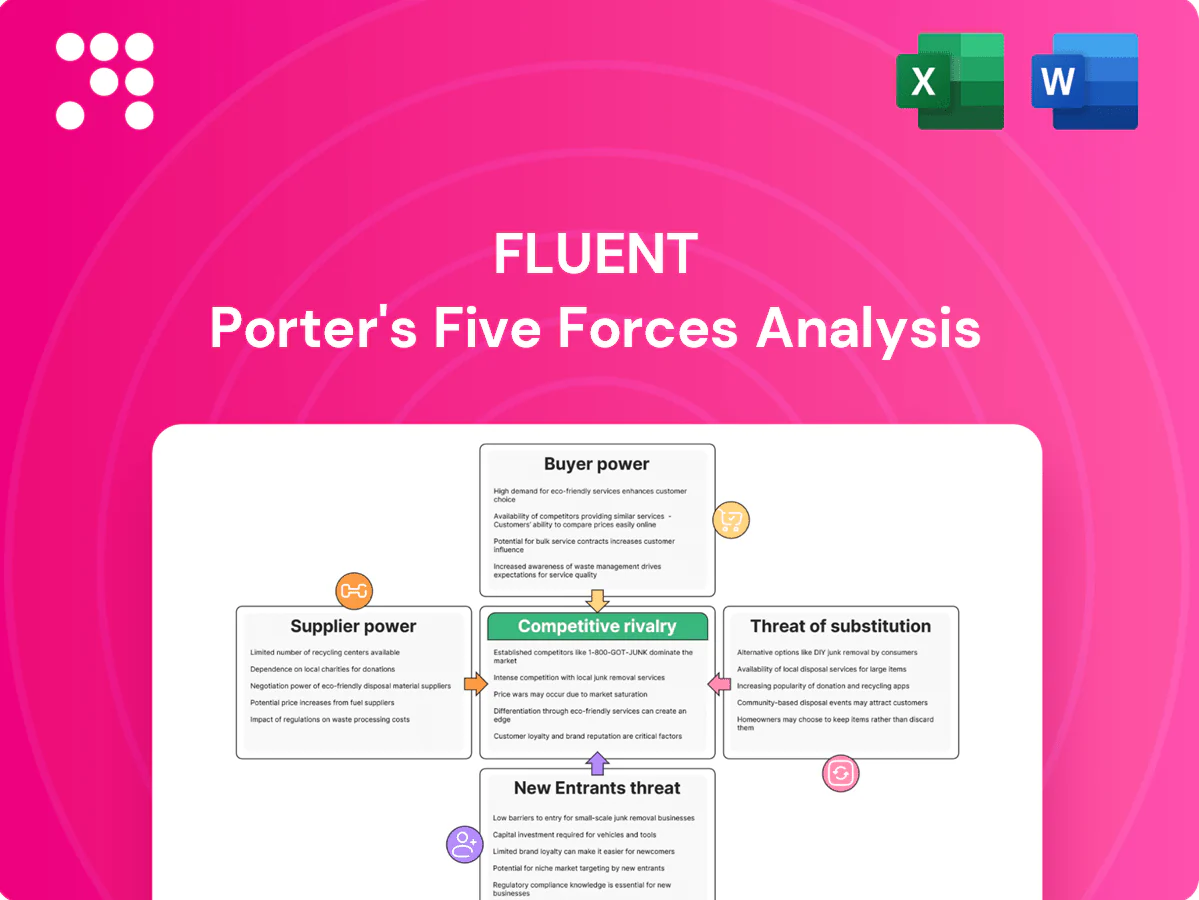
Fluent Porter's Five Forces Analysis

Don't Miss the Bigger Picture
Fluent’s Porter’s Five Forces snapshot highlights key competitive tensions, supplier and buyer leverage, and substitute threats shaping its market position. This brief teases critical dynamics but omits force-by-force ratings and visuals. Unlock the full Porter’s Five Forces Analysis for in-depth, data-driven insights and strategic recommendations. Purchase the complete report to inform investment or strategic decisions with consultant-grade clarity.
Suppliers Bargaining Power

Platform and inventory dependence
Fluent depends heavily on major platforms like Google and Meta plus ad exchanges, concentrating supplier power; Google and Meta accounted for about 60% of global digital ad revenue in 2024, amplifying exposure. Policy or pricing shifts can materially compress CPMs and margins, while preferred APIs and auction mechanics favor walled gardens. Building diversified traffic sources and direct publisher deals can reduce this leverage and stabilize delivery.
Data and identity providers
Third-party data, identity graphs, and verification vendors strongly influence targeting efficacy and compliance; Gartner 2024 found about 70% of CMOs prioritized first-party data strategies as match rates on cookie-based IDs dropped below 50% for many advertisers. Price increases or data access restrictions from dominant vendors raise acquisition costs and cut match rates, with some identity suppliers reporting double-digit price uplifts in 2023–24. Post-cookie identity solutions have given select providers outsized bargaining power, so building first-party data assets is the primary mitigation route.

MarTech and measurement stack
Attribution, anti-fraud and analytics vendors are critical to proof-of-performance and with over 10,000 MarTech vendors (ChiefMartec 2024) and global ad fraud losses estimated at $44B annually, suppliers wield leverage. High integration complexity and learning curves make switching costly, while bundled features and single-pane platforms increase lock-in. Open architectures and growing in-house analytics adoption lower switching friction and reclaim negotiating power.

Cloud, email, and deliverability
Cloud providers, ESPs, and major ISPs (Google, Microsoft) materially shape deliverability and latency; AWS/Azure/GCP held ~66% of global cloud market (Canalys, 2023), concentrating infrastructure control. Reputation and compliance thresholds (subscriber complaint rates ~0.1–0.3% trigger ISP actions) give these suppliers veto power over scale; cost rises or throttling can cut campaign ROI sharply. Strong list hygiene and multi-ESP redundancy reduce that leverage.
- Concentration: AWS/Azure/GCP ~66%
- Complaint threshold: ~0.1–0.3%
- Risk: throttling harms ROI
- Mitigation: list hygiene, multi-ESP
Publisher and affiliate networks
High-quality publishers and affiliate networks hold strong bargaining power by controlling premium audiences; top partners often command higher rev shares and exclusivities, while performance networks can reprice quickly in tight verticals. In 2024 affiliate marketing in the US exceeded 8 billion USD, increasing leverage for top publishers. Fluent improves terms via long-term contracts and exclusive creative/data angles.
- Premium audience concentration: drives higher CPMs and rev shares
- Top partners: negotiate exclusivity and 20–50%+ better economics
- Performance networks: fast repricing in competitive verticals
- Fluent: long-term deals and unique data reduce supplier power
Platform/cloud concentration (60% ad, 66% cloud) raises pricing and delivery risk
Fluent faces concentrated supplier power from Google/Meta (~60% of global digital ad revenue in 2024) and major cloud providers (AWS/Azure/GCP ~66% share in 2023), amplifying pricing and policy risk. Identity vendors tightened leverage as cookie match rates fell below 50% and 70% of CMOs prioritized first-party data in 2024. Mitigations: diversify channels, build first-party data, multi-ESP and in-house analytics.
| Supplier | 2023–24 metric | Impact | Mitigation |
|---|---|---|---|
| Platforms | 60% ad rev (2024) | Price/policy risk | Direct deals, diversify |
| Cloud | 66% market (2023) | Delivery/throttle risk | Multi-cloud |
| Identity | Match <50%, 70% CMO focus (2024) | Higher acquisition costs | First-party data |
What is included in the product
 Detailed Word Document
Provides a tailored Porter's Five Forces assessment for Fluent, uncovering competitive intensity, supplier and buyer power, threat of substitutes and entrants, and strategic levers to defend market share, with data-driven insights and actionable recommendations for investors, executives, and strategists.

 Customizable Excel Spreadsheet
Fluent Porter's Five Forces turns complex competitive assessments into a single, actionable snapshot—remove guesswork and speed strategic decisions. Use customizable pressure levels and radar visuals to instantly pinpoint threats and opportunities without technical overhead.
Customers Bargaining Power

Advertiser consolidation
Larger brands and agencies increasingly aggregate spend and negotiate aggressively, pushing Fluent toward volume-based pricing and performance guarantees that shift campaign risk onto the publisher. Loss of a small number of large accounts can materially dent revenue concentration given Fluent’s client mix. Diversifying into more verticals and a larger SMB base reduces buyer leverage and stabilizes pricing power.
Low switching costs
Performance marketing services are highly substitutable across vendors, with many clients using monthly or quarterly trial budgets and short contracts that enable easy A/B tests and vendor swaps. Transparent reporting and standardized KPIs make direct performance comparisons straightforward. However, differentiated first-party data, exclusive supply deals and outcomes-based IP can materially raise switching costs for high-value campaigns.

Performance-based pricing pressure
Performance-based CPA/CPL models put margins at risk when traffic costs rise, with advertisers reporting up to 25% of programmatic spend lost to invalid traffic in 2024, squeezing net returns. Buyers increasingly demand tighter targets and fraud safeguards without higher rates, while clawbacks and quality scorecards intensify payment risk. Predictive bidding and rigorous pre-qualification have cut CPA volatility in pilot programs by as much as 25%, preserving unit economics.

In-housing and tools
Advertisers increasingly brought media buying and analytics in-house by 2024, with industry surveys indicating around 40% of large brands significantly expanding in-housing, reducing reliance on intermediaries and pressuring agency take rates via procurement benchmarking. Agencies counter by offering managed services plus tech/licensing to neutralize the shift.
- In-housing growth ~40% (2024)
- Procurement compresses agency fees
- Managed service + licensing mitigates churn
Compliance and brand safety demands
Buyers demand strict consent, privacy and placement controls driven by GDPR and the US CPRA updates that strengthened enforcement through 2023–2024; extra verification and audits raise delivery costs and complexity, and non-compliance often triggers immediate budget pullbacks from risk-averse advertisers.
- Strict consent & placement controls
- Verification/audits increase cost
- Regulatory risk prompts rapid budget cuts
- Certifications create a trust premium
In-housing ~40% and invalid traffic ~25% squeeze agency margins
Larger brands and agencies (in-housing ~40% in 2024) push volume pricing and guarantees, risking revenue when a few clients churn. Performance services are highly substitutable, though exclusive first-party data and IP raise switching costs for top clients. Fraud (~25% programmatic invalid traffic reported in 2024) and tighter KPIs squeeze margins and prompt demands for lower fees and stronger verification.
| Metric | 2024 Value |
|---|---|
| In-housing rate | ~40% |
| Invalid traffic loss | ~25% |
| Revenue concentration risk | High (few large clients) |
Preview the Actual Deliverable
Fluent Porter's Five Forces Analysis
This preview shows the exact Fluent Porter's Five Forces Analysis you'll receive upon purchase—no placeholders or mockups. The fully formatted, professionally written document is ready for immediate download and use the moment you buy. What you see here is the final deliverable, identical to the file provided after payment. No surprises, just the complete analysis ready for your needs.

Don't Miss the Bigger Picture
Fluent’s Porter’s Five Forces snapshot highlights key competitive tensions, supplier and buyer leverage, and substitute threats shaping its market position. This brief teases critical dynamics but omits force-by-force ratings and visuals. Unlock the full Porter’s Five Forces Analysis for in-depth, data-driven insights and strategic recommendations. Purchase the complete report to inform investment or strategic decisions with consultant-grade clarity.
Suppliers Bargaining Power
Platform and inventory dependence
Fluent depends heavily on major platforms like Google and Meta plus ad exchanges, concentrating supplier power; Google and Meta accounted for about 60% of global digital ad revenue in 2024, amplifying exposure. Policy or pricing shifts can materially compress CPMs and margins, while preferred APIs and auction mechanics favor walled gardens. Building diversified traffic sources and direct publisher deals can reduce this leverage and stabilize delivery.
Data and identity providers
Third-party data, identity graphs, and verification vendors strongly influence targeting efficacy and compliance; Gartner 2024 found about 70% of CMOs prioritized first-party data strategies as match rates on cookie-based IDs dropped below 50% for many advertisers. Price increases or data access restrictions from dominant vendors raise acquisition costs and cut match rates, with some identity suppliers reporting double-digit price uplifts in 2023–24. Post-cookie identity solutions have given select providers outsized bargaining power, so building first-party data assets is the primary mitigation route.
MarTech and measurement stack
Attribution, anti-fraud and analytics vendors are critical to proof-of-performance and with over 10,000 MarTech vendors (ChiefMartec 2024) and global ad fraud losses estimated at $44B annually, suppliers wield leverage. High integration complexity and learning curves make switching costly, while bundled features and single-pane platforms increase lock-in. Open architectures and growing in-house analytics adoption lower switching friction and reclaim negotiating power.
Cloud, email, and deliverability
Cloud providers, ESPs, and major ISPs (Google, Microsoft) materially shape deliverability and latency; AWS/Azure/GCP held ~66% of global cloud market (Canalys, 2023), concentrating infrastructure control. Reputation and compliance thresholds (subscriber complaint rates ~0.1–0.3% trigger ISP actions) give these suppliers veto power over scale; cost rises or throttling can cut campaign ROI sharply. Strong list hygiene and multi-ESP redundancy reduce that leverage.
- Concentration: AWS/Azure/GCP ~66%
- Complaint threshold: ~0.1–0.3%
- Risk: throttling harms ROI
- Mitigation: list hygiene, multi-ESP
Publisher and affiliate networks
High-quality publishers and affiliate networks hold strong bargaining power by controlling premium audiences; top partners often command higher rev shares and exclusivities, while performance networks can reprice quickly in tight verticals. In 2024 affiliate marketing in the US exceeded 8 billion USD, increasing leverage for top publishers. Fluent improves terms via long-term contracts and exclusive creative/data angles.
- Premium audience concentration: drives higher CPMs and rev shares
- Top partners: negotiate exclusivity and 20–50%+ better economics
- Performance networks: fast repricing in competitive verticals
- Fluent: long-term deals and unique data reduce supplier power
Platform/cloud concentration (60% ad, 66% cloud) raises pricing and delivery risk
Fluent faces concentrated supplier power from Google/Meta (~60% of global digital ad revenue in 2024) and major cloud providers (AWS/Azure/GCP ~66% share in 2023), amplifying pricing and policy risk. Identity vendors tightened leverage as cookie match rates fell below 50% and 70% of CMOs prioritized first-party data in 2024. Mitigations: diversify channels, build first-party data, multi-ESP and in-house analytics.
| Supplier | 2023–24 metric | Impact | Mitigation |
|---|---|---|---|
| Platforms | 60% ad rev (2024) | Price/policy risk | Direct deals, diversify |
| Cloud | 66% market (2023) | Delivery/throttle risk | Multi-cloud |
| Identity | Match <50%, 70% CMO focus (2024) | Higher acquisition costs | First-party data |
What is included in the product
Detailed Word Document
Provides a tailored Porter's Five Forces assessment for Fluent, uncovering competitive intensity, supplier and buyer power, threat of substitutes and entrants, and strategic levers to defend market share, with data-driven insights and actionable recommendations for investors, executives, and strategists.
Customizable Excel Spreadsheet
Fluent Porter's Five Forces turns complex competitive assessments into a single, actionable snapshot—remove guesswork and speed strategic decisions. Use customizable pressure levels and radar visuals to instantly pinpoint threats and opportunities without technical overhead.
Customers Bargaining Power
Advertiser consolidation
Larger brands and agencies increasingly aggregate spend and negotiate aggressively, pushing Fluent toward volume-based pricing and performance guarantees that shift campaign risk onto the publisher. Loss of a small number of large accounts can materially dent revenue concentration given Fluent’s client mix. Diversifying into more verticals and a larger SMB base reduces buyer leverage and stabilizes pricing power.
Low switching costs
Performance marketing services are highly substitutable across vendors, with many clients using monthly or quarterly trial budgets and short contracts that enable easy A/B tests and vendor swaps. Transparent reporting and standardized KPIs make direct performance comparisons straightforward. However, differentiated first-party data, exclusive supply deals and outcomes-based IP can materially raise switching costs for high-value campaigns.
Performance-based pricing pressure
Performance-based CPA/CPL models put margins at risk when traffic costs rise, with advertisers reporting up to 25% of programmatic spend lost to invalid traffic in 2024, squeezing net returns. Buyers increasingly demand tighter targets and fraud safeguards without higher rates, while clawbacks and quality scorecards intensify payment risk. Predictive bidding and rigorous pre-qualification have cut CPA volatility in pilot programs by as much as 25%, preserving unit economics.
In-housing and tools
Advertisers increasingly brought media buying and analytics in-house by 2024, with industry surveys indicating around 40% of large brands significantly expanding in-housing, reducing reliance on intermediaries and pressuring agency take rates via procurement benchmarking. Agencies counter by offering managed services plus tech/licensing to neutralize the shift.
- In-housing growth ~40% (2024)
- Procurement compresses agency fees
- Managed service + licensing mitigates churn
Compliance and brand safety demands
Buyers demand strict consent, privacy and placement controls driven by GDPR and the US CPRA updates that strengthened enforcement through 2023–2024; extra verification and audits raise delivery costs and complexity, and non-compliance often triggers immediate budget pullbacks from risk-averse advertisers.
- Strict consent & placement controls
- Verification/audits increase cost
- Regulatory risk prompts rapid budget cuts
- Certifications create a trust premium
In-housing ~40% and invalid traffic ~25% squeeze agency margins
Larger brands and agencies (in-housing ~40% in 2024) push volume pricing and guarantees, risking revenue when a few clients churn. Performance services are highly substitutable, though exclusive first-party data and IP raise switching costs for top clients. Fraud (~25% programmatic invalid traffic reported in 2024) and tighter KPIs squeeze margins and prompt demands for lower fees and stronger verification.
| Metric | 2024 Value |
|---|---|
| In-housing rate | ~40% |
| Invalid traffic loss | ~25% |
| Revenue concentration risk | High (few large clients) |
Preview the Actual Deliverable
Fluent Porter's Five Forces Analysis
This preview shows the exact Fluent Porter's Five Forces Analysis you'll receive upon purchase—no placeholders or mockups. The fully formatted, professionally written document is ready for immediate download and use the moment you buy. What you see here is the final deliverable, identical to the file provided after payment. No surprises, just the complete analysis ready for your needs.
Original: $10.00
-65%$10.00
$3.50Description
Don't Miss the Bigger Picture
Fluent’s Porter’s Five Forces snapshot highlights key competitive tensions, supplier and buyer leverage, and substitute threats shaping its market position. This brief teases critical dynamics but omits force-by-force ratings and visuals. Unlock the full Porter’s Five Forces Analysis for in-depth, data-driven insights and strategic recommendations. Purchase the complete report to inform investment or strategic decisions with consultant-grade clarity.
Suppliers Bargaining Power
Platform and inventory dependence
Fluent depends heavily on major platforms like Google and Meta plus ad exchanges, concentrating supplier power; Google and Meta accounted for about 60% of global digital ad revenue in 2024, amplifying exposure. Policy or pricing shifts can materially compress CPMs and margins, while preferred APIs and auction mechanics favor walled gardens. Building diversified traffic sources and direct publisher deals can reduce this leverage and stabilize delivery.
Data and identity providers
Third-party data, identity graphs, and verification vendors strongly influence targeting efficacy and compliance; Gartner 2024 found about 70% of CMOs prioritized first-party data strategies as match rates on cookie-based IDs dropped below 50% for many advertisers. Price increases or data access restrictions from dominant vendors raise acquisition costs and cut match rates, with some identity suppliers reporting double-digit price uplifts in 2023–24. Post-cookie identity solutions have given select providers outsized bargaining power, so building first-party data assets is the primary mitigation route.
MarTech and measurement stack
Attribution, anti-fraud and analytics vendors are critical to proof-of-performance and with over 10,000 MarTech vendors (ChiefMartec 2024) and global ad fraud losses estimated at $44B annually, suppliers wield leverage. High integration complexity and learning curves make switching costly, while bundled features and single-pane platforms increase lock-in. Open architectures and growing in-house analytics adoption lower switching friction and reclaim negotiating power.
Cloud, email, and deliverability
Cloud providers, ESPs, and major ISPs (Google, Microsoft) materially shape deliverability and latency; AWS/Azure/GCP held ~66% of global cloud market (Canalys, 2023), concentrating infrastructure control. Reputation and compliance thresholds (subscriber complaint rates ~0.1–0.3% trigger ISP actions) give these suppliers veto power over scale; cost rises or throttling can cut campaign ROI sharply. Strong list hygiene and multi-ESP redundancy reduce that leverage.
- Concentration: AWS/Azure/GCP ~66%
- Complaint threshold: ~0.1–0.3%
- Risk: throttling harms ROI
- Mitigation: list hygiene, multi-ESP
Publisher and affiliate networks
High-quality publishers and affiliate networks hold strong bargaining power by controlling premium audiences; top partners often command higher rev shares and exclusivities, while performance networks can reprice quickly in tight verticals. In 2024 affiliate marketing in the US exceeded 8 billion USD, increasing leverage for top publishers. Fluent improves terms via long-term contracts and exclusive creative/data angles.
- Premium audience concentration: drives higher CPMs and rev shares
- Top partners: negotiate exclusivity and 20–50%+ better economics
- Performance networks: fast repricing in competitive verticals
- Fluent: long-term deals and unique data reduce supplier power
Platform/cloud concentration (60% ad, 66% cloud) raises pricing and delivery risk
Fluent faces concentrated supplier power from Google/Meta (~60% of global digital ad revenue in 2024) and major cloud providers (AWS/Azure/GCP ~66% share in 2023), amplifying pricing and policy risk. Identity vendors tightened leverage as cookie match rates fell below 50% and 70% of CMOs prioritized first-party data in 2024. Mitigations: diversify channels, build first-party data, multi-ESP and in-house analytics.
| Supplier | 2023–24 metric | Impact | Mitigation |
|---|---|---|---|
| Platforms | 60% ad rev (2024) | Price/policy risk | Direct deals, diversify |
| Cloud | 66% market (2023) | Delivery/throttle risk | Multi-cloud |
| Identity | Match <50%, 70% CMO focus (2024) | Higher acquisition costs | First-party data |
What is included in the product
Detailed Word Document
Provides a tailored Porter's Five Forces assessment for Fluent, uncovering competitive intensity, supplier and buyer power, threat of substitutes and entrants, and strategic levers to defend market share, with data-driven insights and actionable recommendations for investors, executives, and strategists.
Customizable Excel Spreadsheet
Fluent Porter's Five Forces turns complex competitive assessments into a single, actionable snapshot—remove guesswork and speed strategic decisions. Use customizable pressure levels and radar visuals to instantly pinpoint threats and opportunities without technical overhead.
Customers Bargaining Power
Advertiser consolidation
Larger brands and agencies increasingly aggregate spend and negotiate aggressively, pushing Fluent toward volume-based pricing and performance guarantees that shift campaign risk onto the publisher. Loss of a small number of large accounts can materially dent revenue concentration given Fluent’s client mix. Diversifying into more verticals and a larger SMB base reduces buyer leverage and stabilizes pricing power.
Low switching costs
Performance marketing services are highly substitutable across vendors, with many clients using monthly or quarterly trial budgets and short contracts that enable easy A/B tests and vendor swaps. Transparent reporting and standardized KPIs make direct performance comparisons straightforward. However, differentiated first-party data, exclusive supply deals and outcomes-based IP can materially raise switching costs for high-value campaigns.
Performance-based pricing pressure
Performance-based CPA/CPL models put margins at risk when traffic costs rise, with advertisers reporting up to 25% of programmatic spend lost to invalid traffic in 2024, squeezing net returns. Buyers increasingly demand tighter targets and fraud safeguards without higher rates, while clawbacks and quality scorecards intensify payment risk. Predictive bidding and rigorous pre-qualification have cut CPA volatility in pilot programs by as much as 25%, preserving unit economics.
In-housing and tools
Advertisers increasingly brought media buying and analytics in-house by 2024, with industry surveys indicating around 40% of large brands significantly expanding in-housing, reducing reliance on intermediaries and pressuring agency take rates via procurement benchmarking. Agencies counter by offering managed services plus tech/licensing to neutralize the shift.
- In-housing growth ~40% (2024)
- Procurement compresses agency fees
- Managed service + licensing mitigates churn
Compliance and brand safety demands
Buyers demand strict consent, privacy and placement controls driven by GDPR and the US CPRA updates that strengthened enforcement through 2023–2024; extra verification and audits raise delivery costs and complexity, and non-compliance often triggers immediate budget pullbacks from risk-averse advertisers.
- Strict consent & placement controls
- Verification/audits increase cost
- Regulatory risk prompts rapid budget cuts
- Certifications create a trust premium
In-housing ~40% and invalid traffic ~25% squeeze agency margins
Larger brands and agencies (in-housing ~40% in 2024) push volume pricing and guarantees, risking revenue when a few clients churn. Performance services are highly substitutable, though exclusive first-party data and IP raise switching costs for top clients. Fraud (~25% programmatic invalid traffic reported in 2024) and tighter KPIs squeeze margins and prompt demands for lower fees and stronger verification.
| Metric | 2024 Value |
|---|---|
| In-housing rate | ~40% |
| Invalid traffic loss | ~25% |
| Revenue concentration risk | High (few large clients) |
Preview the Actual Deliverable
Fluent Porter's Five Forces Analysis
This preview shows the exact Fluent Porter's Five Forces Analysis you'll receive upon purchase—no placeholders or mockups. The fully formatted, professionally written document is ready for immediate download and use the moment you buy. What you see here is the final deliverable, identical to the file provided after payment. No surprises, just the complete analysis ready for your needs.











