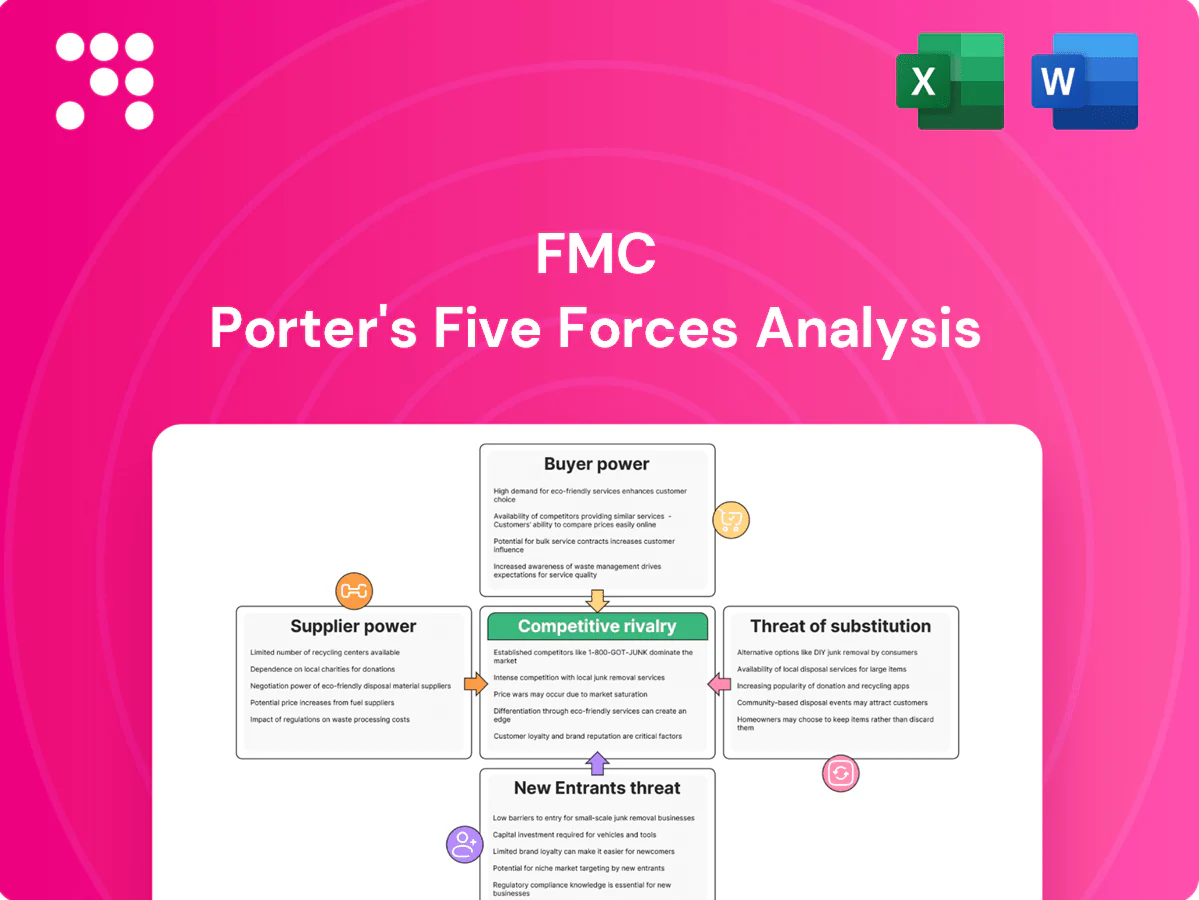
FMC Porter's Five Forces Analysis

Elevate Your Analysis with the Complete Porter's Five Forces Analysis
FMC faces moderate supplier power, variable buyer concentration, and evolving substitute threats driven by innovation and regulation. Competitive rivalry and potential new entrants shape margins and strategic urgency across segments. This brief snapshot only scratches the surface—unlock the full Porter's Five Forces Analysis to explore FMC’s competitive dynamics, market pressures, and strategic advantages in detail.
Suppliers Bargaining Power

Concentrated specialty chemical inputs
Many key intermediates and reagents for FMC active ingredients come from a concentrated set of specialty chemical suppliers, and with the global specialty chemicals market estimated at about $700 billion in 2024 the few qualified sources command leverage on price and terms. Limited qualified alternatives raise switching costs and force FMC to dual‑source and invest in qualification to mitigate concentration risk. Any supplier disruption can delay production and product launches, impacting time‑to‑market and revenue timing.
High switching and qualification costs
Changing suppliers often requires 6–12 months of requalification, stability testing and regulatory notifications, with industry costs commonly cited in 2024 at $250k–$2M per SKU, making switches costly and slow. Suppliers exploit this friction to press for tougher pricing and terms, while long-term contracts and VMI programs materially reduce buyer exposure.

Regulatory and ESG constraints
Suppliers must comply with stringent REACH rules (over 20,000 registered substances) and TSCA (US inventory >85,000 chemicals) plus global HSE standards, which concentrates qualified vendors and raises input costs. ESG scrutiny on solvents, fluorinated compounds and waste handling further tightens supply. FMC uses supplier audits, development programs and contractual KPIs to preserve continuity.

Energy and logistics volatility pass-through
- 2024 Brent avg ~86 USD/bbl — energy-driven surcharges rose
- Indexed contracts + hedges cut volatility impact
- Nearshoring lowered freight exposure
Tolling and custom synthesis dependence
Reliance on specialized toll manufacturers for complex molecules concentrates supplier power, especially as many CDMOs reported capacity utilization above 80% in 2024, creating potential bottlenecks for scale-up.
Proprietary process know-how and single-supplier relationships can lock in specific tollers and raise switching costs, while collaborative joint process optimization programs have reduced yield losses by up to 10% in reported partnerships, rebalancing negotiating leverage.
- High capacity utilization: >80% (2024)
- Switching costs: proprietary know-how locks supply
- Mitigation: joint optimization can cut yield loss ≈10%
High supplier power: specialty chemicals ≈700B, requal 6–12m (250k–2M/SKU), CDMO util >80%
Supplier power is high: specialty chemical sourcing is concentrated (global specialty chemicals ≈700B USD in 2024), requalification takes 6–12 months and costs 250k–2M USD per SKU, and CDMO capacity utilization exceeded 80% in 2024, raising switching costs and bottleneck risk.
| Metric | 2024 |
|---|---|
| Specialty market | ≈700B USD |
| Requal cost/SKU | 250k–2M USD |
| CDMO util. | >80% |
| Brent avg | ≈86 USD/bbl |
What is included in the product
 Detailed Word Document
Concise Porter's Five Forces analysis for FMC that uncovers competitive intensity, buyer and supplier bargaining power, threats from new entrants and substitutes, and identifies emerging disruptive forces with strategic commentary for investor and management use.

 Customizable Excel Spreadsheet
One-sheet FMC Porter's Five Forces that quantifies competitive pressure across suppliers, buyers, entrants and substitutes—editable inputs, instant radar visualization and copy-ready layout to remove analysis bottlenecks.
Customers Bargaining Power

Large distributors and retailers consolidate demand
Ag channel partners aggregate farmer purchasing and negotiate volume rebates, with the top three US ag retailers controlling roughly 50% of the crop‑input market, amplifying price pressure and stricter payment-term demands. Co-marketing, promotional programs and slotting support are now table stakes for >90% of major accounts. FMC must tailor rebates, marketing funds and inventory incentives to retain shelf space and mindshare.
Farmer price sensitivity to crop cycles
When commodity prices slip growers commonly trade down or delay inputs, and the 2022–24 fertilizer price drop of roughly 30% from peak levels amplified supplier discounting pressure; demonstrable ROI and resistance‑management data sustain premium pricing, while flexible pack sizes and farmer financing (crop‑linked credit) soften demand elasticity.

Availability of generics and off-patent options
Patent expiries in 2024 accelerated launches of generics, which now represent an estimated 30–40% of global agrochemical volumes, boosting buyer leverage as channel partners anchor negotiations on lower-cost off-patent alternatives. Manufacturers defend value with differentiated formulations and mixtures that sustain price premiums. Stewardship, warranty terms and agronomic service bundles further limit pure price comparisons by adding measurable service value.

Performance-critical, moderate switching
Performance is mission-critical in crop protection, so reckless switching is limited; demonstrated efficacy and local agronomic support keep churn low, while demo plots and multi-season field trials enable measured brand shifts across seasons. Proven performance data and label breadth/crop fit further reduce churn, with trial-driven adoption often concentrated in 1–2 seasons.
- Trials enable seasonal shifts
- Local support retains customers
- Label breadth reduces churn
Institutional and public buyers in non-ag
Institutional and public buyers such as municipalities and large facilities drive professional pest and turf demand, using formal tenders and strict compliance to raise documentation and pricing scrutiny. Multi-year contracts, commonly 3–5 years, can lock volumes at tight margins often in the 3–7% range. Certification, safety records and regulatory compliance materially affect award decisions.
- Buyers: municipalities, large facilities
- Tenders: strict documentation
- Contracts: 3–5 years
- Margins: 3–7%
- Deciders: certifications & safety
Top 3 control ~50%; generics and price drops cut margins to 3-7%
Channel concentration gives buyers strong leverage—top 3 US ag retailers control ~50% of crop‑input sales, forcing rebates and tighter payment terms. Fertilizer price declines (~30% 2022–24) and generics (30–40% of agrochemical volumes in 2024) increase switching pressure. Multi‑year institutional contracts (3–5 yrs) compress margins to ~3–7% while stewardship and local agronomy limit churn.
| Metric | 2024 Value |
|---|---|
| Top‑3 US retailer share | ~50% |
| Fertilizer price drop (2022–24) | ~30% |
| Generics share | 30–40% |
| Institutional contract margins | 3–7% |
Same Document Delivered
FMC Porter's Five Forces Analysis
This preview shows the exact FMC Porter's Five Forces Analysis you'll receive after purchase—fully formatted, professionally written, and ready to use. It contains the complete competitive assessment, key insights, and actionable implications. No mockups or placeholders; instant download upon payment.

Elevate Your Analysis with the Complete Porter's Five Forces Analysis
FMC faces moderate supplier power, variable buyer concentration, and evolving substitute threats driven by innovation and regulation. Competitive rivalry and potential new entrants shape margins and strategic urgency across segments. This brief snapshot only scratches the surface—unlock the full Porter's Five Forces Analysis to explore FMC’s competitive dynamics, market pressures, and strategic advantages in detail.
Suppliers Bargaining Power
Concentrated specialty chemical inputs
Many key intermediates and reagents for FMC active ingredients come from a concentrated set of specialty chemical suppliers, and with the global specialty chemicals market estimated at about $700 billion in 2024 the few qualified sources command leverage on price and terms. Limited qualified alternatives raise switching costs and force FMC to dual‑source and invest in qualification to mitigate concentration risk. Any supplier disruption can delay production and product launches, impacting time‑to‑market and revenue timing.
High switching and qualification costs
Changing suppliers often requires 6–12 months of requalification, stability testing and regulatory notifications, with industry costs commonly cited in 2024 at $250k–$2M per SKU, making switches costly and slow. Suppliers exploit this friction to press for tougher pricing and terms, while long-term contracts and VMI programs materially reduce buyer exposure.
Regulatory and ESG constraints
Suppliers must comply with stringent REACH rules (over 20,000 registered substances) and TSCA (US inventory >85,000 chemicals) plus global HSE standards, which concentrates qualified vendors and raises input costs. ESG scrutiny on solvents, fluorinated compounds and waste handling further tightens supply. FMC uses supplier audits, development programs and contractual KPIs to preserve continuity.
Energy and logistics volatility pass-through
- 2024 Brent avg ~86 USD/bbl — energy-driven surcharges rose
- Indexed contracts + hedges cut volatility impact
- Nearshoring lowered freight exposure
Tolling and custom synthesis dependence
Reliance on specialized toll manufacturers for complex molecules concentrates supplier power, especially as many CDMOs reported capacity utilization above 80% in 2024, creating potential bottlenecks for scale-up.
Proprietary process know-how and single-supplier relationships can lock in specific tollers and raise switching costs, while collaborative joint process optimization programs have reduced yield losses by up to 10% in reported partnerships, rebalancing negotiating leverage.
- High capacity utilization: >80% (2024)
- Switching costs: proprietary know-how locks supply
- Mitigation: joint optimization can cut yield loss ≈10%
High supplier power: specialty chemicals ≈700B, requal 6–12m (250k–2M/SKU), CDMO util >80%
Supplier power is high: specialty chemical sourcing is concentrated (global specialty chemicals ≈700B USD in 2024), requalification takes 6–12 months and costs 250k–2M USD per SKU, and CDMO capacity utilization exceeded 80% in 2024, raising switching costs and bottleneck risk.
| Metric | 2024 |
|---|---|
| Specialty market | ≈700B USD |
| Requal cost/SKU | 250k–2M USD |
| CDMO util. | >80% |
| Brent avg | ≈86 USD/bbl |
What is included in the product
Detailed Word Document
Concise Porter's Five Forces analysis for FMC that uncovers competitive intensity, buyer and supplier bargaining power, threats from new entrants and substitutes, and identifies emerging disruptive forces with strategic commentary for investor and management use.
Customizable Excel Spreadsheet
One-sheet FMC Porter's Five Forces that quantifies competitive pressure across suppliers, buyers, entrants and substitutes—editable inputs, instant radar visualization and copy-ready layout to remove analysis bottlenecks.
Customers Bargaining Power
Large distributors and retailers consolidate demand
Ag channel partners aggregate farmer purchasing and negotiate volume rebates, with the top three US ag retailers controlling roughly 50% of the crop‑input market, amplifying price pressure and stricter payment-term demands. Co-marketing, promotional programs and slotting support are now table stakes for >90% of major accounts. FMC must tailor rebates, marketing funds and inventory incentives to retain shelf space and mindshare.
Farmer price sensitivity to crop cycles
When commodity prices slip growers commonly trade down or delay inputs, and the 2022–24 fertilizer price drop of roughly 30% from peak levels amplified supplier discounting pressure; demonstrable ROI and resistance‑management data sustain premium pricing, while flexible pack sizes and farmer financing (crop‑linked credit) soften demand elasticity.
Availability of generics and off-patent options
Patent expiries in 2024 accelerated launches of generics, which now represent an estimated 30–40% of global agrochemical volumes, boosting buyer leverage as channel partners anchor negotiations on lower-cost off-patent alternatives. Manufacturers defend value with differentiated formulations and mixtures that sustain price premiums. Stewardship, warranty terms and agronomic service bundles further limit pure price comparisons by adding measurable service value.
Performance-critical, moderate switching
Performance is mission-critical in crop protection, so reckless switching is limited; demonstrated efficacy and local agronomic support keep churn low, while demo plots and multi-season field trials enable measured brand shifts across seasons. Proven performance data and label breadth/crop fit further reduce churn, with trial-driven adoption often concentrated in 1–2 seasons.
- Trials enable seasonal shifts
- Local support retains customers
- Label breadth reduces churn
Institutional and public buyers in non-ag
Institutional and public buyers such as municipalities and large facilities drive professional pest and turf demand, using formal tenders and strict compliance to raise documentation and pricing scrutiny. Multi-year contracts, commonly 3–5 years, can lock volumes at tight margins often in the 3–7% range. Certification, safety records and regulatory compliance materially affect award decisions.
- Buyers: municipalities, large facilities
- Tenders: strict documentation
- Contracts: 3–5 years
- Margins: 3–7%
- Deciders: certifications & safety
Top 3 control ~50%; generics and price drops cut margins to 3-7%
Channel concentration gives buyers strong leverage—top 3 US ag retailers control ~50% of crop‑input sales, forcing rebates and tighter payment terms. Fertilizer price declines (~30% 2022–24) and generics (30–40% of agrochemical volumes in 2024) increase switching pressure. Multi‑year institutional contracts (3–5 yrs) compress margins to ~3–7% while stewardship and local agronomy limit churn.
| Metric | 2024 Value |
|---|---|
| Top‑3 US retailer share | ~50% |
| Fertilizer price drop (2022–24) | ~30% |
| Generics share | 30–40% |
| Institutional contract margins | 3–7% |
Same Document Delivered
FMC Porter's Five Forces Analysis
This preview shows the exact FMC Porter's Five Forces Analysis you'll receive after purchase—fully formatted, professionally written, and ready to use. It contains the complete competitive assessment, key insights, and actionable implications. No mockups or placeholders; instant download upon payment.
Original: $10.00
-65%$10.00
$3.50Description
Elevate Your Analysis with the Complete Porter's Five Forces Analysis
FMC faces moderate supplier power, variable buyer concentration, and evolving substitute threats driven by innovation and regulation. Competitive rivalry and potential new entrants shape margins and strategic urgency across segments. This brief snapshot only scratches the surface—unlock the full Porter's Five Forces Analysis to explore FMC’s competitive dynamics, market pressures, and strategic advantages in detail.
Suppliers Bargaining Power
Concentrated specialty chemical inputs
Many key intermediates and reagents for FMC active ingredients come from a concentrated set of specialty chemical suppliers, and with the global specialty chemicals market estimated at about $700 billion in 2024 the few qualified sources command leverage on price and terms. Limited qualified alternatives raise switching costs and force FMC to dual‑source and invest in qualification to mitigate concentration risk. Any supplier disruption can delay production and product launches, impacting time‑to‑market and revenue timing.
High switching and qualification costs
Changing suppliers often requires 6–12 months of requalification, stability testing and regulatory notifications, with industry costs commonly cited in 2024 at $250k–$2M per SKU, making switches costly and slow. Suppliers exploit this friction to press for tougher pricing and terms, while long-term contracts and VMI programs materially reduce buyer exposure.
Regulatory and ESG constraints
Suppliers must comply with stringent REACH rules (over 20,000 registered substances) and TSCA (US inventory >85,000 chemicals) plus global HSE standards, which concentrates qualified vendors and raises input costs. ESG scrutiny on solvents, fluorinated compounds and waste handling further tightens supply. FMC uses supplier audits, development programs and contractual KPIs to preserve continuity.
Energy and logistics volatility pass-through
- 2024 Brent avg ~86 USD/bbl — energy-driven surcharges rose
- Indexed contracts + hedges cut volatility impact
- Nearshoring lowered freight exposure
Tolling and custom synthesis dependence
Reliance on specialized toll manufacturers for complex molecules concentrates supplier power, especially as many CDMOs reported capacity utilization above 80% in 2024, creating potential bottlenecks for scale-up.
Proprietary process know-how and single-supplier relationships can lock in specific tollers and raise switching costs, while collaborative joint process optimization programs have reduced yield losses by up to 10% in reported partnerships, rebalancing negotiating leverage.
- High capacity utilization: >80% (2024)
- Switching costs: proprietary know-how locks supply
- Mitigation: joint optimization can cut yield loss ≈10%
High supplier power: specialty chemicals ≈700B, requal 6–12m (250k–2M/SKU), CDMO util >80%
Supplier power is high: specialty chemical sourcing is concentrated (global specialty chemicals ≈700B USD in 2024), requalification takes 6–12 months and costs 250k–2M USD per SKU, and CDMO capacity utilization exceeded 80% in 2024, raising switching costs and bottleneck risk.
| Metric | 2024 |
|---|---|
| Specialty market | ≈700B USD |
| Requal cost/SKU | 250k–2M USD |
| CDMO util. | >80% |
| Brent avg | ≈86 USD/bbl |
What is included in the product
Detailed Word Document
Concise Porter's Five Forces analysis for FMC that uncovers competitive intensity, buyer and supplier bargaining power, threats from new entrants and substitutes, and identifies emerging disruptive forces with strategic commentary for investor and management use.
Customizable Excel Spreadsheet
One-sheet FMC Porter's Five Forces that quantifies competitive pressure across suppliers, buyers, entrants and substitutes—editable inputs, instant radar visualization and copy-ready layout to remove analysis bottlenecks.
Customers Bargaining Power
Large distributors and retailers consolidate demand
Ag channel partners aggregate farmer purchasing and negotiate volume rebates, with the top three US ag retailers controlling roughly 50% of the crop‑input market, amplifying price pressure and stricter payment-term demands. Co-marketing, promotional programs and slotting support are now table stakes for >90% of major accounts. FMC must tailor rebates, marketing funds and inventory incentives to retain shelf space and mindshare.
Farmer price sensitivity to crop cycles
When commodity prices slip growers commonly trade down or delay inputs, and the 2022–24 fertilizer price drop of roughly 30% from peak levels amplified supplier discounting pressure; demonstrable ROI and resistance‑management data sustain premium pricing, while flexible pack sizes and farmer financing (crop‑linked credit) soften demand elasticity.
Availability of generics and off-patent options
Patent expiries in 2024 accelerated launches of generics, which now represent an estimated 30–40% of global agrochemical volumes, boosting buyer leverage as channel partners anchor negotiations on lower-cost off-patent alternatives. Manufacturers defend value with differentiated formulations and mixtures that sustain price premiums. Stewardship, warranty terms and agronomic service bundles further limit pure price comparisons by adding measurable service value.
Performance-critical, moderate switching
Performance is mission-critical in crop protection, so reckless switching is limited; demonstrated efficacy and local agronomic support keep churn low, while demo plots and multi-season field trials enable measured brand shifts across seasons. Proven performance data and label breadth/crop fit further reduce churn, with trial-driven adoption often concentrated in 1–2 seasons.
- Trials enable seasonal shifts
- Local support retains customers
- Label breadth reduces churn
Institutional and public buyers in non-ag
Institutional and public buyers such as municipalities and large facilities drive professional pest and turf demand, using formal tenders and strict compliance to raise documentation and pricing scrutiny. Multi-year contracts, commonly 3–5 years, can lock volumes at tight margins often in the 3–7% range. Certification, safety records and regulatory compliance materially affect award decisions.
- Buyers: municipalities, large facilities
- Tenders: strict documentation
- Contracts: 3–5 years
- Margins: 3–7%
- Deciders: certifications & safety
Top 3 control ~50%; generics and price drops cut margins to 3-7%
Channel concentration gives buyers strong leverage—top 3 US ag retailers control ~50% of crop‑input sales, forcing rebates and tighter payment terms. Fertilizer price declines (~30% 2022–24) and generics (30–40% of agrochemical volumes in 2024) increase switching pressure. Multi‑year institutional contracts (3–5 yrs) compress margins to ~3–7% while stewardship and local agronomy limit churn.
| Metric | 2024 Value |
|---|---|
| Top‑3 US retailer share | ~50% |
| Fertilizer price drop (2022–24) | ~30% |
| Generics share | 30–40% |
| Institutional contract margins | 3–7% |
Same Document Delivered
FMC Porter's Five Forces Analysis
This preview shows the exact FMC Porter's Five Forces Analysis you'll receive after purchase—fully formatted, professionally written, and ready to use. It contains the complete competitive assessment, key insights, and actionable implications. No mockups or placeholders; instant download upon payment.











