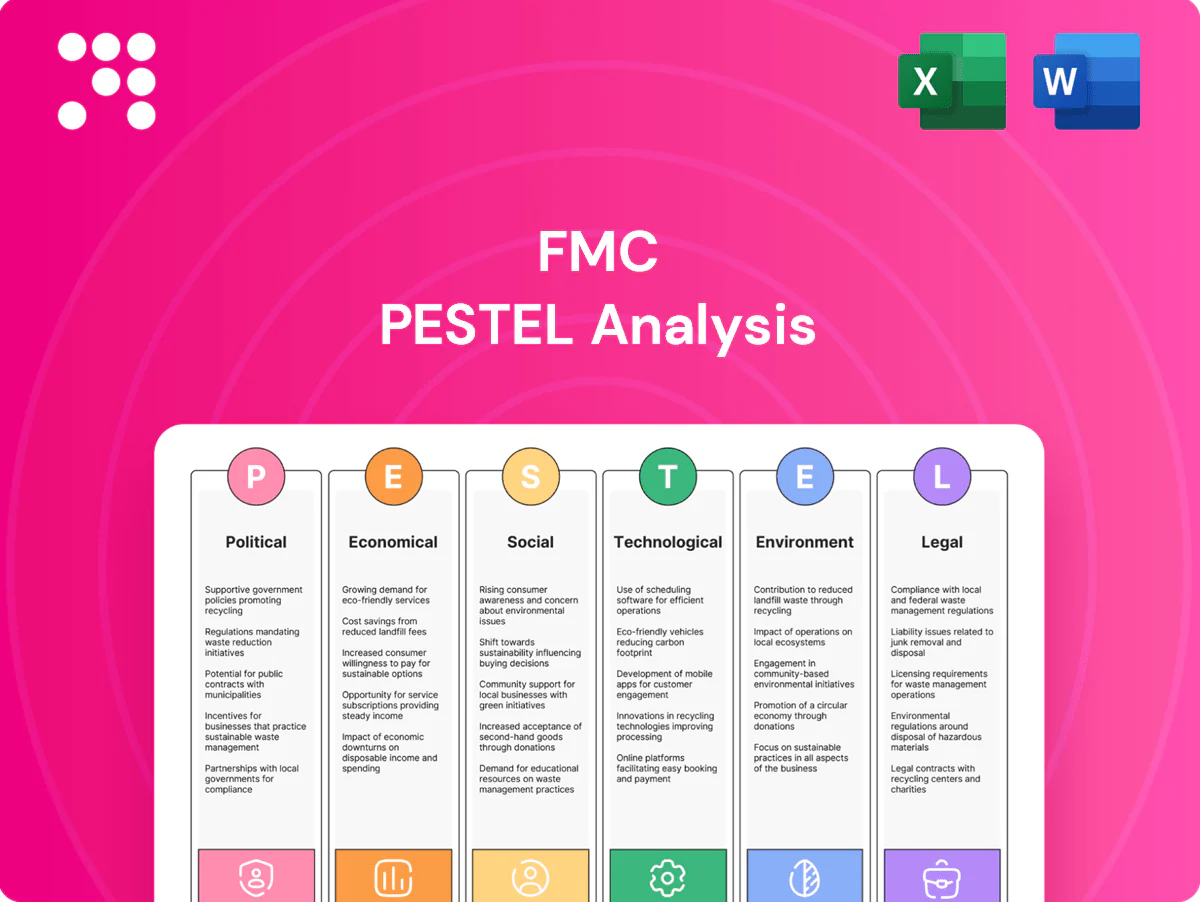
FMC PESTLE Analysis

Plan Smarter. Present Sharper. Compete Stronger.
Discover how political shifts, economic cycles, social trends, and technological change shape FMC’s strategic outlook in our concise PESTLE snapshot. This expert-led briefing highlights key risks and opportunities you can act on now. Purchase the full PESTLE for the complete, downloadable analysis and ready-to-use insights.
Political factors

Ag-chem policy shifts
National priorities on food security and rural development drive subsidies, pesticide approvals and stewardship mandates, influencing market access in countries where the global crop protection market was about USD 66 billion in 2024. Sudden post-election shifts have accelerated or stalled launches, requiring FMC (FY2024 revenue ~USD 6.4 billion) to adapt timelines. FMC must engage in active policy advocacy and scenario-plan for divergent regimes. Regional diversification reduces single-country policy exposure.
Trade tariffs and geopolitics
Tariffs on chemical intermediates and finished products, notably US Section 301 duties ranging 7.5–25%, reshape FMC’s cost base and pricing power. Export controls and sanctions since 2020 (Russia/Belarus disruptions; ~40% of global potash exports) have shown how sourcing or sales can be halted. FMC requires flexible supply chains, alternate suppliers, contractual hedges and contingency sourcing to mitigate diplomatic delays in regulatory cooperation and data recognition.

Public procurement and extension
Government extension services and public tenders drive adoption in developing markets, with extension programs reaching an estimated 20–30% of smallholders in parts of Sub-Saharan Africa in 2024 and public agri-input tenders exceeding $1.5 billion annually in select markets. Inclusion on ministry recommended lists can boost volumes by 30–50% and adds legitimacy. FMC should strengthen ties with agriculture ministries, demonstrate field efficacy through trials, and adopt transparent pricing and stewardship to improve program access.

Regional registration regimes
EU, US, Brazil, India and China operate five distinct registration regimes requiring FMC to tailor dossiers to divergent hazard- versus risk-based frameworks; political debates increasingly push some markets toward hazard-based limits while others keep risk-based approvals. FMC must align data formats and timelines per regime and use consolidated trial programs plus local partnerships to accelerate market acceptance.
- 5 regimes
- hazard vs risk pressure
- dossiers per standard/timeline
- consolidated trials + local partners = faster acceptance
Political stability and security
- 2024–25: regional unrest disrupts logistics
- Field trials/support hindered by security
- Mitigation: insurance, buffers, distributor diversification
- Essential: business continuity plans in high-risk markets
Flexible supply chains, advocacy, local trials and buffers secure access to USD 66bn crop market
National food-security priorities, tariffs (US Section 301: 7.5–25%), five divergent registration regimes and 2024–25 regional unrest (logistics/trials disrupted) force FMC (FY2024 revenue ~USD 6.4bn) to maintain flexible supply chains, active advocacy, local trial partnerships and contingency buffers to protect access to a ~USD 66bn global crop-protection market.
| Metric | 2024–25 |
|---|---|
| Global market | USD 66bn |
| FMC revenue | USD 6.4bn |
| Section 301 duties | 7.5–25% |
| Public tenders | >USD 1.5bn |
| Registration regimes | 5 |
What is included in the product
 Detailed Word Document
Explores how macro-environmental forces uniquely affect the FMC across Political, Economic, Social, Technological, Environmental, and Legal dimensions, with data-backed trends, sector-specific examples, forward-looking insights for scenario planning, and practical guidance for executives, investors, and strategists to identify risks and opportunities.

 Customizable Excel Spreadsheet
A concise, visually segmented FMC PESTLE summary that’s easily editable and shareable for meetings, enabling quick alignment on external risks, regulatory shifts, and market positioning—drop-ready for decks, strategy folders, or client reports.
Economic factors

Farm income cycles
Crop prices, yields and input costs directly determine growers’ purchasing power: USDA data showed US net farm income around $151.9 billion in 2023 and USDA projected a decline toward roughly $139 billion in 2024, tightening budgets.
High commodity prices historically boost premium product uptake and full-program adoption; during downcycles farmers shift to generics and cut volumes.
FMC should tier offerings and expand financing and deferred-pay programs to smooth these cycles and protect market share.
FX and inflation pressures
Weak local currencies in 2024 pushed import costs for farmers and FMC inputs higher—emerging market currencies fell roughly 8–15% vs USD, raising input bills by double digits in many markets. Inflation (often 5–12% in 2024 across key markets) increased wages, logistics and solvent/feedstock prices. Price-escalators and local production proved effective margin shields, while FX hedging and dynamic pricing became critical to manage volatile currencies.

Credit availability
Access to agricultural credit governs timing and size of farmer purchases; tight credit cycles delay applications and shrink basket sizes, exacerbating seasonal shortfalls. With a developing-country agri-financing gap around $170 billion, FMCs can partner banks or offer input finance to sustain demand. Robust credit-risk management and strict receivables discipline are pivotal to contain portfolio losses.

Input cost volatility
Petrochemical and specialty intermediate prices remain cyclical; peak tightness phases have historically pushed input costs up 10–25%, squeezing FMC-level gross margins in comparable cycles.
Long-term contracts and dual sourcing have reduced volatility pass-through, while process efficiency and yield gains (2–5% annual improvement targets) offset short-term cost spikes.
- COGS impact: +10–25%
- Yield gains: 2–5%/yr
- Mitigants: long-term contracts, dual sourcing
Market consolidation
Distributor and retailer consolidation concentrates purchasing, raising buyer power and pressuring margins; global crop protection market was about US$75bn in 2023. Large growers now demand integrated solutions and higher service levels. FMC can defend pricing via portfolio breadth and digital decision tools while alliances extend reach in fragmented regions.
- Distributor consolidation: higher buyer power
- Large growers: demand integrated solutions & SLAs
- FMC defense: portfolio breadth + digital tools
- Alliances: expand reach in fragmented markets
Flexible supply chains, advocacy, local trials and buffers secure access to USD 66bn crop market
Crop prices, yields and input costs drive farmer purchasing power: US net farm income was $151.9B in 2023, projected ~$139B in 2024, tightening budgets. Commodity cycles and petrochemical swings can raise COGS 10–25%, while yield gains of 2–5%/yr and long-term contracts mitigate impact. Emerging-market currencies fell ~8–15% vs USD in 2024 and agri-financing gap is ~$170B, raising need for input finance. Distributor consolidation (global crop protection ~$75B in 2023) increases buyer power, pushing FMCs toward portfolio breadth and digital services.
| Metric | Value |
|---|---|
| US net farm income (2023) | $151.9B |
| Proj (2024) | $~139B |
| Crop protection market (2023) | $75B |
| FX hit EMs (2024) | −8–15% |
| Agri-financing gap | $170B |
Preview Before You Purchase
FMC PESTLE Analysis
The FMC PESTLE Analysis offers a concise, actionable review of political, economic, social, technological, legal, and environmental factors affecting FMC. The preview shown here is the exact document you’ll receive after purchase—fully formatted and ready to use. It includes clear visuals and strategic implications to support decision-making and is downloadable immediately after checkout.

Plan Smarter. Present Sharper. Compete Stronger.
Discover how political shifts, economic cycles, social trends, and technological change shape FMC’s strategic outlook in our concise PESTLE snapshot. This expert-led briefing highlights key risks and opportunities you can act on now. Purchase the full PESTLE for the complete, downloadable analysis and ready-to-use insights.
Political factors
Ag-chem policy shifts
National priorities on food security and rural development drive subsidies, pesticide approvals and stewardship mandates, influencing market access in countries where the global crop protection market was about USD 66 billion in 2024. Sudden post-election shifts have accelerated or stalled launches, requiring FMC (FY2024 revenue ~USD 6.4 billion) to adapt timelines. FMC must engage in active policy advocacy and scenario-plan for divergent regimes. Regional diversification reduces single-country policy exposure.
Trade tariffs and geopolitics
Tariffs on chemical intermediates and finished products, notably US Section 301 duties ranging 7.5–25%, reshape FMC’s cost base and pricing power. Export controls and sanctions since 2020 (Russia/Belarus disruptions; ~40% of global potash exports) have shown how sourcing or sales can be halted. FMC requires flexible supply chains, alternate suppliers, contractual hedges and contingency sourcing to mitigate diplomatic delays in regulatory cooperation and data recognition.
Public procurement and extension
Government extension services and public tenders drive adoption in developing markets, with extension programs reaching an estimated 20–30% of smallholders in parts of Sub-Saharan Africa in 2024 and public agri-input tenders exceeding $1.5 billion annually in select markets. Inclusion on ministry recommended lists can boost volumes by 30–50% and adds legitimacy. FMC should strengthen ties with agriculture ministries, demonstrate field efficacy through trials, and adopt transparent pricing and stewardship to improve program access.
Regional registration regimes
EU, US, Brazil, India and China operate five distinct registration regimes requiring FMC to tailor dossiers to divergent hazard- versus risk-based frameworks; political debates increasingly push some markets toward hazard-based limits while others keep risk-based approvals. FMC must align data formats and timelines per regime and use consolidated trial programs plus local partnerships to accelerate market acceptance.
- 5 regimes
- hazard vs risk pressure
- dossiers per standard/timeline
- consolidated trials + local partners = faster acceptance
Political stability and security
- 2024–25: regional unrest disrupts logistics
- Field trials/support hindered by security
- Mitigation: insurance, buffers, distributor diversification
- Essential: business continuity plans in high-risk markets
Flexible supply chains, advocacy, local trials and buffers secure access to USD 66bn crop market
National food-security priorities, tariffs (US Section 301: 7.5–25%), five divergent registration regimes and 2024–25 regional unrest (logistics/trials disrupted) force FMC (FY2024 revenue ~USD 6.4bn) to maintain flexible supply chains, active advocacy, local trial partnerships and contingency buffers to protect access to a ~USD 66bn global crop-protection market.
| Metric | 2024–25 |
|---|---|
| Global market | USD 66bn |
| FMC revenue | USD 6.4bn |
| Section 301 duties | 7.5–25% |
| Public tenders | >USD 1.5bn |
| Registration regimes | 5 |
What is included in the product
Detailed Word Document
Explores how macro-environmental forces uniquely affect the FMC across Political, Economic, Social, Technological, Environmental, and Legal dimensions, with data-backed trends, sector-specific examples, forward-looking insights for scenario planning, and practical guidance for executives, investors, and strategists to identify risks and opportunities.
Customizable Excel Spreadsheet
A concise, visually segmented FMC PESTLE summary that’s easily editable and shareable for meetings, enabling quick alignment on external risks, regulatory shifts, and market positioning—drop-ready for decks, strategy folders, or client reports.
Economic factors
Farm income cycles
Crop prices, yields and input costs directly determine growers’ purchasing power: USDA data showed US net farm income around $151.9 billion in 2023 and USDA projected a decline toward roughly $139 billion in 2024, tightening budgets.
High commodity prices historically boost premium product uptake and full-program adoption; during downcycles farmers shift to generics and cut volumes.
FMC should tier offerings and expand financing and deferred-pay programs to smooth these cycles and protect market share.
FX and inflation pressures
Weak local currencies in 2024 pushed import costs for farmers and FMC inputs higher—emerging market currencies fell roughly 8–15% vs USD, raising input bills by double digits in many markets. Inflation (often 5–12% in 2024 across key markets) increased wages, logistics and solvent/feedstock prices. Price-escalators and local production proved effective margin shields, while FX hedging and dynamic pricing became critical to manage volatile currencies.
Credit availability
Access to agricultural credit governs timing and size of farmer purchases; tight credit cycles delay applications and shrink basket sizes, exacerbating seasonal shortfalls. With a developing-country agri-financing gap around $170 billion, FMCs can partner banks or offer input finance to sustain demand. Robust credit-risk management and strict receivables discipline are pivotal to contain portfolio losses.
Input cost volatility
Petrochemical and specialty intermediate prices remain cyclical; peak tightness phases have historically pushed input costs up 10–25%, squeezing FMC-level gross margins in comparable cycles.
Long-term contracts and dual sourcing have reduced volatility pass-through, while process efficiency and yield gains (2–5% annual improvement targets) offset short-term cost spikes.
- COGS impact: +10–25%
- Yield gains: 2–5%/yr
- Mitigants: long-term contracts, dual sourcing
Market consolidation
Distributor and retailer consolidation concentrates purchasing, raising buyer power and pressuring margins; global crop protection market was about US$75bn in 2023. Large growers now demand integrated solutions and higher service levels. FMC can defend pricing via portfolio breadth and digital decision tools while alliances extend reach in fragmented regions.
- Distributor consolidation: higher buyer power
- Large growers: demand integrated solutions & SLAs
- FMC defense: portfolio breadth + digital tools
- Alliances: expand reach in fragmented markets
Flexible supply chains, advocacy, local trials and buffers secure access to USD 66bn crop market
Crop prices, yields and input costs drive farmer purchasing power: US net farm income was $151.9B in 2023, projected ~$139B in 2024, tightening budgets. Commodity cycles and petrochemical swings can raise COGS 10–25%, while yield gains of 2–5%/yr and long-term contracts mitigate impact. Emerging-market currencies fell ~8–15% vs USD in 2024 and agri-financing gap is ~$170B, raising need for input finance. Distributor consolidation (global crop protection ~$75B in 2023) increases buyer power, pushing FMCs toward portfolio breadth and digital services.
| Metric | Value |
|---|---|
| US net farm income (2023) | $151.9B |
| Proj (2024) | $~139B |
| Crop protection market (2023) | $75B |
| FX hit EMs (2024) | −8–15% |
| Agri-financing gap | $170B |
Preview Before You Purchase
FMC PESTLE Analysis
The FMC PESTLE Analysis offers a concise, actionable review of political, economic, social, technological, legal, and environmental factors affecting FMC. The preview shown here is the exact document you’ll receive after purchase—fully formatted and ready to use. It includes clear visuals and strategic implications to support decision-making and is downloadable immediately after checkout.
Description
Plan Smarter. Present Sharper. Compete Stronger.
Discover how political shifts, economic cycles, social trends, and technological change shape FMC’s strategic outlook in our concise PESTLE snapshot. This expert-led briefing highlights key risks and opportunities you can act on now. Purchase the full PESTLE for the complete, downloadable analysis and ready-to-use insights.
Political factors
Ag-chem policy shifts
National priorities on food security and rural development drive subsidies, pesticide approvals and stewardship mandates, influencing market access in countries where the global crop protection market was about USD 66 billion in 2024. Sudden post-election shifts have accelerated or stalled launches, requiring FMC (FY2024 revenue ~USD 6.4 billion) to adapt timelines. FMC must engage in active policy advocacy and scenario-plan for divergent regimes. Regional diversification reduces single-country policy exposure.
Trade tariffs and geopolitics
Tariffs on chemical intermediates and finished products, notably US Section 301 duties ranging 7.5–25%, reshape FMC’s cost base and pricing power. Export controls and sanctions since 2020 (Russia/Belarus disruptions; ~40% of global potash exports) have shown how sourcing or sales can be halted. FMC requires flexible supply chains, alternate suppliers, contractual hedges and contingency sourcing to mitigate diplomatic delays in regulatory cooperation and data recognition.
Public procurement and extension
Government extension services and public tenders drive adoption in developing markets, with extension programs reaching an estimated 20–30% of smallholders in parts of Sub-Saharan Africa in 2024 and public agri-input tenders exceeding $1.5 billion annually in select markets. Inclusion on ministry recommended lists can boost volumes by 30–50% and adds legitimacy. FMC should strengthen ties with agriculture ministries, demonstrate field efficacy through trials, and adopt transparent pricing and stewardship to improve program access.
Regional registration regimes
EU, US, Brazil, India and China operate five distinct registration regimes requiring FMC to tailor dossiers to divergent hazard- versus risk-based frameworks; political debates increasingly push some markets toward hazard-based limits while others keep risk-based approvals. FMC must align data formats and timelines per regime and use consolidated trial programs plus local partnerships to accelerate market acceptance.
- 5 regimes
- hazard vs risk pressure
- dossiers per standard/timeline
- consolidated trials + local partners = faster acceptance
Political stability and security
- 2024–25: regional unrest disrupts logistics
- Field trials/support hindered by security
- Mitigation: insurance, buffers, distributor diversification
- Essential: business continuity plans in high-risk markets
Flexible supply chains, advocacy, local trials and buffers secure access to USD 66bn crop market
National food-security priorities, tariffs (US Section 301: 7.5–25%), five divergent registration regimes and 2024–25 regional unrest (logistics/trials disrupted) force FMC (FY2024 revenue ~USD 6.4bn) to maintain flexible supply chains, active advocacy, local trial partnerships and contingency buffers to protect access to a ~USD 66bn global crop-protection market.
| Metric | 2024–25 |
|---|---|
| Global market | USD 66bn |
| FMC revenue | USD 6.4bn |
| Section 301 duties | 7.5–25% |
| Public tenders | >USD 1.5bn |
| Registration regimes | 5 |
What is included in the product
Detailed Word Document
Explores how macro-environmental forces uniquely affect the FMC across Political, Economic, Social, Technological, Environmental, and Legal dimensions, with data-backed trends, sector-specific examples, forward-looking insights for scenario planning, and practical guidance for executives, investors, and strategists to identify risks and opportunities.
Customizable Excel Spreadsheet
A concise, visually segmented FMC PESTLE summary that’s easily editable and shareable for meetings, enabling quick alignment on external risks, regulatory shifts, and market positioning—drop-ready for decks, strategy folders, or client reports.
Economic factors
Farm income cycles
Crop prices, yields and input costs directly determine growers’ purchasing power: USDA data showed US net farm income around $151.9 billion in 2023 and USDA projected a decline toward roughly $139 billion in 2024, tightening budgets.
High commodity prices historically boost premium product uptake and full-program adoption; during downcycles farmers shift to generics and cut volumes.
FMC should tier offerings and expand financing and deferred-pay programs to smooth these cycles and protect market share.
FX and inflation pressures
Weak local currencies in 2024 pushed import costs for farmers and FMC inputs higher—emerging market currencies fell roughly 8–15% vs USD, raising input bills by double digits in many markets. Inflation (often 5–12% in 2024 across key markets) increased wages, logistics and solvent/feedstock prices. Price-escalators and local production proved effective margin shields, while FX hedging and dynamic pricing became critical to manage volatile currencies.
Credit availability
Access to agricultural credit governs timing and size of farmer purchases; tight credit cycles delay applications and shrink basket sizes, exacerbating seasonal shortfalls. With a developing-country agri-financing gap around $170 billion, FMCs can partner banks or offer input finance to sustain demand. Robust credit-risk management and strict receivables discipline are pivotal to contain portfolio losses.
Input cost volatility
Petrochemical and specialty intermediate prices remain cyclical; peak tightness phases have historically pushed input costs up 10–25%, squeezing FMC-level gross margins in comparable cycles.
Long-term contracts and dual sourcing have reduced volatility pass-through, while process efficiency and yield gains (2–5% annual improvement targets) offset short-term cost spikes.
- COGS impact: +10–25%
- Yield gains: 2–5%/yr
- Mitigants: long-term contracts, dual sourcing
Market consolidation
Distributor and retailer consolidation concentrates purchasing, raising buyer power and pressuring margins; global crop protection market was about US$75bn in 2023. Large growers now demand integrated solutions and higher service levels. FMC can defend pricing via portfolio breadth and digital decision tools while alliances extend reach in fragmented regions.
- Distributor consolidation: higher buyer power
- Large growers: demand integrated solutions & SLAs
- FMC defense: portfolio breadth + digital tools
- Alliances: expand reach in fragmented markets
Flexible supply chains, advocacy, local trials and buffers secure access to USD 66bn crop market
Crop prices, yields and input costs drive farmer purchasing power: US net farm income was $151.9B in 2023, projected ~$139B in 2024, tightening budgets. Commodity cycles and petrochemical swings can raise COGS 10–25%, while yield gains of 2–5%/yr and long-term contracts mitigate impact. Emerging-market currencies fell ~8–15% vs USD in 2024 and agri-financing gap is ~$170B, raising need for input finance. Distributor consolidation (global crop protection ~$75B in 2023) increases buyer power, pushing FMCs toward portfolio breadth and digital services.
| Metric | Value |
|---|---|
| US net farm income (2023) | $151.9B |
| Proj (2024) | $~139B |
| Crop protection market (2023) | $75B |
| FX hit EMs (2024) | −8–15% |
| Agri-financing gap | $170B |
Preview Before You Purchase
FMC PESTLE Analysis
The FMC PESTLE Analysis offers a concise, actionable review of political, economic, social, technological, legal, and environmental factors affecting FMC. The preview shown here is the exact document you’ll receive after purchase—fully formatted and ready to use. It includes clear visuals and strategic implications to support decision-making and is downloadable immediately after checkout.











