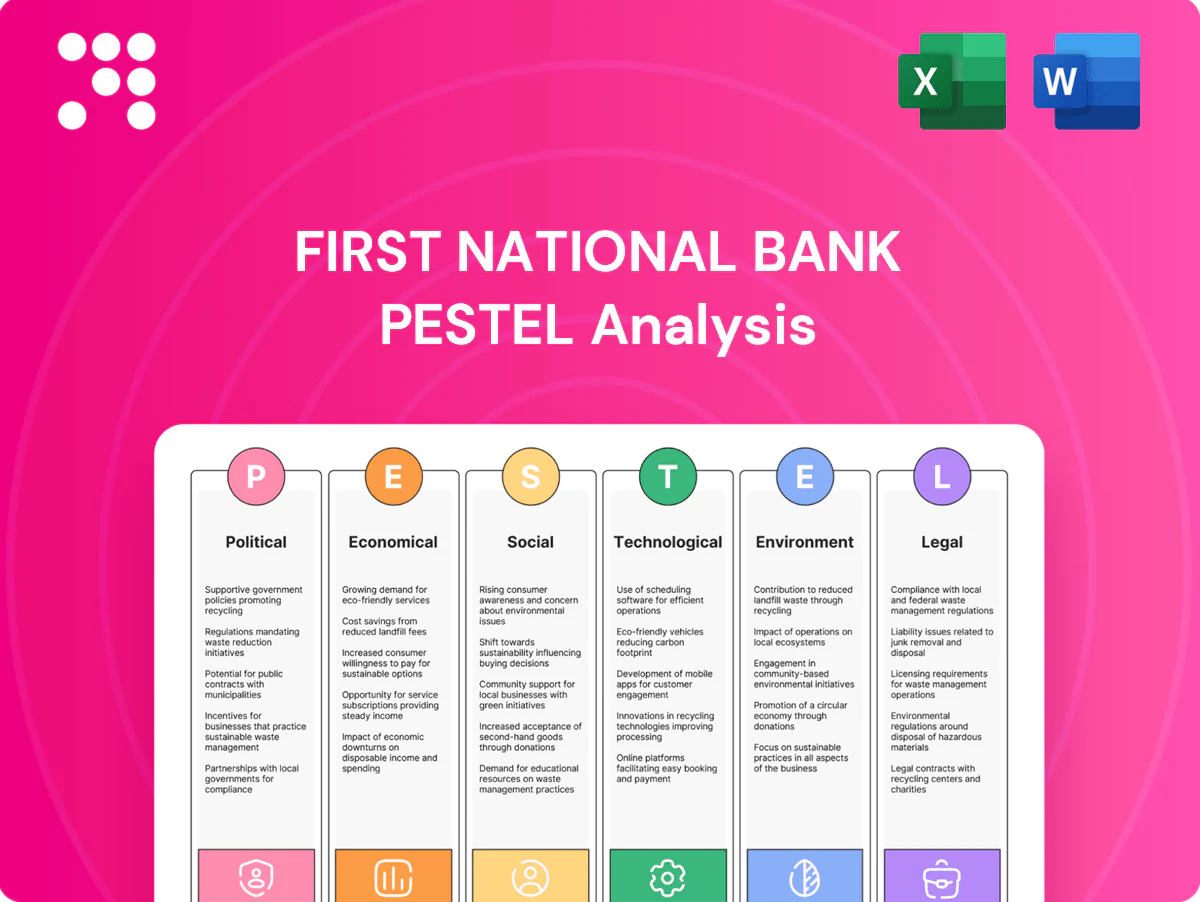
First National Bank PESTLE Analysis

Make Smarter Strategic Decisions with a Complete PESTEL View
Gain a competitive edge with our PESTLE Analysis of First National Bank—three concise sections revealing how political, economic, social, technological, legal, and environmental forces shape strategy and risk. Ideal for investors, advisors, and executives, it translates trends into actionable recommendations. Purchase the full report to access the complete, editable analysis and make informed decisions faster.
Political factors

Regulatory policy volatility
Shifts in U.S. banking policy and leadership at the Federal Reserve, FDIC, OCC and CFPB can alter compliance expectations and capital planning; the Fed funds target of about 5.25–5.50% (mid‑2025) sharpens capital cost pressures. Political focus on consumer protection and oversight pushes banks toward higher CET1 buffers (commonly 8–12% versus the 4.5% minimum) and redesign of fee/product structures. F.N.B. must adapt swiftly and proactively engage regulators to reduce disruption risk.
Fiscal policy and public spending
Federal infrastructure funding, notably the 2021 IIJA which delivers roughly 550 billion dollars in new investment, boosts loan demand and fee income for First National Bank across Mid‑Atlantic and Southeastern markets. Government incentives and SBA programs in 2024 continued to catalyze small‑business lending and public finance opportunities, while the US municipal bond market—about 4.2 trillion outstanding in 2024—remains a key funding source. Budget constraints or federal/state shutdowns can abruptly slow pipelines, so targeted regional coverage improves capture of funded projects.

Community development priorities
Political emphasis on affordable housing and small-business support expands CRA-related opportunities; aligning F.N.B. lending to these priorities can tap growing demand in lower‑income markets where U.S. affordable housing shortfalls exceed millions of units.
By directing community development loans and investments toward local priorities, F.N.B. strengthens stakeholder goodwill and keeps its ~500-branch network relevant in diverse communities.
Such alignment also reduces reputational exposure and lowers exam risk under evolving CRA expectations and regulatory scrutiny.

Interstate banking climate
State political dynamics shape First National Bank branch rationalization, charters and market entry through varying licensing and community reinvestment expectations; Riegle‑Neal era interstate rules remain the legal backbone. Variations in state incentives and tax regimes drive footprint optimization across jurisdictions. Coordinated government relations teams help navigate local permitting and CRA expectations. Consistency across Mid‑Atlantic and Southeast supports scalable expansion; there were about 4,600 FDIC‑insured institutions in mid‑2024.
- State licensing and CRA rules
- Incentives/tax differentials
- Government relations coordination
- Mid‑Atlantic/Southeast scalability; ~4,600 FDIC institutions (mid‑2024)
Cybersecurity and critical infrastructure policy
Rising federal and state focus on financial infrastructure resilience forces First National Bank to harden systems and document preparedness; the SEC cyber incident rule (finalized 2023) tightened reporting to four business days, and state-level directives now mandate faster timelines and joint sector exercises. Compliance improves market trust but is raising operating costs and capital expenditure on defenses, making cyber investment a clear political and supervisory imperative.
- SEC rule: 4 business-day incident reporting
- Higher compliance costs impacting ROE
- Mandatory sector exercises and state mandates increasing
Fed 5.25–5.50%, SEC rule up costs; $4.2T munis boost lending
Federal policy and regulator focus (Fed funds ~5.25–5.50% mid‑2025; SEC 4‑business‑day breach rule) raise capital and compliance costs, pressuring ROE. IIJA ~$550bn and a $4.2tn muni market (mid‑2024) boost regional lending; ~500 branches support capture. State licensing/tax differences and ~4,600 FDIC banks (mid‑2024) shape footprint strategy.
| Factor | Impact |
|---|---|
| Rates/Regulation | Higher capital & compliance costs |
| Infrastructure/Munis | Loan/fee growth |
What is included in the product
 Detailed Word Document
Explores how Political, Economic, Social, Technological, Environmental, and Legal forces uniquely impact First National Bank, using current data and regional regulatory context to identify risks and opportunities. Designed for executives and advisors, the analysis offers detailed sub-points and forward-looking insights to support scenario planning, strategy, and investor communications.

 Customizable Excel Spreadsheet
A concise, visually segmented PESTLE summary for First National Bank that simplifies external risk assessment for meetings and planning, is editable for regional or business-line notes, and can be dropped into presentations or shared quickly across teams.
Economic factors

Interest rate cycle sensitivity
Net interest margin for First National Bank is highly sensitive to Federal Reserve policy and curve shape; with the fed funds target near 5.25–5.50% in mid‑2025 and aggregate US bank NIM around 3.0% in 2024, curve shifts materially affect spreads. Rapid hikes or cuts can push deposit betas toward 30–50%, alter asset yields and raise hedging costs. Active balance‑sheet management—duration, liabilities mix and loan pricing—helps protect spread compression. In late‑cycle phases, pricing discipline and loan/deposit mix drive margin outcomes.
Regional growth and employment
Mid‑Atlantic economic stability and Southeast in‑migration (regional pop. gains ~0.8% in 2024) support diversified loan demand for F.N.B., boosting mortgage and C&I originations while keeping deposit growth steady. Labor markets remain tight (US unemployment ~3.7% in 2024–25), which underpins consumer spend but influences credit quality through wage and rehiring cycles. F.N.B. benefits from sectoral breadth across retail, energy and services yet must monitor cyclicals, while localized underwriting and branch-level credit oversight limit downside.

Credit quality and borrower resilience
Small business, CRE and consumer credit at First National Bank remain sensitive to cash flows and the federal funds rate, which stood near 5.25–5.50% in 2024–2025. Stress in office CRE—US office vacancy around 17% in 2024—plus leveraged CRE segments can raise loan loss provisions. Early warning analytics and tighter covenant enforcement have reduced loss severity. Geographic diversification smooths regional volatility and credit concentration risk.

Deposit competition and funding mix
Disintermediation to money market funds, whose assets topped $5 trillion in 2024 (ICI), has pressured deposit growth and increased funding costs for First National Bank as customers seek higher yields.
Relationship primacy and expanded treasury services strengthen operating-deposit stickiness; terming and wholesale backstops provide liquidity flexibility but exert downward pressure on NIM, while granular pricing and loyalty programs have reduced retail runoff.
- Higher MMF flows: >$5T (2024, ICI)
- Relationship/tax & treasury services: retain operating deposits
- Terming/wholesale: liquidity vs NIM trade-off
- Granular pricing & loyalty: curb runoff
Housing market dynamics
Affordability, tight inventory and higher mortgage rates steer First National Bank’s residential lending and fee mix; 30-year fixed averaged about 6.9% (Freddie Mac, June 2025). Home equity utilization rises as purchase volumes slow—Case‑Shiller 20‑city index +3.0% YoY (Apr 2025) while existing‑home sales fell ~4% YoY (NAR, May 2025). Construction trends (single‑family starts +5% YoY, Apr 2025, U.S. Census) shape CRE pipelines; balanced exposure mitigates cyclicality.
- Mortgage rate: 30y ~6.9% (Freddie Mac, Jun 2025)
- Inventory: months supply ~2.5 (NAR, May 2025)
- Prices: Case‑Shiller 20-city +3.0% YoY (Apr 2025)
- Starts: single‑family +5% YoY (Apr 2025, Census)
Fed 5.25–5.50%, SEC rule up costs; $4.2T munis boost lending
Fed policy (fed funds ~5.25–5.50% mid‑2025) and curve shifts drive NIM sensitivity (US bank NIM ~3.0% in 2024). Deposit flows to MMFs (> $5T in 2024) raise funding costs while tight labor (unemployment ~3.7% 2024–25) supports loan demand. Housing/mortgage stress (30y ~6.9% Jun 2025) and 17% office vacancy elevate CRE risk.
| Metric | Value |
|---|---|
| Fed funds | 5.25–5.50% (mid‑2025) |
| Bank NIM | ~3.0% (2024) |
| MMF assets | >$5T (2024) |
| Unemployment | ~3.7% (2024–25) |
| 30y mortgage | ~6.9% (Jun 2025) |
| Office vacancy | ~17% (2024) |
What You See Is What You Get
First National Bank PESTLE Analysis
The preview shown here is the exact First National Bank PESTLE Analysis you’ll receive after purchase—fully formatted and ready to use. It covers Political, Economic, Social, Technological, Legal and Environmental factors with charts and actionable insights. No placeholders or teasers—this is the final, downloaded file. Instant delivery of the document as displayed.

Make Smarter Strategic Decisions with a Complete PESTEL View
Gain a competitive edge with our PESTLE Analysis of First National Bank—three concise sections revealing how political, economic, social, technological, legal, and environmental forces shape strategy and risk. Ideal for investors, advisors, and executives, it translates trends into actionable recommendations. Purchase the full report to access the complete, editable analysis and make informed decisions faster.
Political factors
Regulatory policy volatility
Shifts in U.S. banking policy and leadership at the Federal Reserve, FDIC, OCC and CFPB can alter compliance expectations and capital planning; the Fed funds target of about 5.25–5.50% (mid‑2025) sharpens capital cost pressures. Political focus on consumer protection and oversight pushes banks toward higher CET1 buffers (commonly 8–12% versus the 4.5% minimum) and redesign of fee/product structures. F.N.B. must adapt swiftly and proactively engage regulators to reduce disruption risk.
Fiscal policy and public spending
Federal infrastructure funding, notably the 2021 IIJA which delivers roughly 550 billion dollars in new investment, boosts loan demand and fee income for First National Bank across Mid‑Atlantic and Southeastern markets. Government incentives and SBA programs in 2024 continued to catalyze small‑business lending and public finance opportunities, while the US municipal bond market—about 4.2 trillion outstanding in 2024—remains a key funding source. Budget constraints or federal/state shutdowns can abruptly slow pipelines, so targeted regional coverage improves capture of funded projects.
Community development priorities
Political emphasis on affordable housing and small-business support expands CRA-related opportunities; aligning F.N.B. lending to these priorities can tap growing demand in lower‑income markets where U.S. affordable housing shortfalls exceed millions of units.
By directing community development loans and investments toward local priorities, F.N.B. strengthens stakeholder goodwill and keeps its ~500-branch network relevant in diverse communities.
Such alignment also reduces reputational exposure and lowers exam risk under evolving CRA expectations and regulatory scrutiny.
Interstate banking climate
State political dynamics shape First National Bank branch rationalization, charters and market entry through varying licensing and community reinvestment expectations; Riegle‑Neal era interstate rules remain the legal backbone. Variations in state incentives and tax regimes drive footprint optimization across jurisdictions. Coordinated government relations teams help navigate local permitting and CRA expectations. Consistency across Mid‑Atlantic and Southeast supports scalable expansion; there were about 4,600 FDIC‑insured institutions in mid‑2024.
- State licensing and CRA rules
- Incentives/tax differentials
- Government relations coordination
- Mid‑Atlantic/Southeast scalability; ~4,600 FDIC institutions (mid‑2024)
Cybersecurity and critical infrastructure policy
Rising federal and state focus on financial infrastructure resilience forces First National Bank to harden systems and document preparedness; the SEC cyber incident rule (finalized 2023) tightened reporting to four business days, and state-level directives now mandate faster timelines and joint sector exercises. Compliance improves market trust but is raising operating costs and capital expenditure on defenses, making cyber investment a clear political and supervisory imperative.
- SEC rule: 4 business-day incident reporting
- Higher compliance costs impacting ROE
- Mandatory sector exercises and state mandates increasing
Fed 5.25–5.50%, SEC rule up costs; $4.2T munis boost lending
Federal policy and regulator focus (Fed funds ~5.25–5.50% mid‑2025; SEC 4‑business‑day breach rule) raise capital and compliance costs, pressuring ROE. IIJA ~$550bn and a $4.2tn muni market (mid‑2024) boost regional lending; ~500 branches support capture. State licensing/tax differences and ~4,600 FDIC banks (mid‑2024) shape footprint strategy.
| Factor | Impact |
|---|---|
| Rates/Regulation | Higher capital & compliance costs |
| Infrastructure/Munis | Loan/fee growth |
What is included in the product
Detailed Word Document
Explores how Political, Economic, Social, Technological, Environmental, and Legal forces uniquely impact First National Bank, using current data and regional regulatory context to identify risks and opportunities. Designed for executives and advisors, the analysis offers detailed sub-points and forward-looking insights to support scenario planning, strategy, and investor communications.
Customizable Excel Spreadsheet
A concise, visually segmented PESTLE summary for First National Bank that simplifies external risk assessment for meetings and planning, is editable for regional or business-line notes, and can be dropped into presentations or shared quickly across teams.
Economic factors
Interest rate cycle sensitivity
Net interest margin for First National Bank is highly sensitive to Federal Reserve policy and curve shape; with the fed funds target near 5.25–5.50% in mid‑2025 and aggregate US bank NIM around 3.0% in 2024, curve shifts materially affect spreads. Rapid hikes or cuts can push deposit betas toward 30–50%, alter asset yields and raise hedging costs. Active balance‑sheet management—duration, liabilities mix and loan pricing—helps protect spread compression. In late‑cycle phases, pricing discipline and loan/deposit mix drive margin outcomes.
Regional growth and employment
Mid‑Atlantic economic stability and Southeast in‑migration (regional pop. gains ~0.8% in 2024) support diversified loan demand for F.N.B., boosting mortgage and C&I originations while keeping deposit growth steady. Labor markets remain tight (US unemployment ~3.7% in 2024–25), which underpins consumer spend but influences credit quality through wage and rehiring cycles. F.N.B. benefits from sectoral breadth across retail, energy and services yet must monitor cyclicals, while localized underwriting and branch-level credit oversight limit downside.
Credit quality and borrower resilience
Small business, CRE and consumer credit at First National Bank remain sensitive to cash flows and the federal funds rate, which stood near 5.25–5.50% in 2024–2025. Stress in office CRE—US office vacancy around 17% in 2024—plus leveraged CRE segments can raise loan loss provisions. Early warning analytics and tighter covenant enforcement have reduced loss severity. Geographic diversification smooths regional volatility and credit concentration risk.
Deposit competition and funding mix
Disintermediation to money market funds, whose assets topped $5 trillion in 2024 (ICI), has pressured deposit growth and increased funding costs for First National Bank as customers seek higher yields.
Relationship primacy and expanded treasury services strengthen operating-deposit stickiness; terming and wholesale backstops provide liquidity flexibility but exert downward pressure on NIM, while granular pricing and loyalty programs have reduced retail runoff.
- Higher MMF flows: >$5T (2024, ICI)
- Relationship/tax & treasury services: retain operating deposits
- Terming/wholesale: liquidity vs NIM trade-off
- Granular pricing & loyalty: curb runoff
Housing market dynamics
Affordability, tight inventory and higher mortgage rates steer First National Bank’s residential lending and fee mix; 30-year fixed averaged about 6.9% (Freddie Mac, June 2025). Home equity utilization rises as purchase volumes slow—Case‑Shiller 20‑city index +3.0% YoY (Apr 2025) while existing‑home sales fell ~4% YoY (NAR, May 2025). Construction trends (single‑family starts +5% YoY, Apr 2025, U.S. Census) shape CRE pipelines; balanced exposure mitigates cyclicality.
- Mortgage rate: 30y ~6.9% (Freddie Mac, Jun 2025)
- Inventory: months supply ~2.5 (NAR, May 2025)
- Prices: Case‑Shiller 20-city +3.0% YoY (Apr 2025)
- Starts: single‑family +5% YoY (Apr 2025, Census)
Fed 5.25–5.50%, SEC rule up costs; $4.2T munis boost lending
Fed policy (fed funds ~5.25–5.50% mid‑2025) and curve shifts drive NIM sensitivity (US bank NIM ~3.0% in 2024). Deposit flows to MMFs (> $5T in 2024) raise funding costs while tight labor (unemployment ~3.7% 2024–25) supports loan demand. Housing/mortgage stress (30y ~6.9% Jun 2025) and 17% office vacancy elevate CRE risk.
| Metric | Value |
|---|---|
| Fed funds | 5.25–5.50% (mid‑2025) |
| Bank NIM | ~3.0% (2024) |
| MMF assets | >$5T (2024) |
| Unemployment | ~3.7% (2024–25) |
| 30y mortgage | ~6.9% (Jun 2025) |
| Office vacancy | ~17% (2024) |
What You See Is What You Get
First National Bank PESTLE Analysis
The preview shown here is the exact First National Bank PESTLE Analysis you’ll receive after purchase—fully formatted and ready to use. It covers Political, Economic, Social, Technological, Legal and Environmental factors with charts and actionable insights. No placeholders or teasers—this is the final, downloaded file. Instant delivery of the document as displayed.
Original: $10.00
-65%$10.00
$3.50Description
Make Smarter Strategic Decisions with a Complete PESTEL View
Gain a competitive edge with our PESTLE Analysis of First National Bank—three concise sections revealing how political, economic, social, technological, legal, and environmental forces shape strategy and risk. Ideal for investors, advisors, and executives, it translates trends into actionable recommendations. Purchase the full report to access the complete, editable analysis and make informed decisions faster.
Political factors
Regulatory policy volatility
Shifts in U.S. banking policy and leadership at the Federal Reserve, FDIC, OCC and CFPB can alter compliance expectations and capital planning; the Fed funds target of about 5.25–5.50% (mid‑2025) sharpens capital cost pressures. Political focus on consumer protection and oversight pushes banks toward higher CET1 buffers (commonly 8–12% versus the 4.5% minimum) and redesign of fee/product structures. F.N.B. must adapt swiftly and proactively engage regulators to reduce disruption risk.
Fiscal policy and public spending
Federal infrastructure funding, notably the 2021 IIJA which delivers roughly 550 billion dollars in new investment, boosts loan demand and fee income for First National Bank across Mid‑Atlantic and Southeastern markets. Government incentives and SBA programs in 2024 continued to catalyze small‑business lending and public finance opportunities, while the US municipal bond market—about 4.2 trillion outstanding in 2024—remains a key funding source. Budget constraints or federal/state shutdowns can abruptly slow pipelines, so targeted regional coverage improves capture of funded projects.
Community development priorities
Political emphasis on affordable housing and small-business support expands CRA-related opportunities; aligning F.N.B. lending to these priorities can tap growing demand in lower‑income markets where U.S. affordable housing shortfalls exceed millions of units.
By directing community development loans and investments toward local priorities, F.N.B. strengthens stakeholder goodwill and keeps its ~500-branch network relevant in diverse communities.
Such alignment also reduces reputational exposure and lowers exam risk under evolving CRA expectations and regulatory scrutiny.
Interstate banking climate
State political dynamics shape First National Bank branch rationalization, charters and market entry through varying licensing and community reinvestment expectations; Riegle‑Neal era interstate rules remain the legal backbone. Variations in state incentives and tax regimes drive footprint optimization across jurisdictions. Coordinated government relations teams help navigate local permitting and CRA expectations. Consistency across Mid‑Atlantic and Southeast supports scalable expansion; there were about 4,600 FDIC‑insured institutions in mid‑2024.
- State licensing and CRA rules
- Incentives/tax differentials
- Government relations coordination
- Mid‑Atlantic/Southeast scalability; ~4,600 FDIC institutions (mid‑2024)
Cybersecurity and critical infrastructure policy
Rising federal and state focus on financial infrastructure resilience forces First National Bank to harden systems and document preparedness; the SEC cyber incident rule (finalized 2023) tightened reporting to four business days, and state-level directives now mandate faster timelines and joint sector exercises. Compliance improves market trust but is raising operating costs and capital expenditure on defenses, making cyber investment a clear political and supervisory imperative.
- SEC rule: 4 business-day incident reporting
- Higher compliance costs impacting ROE
- Mandatory sector exercises and state mandates increasing
Fed 5.25–5.50%, SEC rule up costs; $4.2T munis boost lending
Federal policy and regulator focus (Fed funds ~5.25–5.50% mid‑2025; SEC 4‑business‑day breach rule) raise capital and compliance costs, pressuring ROE. IIJA ~$550bn and a $4.2tn muni market (mid‑2024) boost regional lending; ~500 branches support capture. State licensing/tax differences and ~4,600 FDIC banks (mid‑2024) shape footprint strategy.
| Factor | Impact |
|---|---|
| Rates/Regulation | Higher capital & compliance costs |
| Infrastructure/Munis | Loan/fee growth |
What is included in the product
Detailed Word Document
Explores how Political, Economic, Social, Technological, Environmental, and Legal forces uniquely impact First National Bank, using current data and regional regulatory context to identify risks and opportunities. Designed for executives and advisors, the analysis offers detailed sub-points and forward-looking insights to support scenario planning, strategy, and investor communications.
Customizable Excel Spreadsheet
A concise, visually segmented PESTLE summary for First National Bank that simplifies external risk assessment for meetings and planning, is editable for regional or business-line notes, and can be dropped into presentations or shared quickly across teams.
Economic factors
Interest rate cycle sensitivity
Net interest margin for First National Bank is highly sensitive to Federal Reserve policy and curve shape; with the fed funds target near 5.25–5.50% in mid‑2025 and aggregate US bank NIM around 3.0% in 2024, curve shifts materially affect spreads. Rapid hikes or cuts can push deposit betas toward 30–50%, alter asset yields and raise hedging costs. Active balance‑sheet management—duration, liabilities mix and loan pricing—helps protect spread compression. In late‑cycle phases, pricing discipline and loan/deposit mix drive margin outcomes.
Regional growth and employment
Mid‑Atlantic economic stability and Southeast in‑migration (regional pop. gains ~0.8% in 2024) support diversified loan demand for F.N.B., boosting mortgage and C&I originations while keeping deposit growth steady. Labor markets remain tight (US unemployment ~3.7% in 2024–25), which underpins consumer spend but influences credit quality through wage and rehiring cycles. F.N.B. benefits from sectoral breadth across retail, energy and services yet must monitor cyclicals, while localized underwriting and branch-level credit oversight limit downside.
Credit quality and borrower resilience
Small business, CRE and consumer credit at First National Bank remain sensitive to cash flows and the federal funds rate, which stood near 5.25–5.50% in 2024–2025. Stress in office CRE—US office vacancy around 17% in 2024—plus leveraged CRE segments can raise loan loss provisions. Early warning analytics and tighter covenant enforcement have reduced loss severity. Geographic diversification smooths regional volatility and credit concentration risk.
Deposit competition and funding mix
Disintermediation to money market funds, whose assets topped $5 trillion in 2024 (ICI), has pressured deposit growth and increased funding costs for First National Bank as customers seek higher yields.
Relationship primacy and expanded treasury services strengthen operating-deposit stickiness; terming and wholesale backstops provide liquidity flexibility but exert downward pressure on NIM, while granular pricing and loyalty programs have reduced retail runoff.
- Higher MMF flows: >$5T (2024, ICI)
- Relationship/tax & treasury services: retain operating deposits
- Terming/wholesale: liquidity vs NIM trade-off
- Granular pricing & loyalty: curb runoff
Housing market dynamics
Affordability, tight inventory and higher mortgage rates steer First National Bank’s residential lending and fee mix; 30-year fixed averaged about 6.9% (Freddie Mac, June 2025). Home equity utilization rises as purchase volumes slow—Case‑Shiller 20‑city index +3.0% YoY (Apr 2025) while existing‑home sales fell ~4% YoY (NAR, May 2025). Construction trends (single‑family starts +5% YoY, Apr 2025, U.S. Census) shape CRE pipelines; balanced exposure mitigates cyclicality.
- Mortgage rate: 30y ~6.9% (Freddie Mac, Jun 2025)
- Inventory: months supply ~2.5 (NAR, May 2025)
- Prices: Case‑Shiller 20-city +3.0% YoY (Apr 2025)
- Starts: single‑family +5% YoY (Apr 2025, Census)
Fed 5.25–5.50%, SEC rule up costs; $4.2T munis boost lending
Fed policy (fed funds ~5.25–5.50% mid‑2025) and curve shifts drive NIM sensitivity (US bank NIM ~3.0% in 2024). Deposit flows to MMFs (> $5T in 2024) raise funding costs while tight labor (unemployment ~3.7% 2024–25) supports loan demand. Housing/mortgage stress (30y ~6.9% Jun 2025) and 17% office vacancy elevate CRE risk.
| Metric | Value |
|---|---|
| Fed funds | 5.25–5.50% (mid‑2025) |
| Bank NIM | ~3.0% (2024) |
| MMF assets | >$5T (2024) |
| Unemployment | ~3.7% (2024–25) |
| 30y mortgage | ~6.9% (Jun 2025) |
| Office vacancy | ~17% (2024) |
What You See Is What You Get
First National Bank PESTLE Analysis
The preview shown here is the exact First National Bank PESTLE Analysis you’ll receive after purchase—fully formatted and ready to use. It covers Political, Economic, Social, Technological, Legal and Environmental factors with charts and actionable insights. No placeholders or teasers—this is the final, downloaded file. Instant delivery of the document as displayed.











