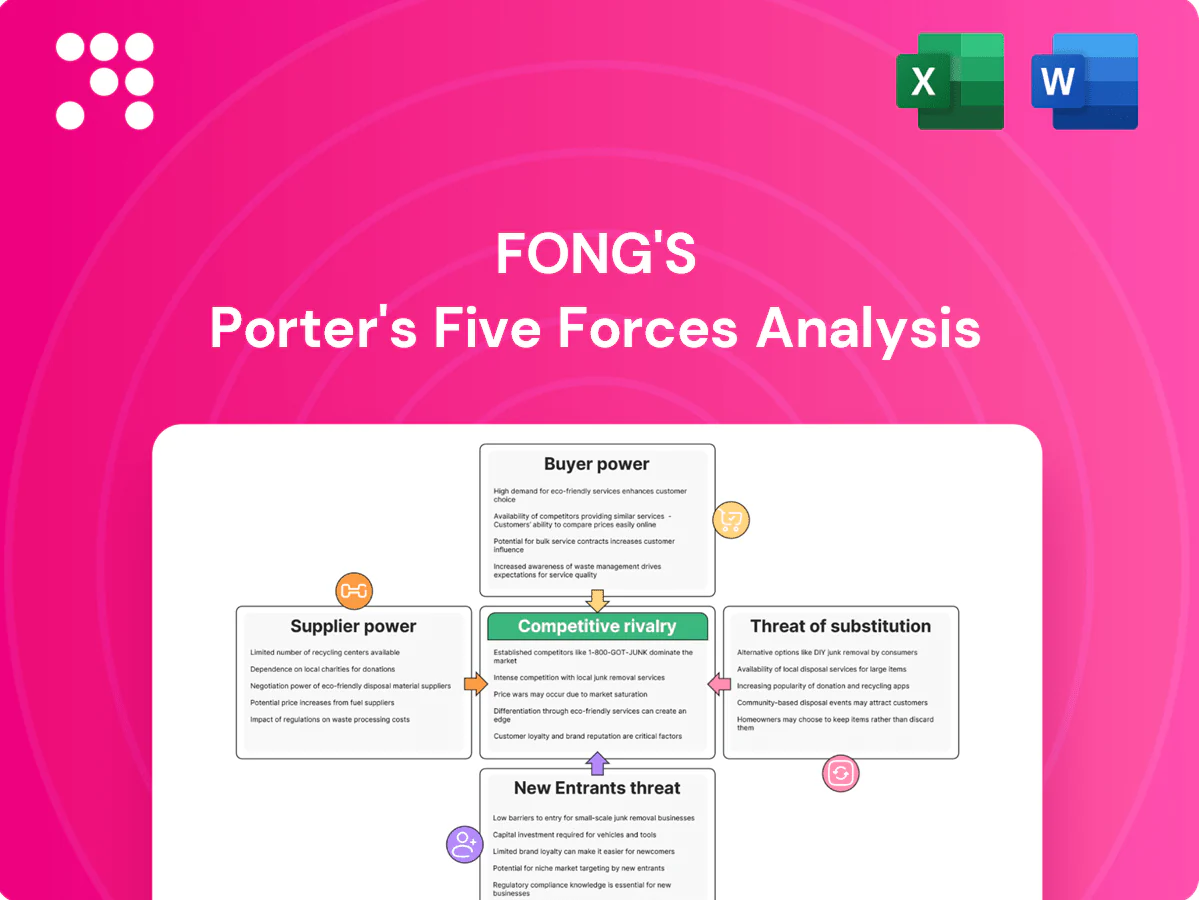
Fong's Porter's Five Forces Analysis

Elevate Your Analysis with the Complete Porter's Five Forces Analysis
Fong's Porter's Five Forces analysis highlights supplier leverage, buyer power, competitive rivalry, threat of new entrants, and substitute pressure shaping its market position. This snapshot identifies key pressure points and strategic levers to protect margins and grow share. The full report delivers force-by-force ratings, visuals and actionable recommendations—unlock it to inform investment or strategic decisions.
Suppliers Bargaining Power

Concentrated critical components
Key subsystems like PLCs, motors, pumps, valves and sensors are sourced from a handful of global OEMs, concentrating supply and raising switching costs; industry reports in 2024 show top-tier automation vendors still dominate procurement pools. This concentration gives suppliers leverage over pricing and lead times, with many control components facing lead times measured in weeks to months. Dual-sourcing reduces risk but certification and integration requirements limit flexibility, so any disruption can delay complex machine builds and push project timelines out by weeks or quarters.
Specialty materials exposure
Stainless steels, specialty alloys and precision castings are critical for corrosion-resistant, high-temp dyeing, but 2024 saw metal-price swings exceeding 20% and energy costs up roughly 15% year-on-year, squeezing margins; long lead times (often 12–20 weeks for custom fabrications) limit schedule agility; strategic inventory buffering and vendor-managed inventory (VMI) deals reduce risk but cannot fully eliminate supplier exposure.

Customization and co-development
Many components are tailored to sustainability features such as heat recovery, low-liquor ratios and advanced controls, and co-developed parts boost performance differentiation while deepening dependence on specific suppliers. Tooling investments often run into millions of dollars and unique specifications materially reduce substitutability and raise switching costs. Renegotiations typically hinge on multi-year lifetime volume commitments and service-level terms, reinforcing supplier leverage.

Logistics and compliance friction
Global shipments of bulky, high-value modules face freight-rate swings and port congestion, with the Drewry World Container Index averaging about $1,500 per 40ft in 2024, raising logistics risk and inventory costs. Compliance with safety and environmental standards adds documentation and testing costs, and suppliers with global footprints can meet these needs and command premiums. Localization reduces exposure but requires qualifying new vendors and upfront CAPEX.
- Freight volatility: higher transit cost and schedule risk
- Compliance burden: added testing/documentation expenses
- Global suppliers: premium pricing for turnkey logistics
- Localization: reduces risk but needs vendor qualification
Aftermarket parts leverage
Installed base drives recurring spares/upgrades, often making aftermarket ~30% of OEM lifecycle revenue; proprietary-part suppliers can command pricing power across the service lifecycle, though predictable volumes enable frame agreements and rebate schemes that can cut parts cost by ~10–15% in negotiated programs; failure-rate analytics (e.g., MTBF trends) underpin should-cost and redesign-to-cost efforts.
- installed-base → recurring demand
- proprietary parts → pricing power
- volume visibility → frame agreements/rebates (~10–15%)
- failure-rate data → should-cost/redesign
OEM concentration raises prices & lead times; metal >20%, aftermarket ~30%
Supplier concentration in 2024 (top OEMs dominate) raises pricing and lead-time leverage—many control parts face weeks–months delays; metal prices swung >20% and energy rose ~15% YoY, squeezing margins. Proprietary spares make aftermarket ~30% of OEM revenue, enabling price premiums, though frame agreements can cut parts cost ~10–15%. Freight volatility (Drewry ~ $1,500/40ft) and compliance add premium to global suppliers.
| Metric | 2024 |
|---|---|
| Metal price swing | >20% |
| Energy cost change | +~15% YoY |
| Aftermarket share | ~30% |
| Freight index | $1,500/40ft |
| Parts rebate | 10–15% |
What is included in the product
 Detailed Word Document
Tailored Porter's Five Forces analysis for Fong’s that uncovers key drivers of competition, buyer and supplier power, substitutes and entrant risks, identifies disruptive threats and market dynamics that protect or expose Fong’s profitability, and provides strategic insights for use in investor decks, business plans, or editable Word reports.

 Customizable Excel Spreadsheet
Fong's Porter's Five Forces gives a clean one-sheet summary of competitive pressures with customizable pressure levels and a radar chart, ready to drop into decks—no macros, easy for non‑finance users and duplicable for different scenarios.
Customers Bargaining Power

Consolidated industrial buyers
Large textile groups and dye houses place infrequent, high-value capex via competitive tenders, leveraging procurement best practices to drive down prices; the global apparel market reached about $1.7 trillion in 2024, concentrating buying power upstream. Multi-plant rollouts amplify discount and SLA demands as buyers seek rollout economics and uptime guarantees. Prolonged vendor qualification and multi-stage tenders extend negotiation cycles, strengthening buyer leverage.
ROI and sustainability focus
Buyers assess total cost of ownership—throughput, water/energy/chemical savings and downtime—linking operational metrics directly to procurement decisions. The 2024 rollout of the EU CSRD, covering roughly 50,000 companies, intensifies ESG mandates and enables value-based pricing tied to measurable efficiency gains. Transparent performance data and guarantees shift negotiations toward demonstrated ROI, which can reduce emphasis on headline price.

Switching and multi-sourcing
Compatibility with utilities, chemistries and floor layouts materially increases switching costs, since retrofit and validation can require multi-year downtime; service contracts commonly span around 3 years. Buyers routinely multi-source across brands to avoid single-vendor dependency and to benchmark pricing. Standardized interfaces like OPC UA and Ethernet/IP reduce lock-in and bolster buyer power, while proprietary software and high-quality service (99.9% SLA) can partially recreate stickiness.

Service network expectations
Uptime is critical: 2024 industry surveys indicated over two-thirds of buyers prioritize continuous availability, driving demand for rapid commissioning and local technicians. Strong aftermarket support is a decisive bid differentiator; weak coverage often forces price concessions or disqualification. Long-term maintenance contracts shift leverage back to proven OEMs.
- Uptime priority: >66% buyers (2024)
- Fast commissioning & local techs required
- Aftermarket support = bid winner
- Weak coverage → price cuts/disqualification
- Long-term contracts favor OEMs
Cyclical demand and timing
Textile capex cycles drive OEM overcapacity, allowing buyers in downturns to extract deeper discounts and extended payment terms; project bundling and phased deliveries are used as negotiation levers while upcycles—with lead times of roughly 3–9 months—shift power back to suppliers.
- Buyers leverage downturns
- Bundling + phased delivery = concessions
- Upcycle lead times 3–9 months reduce buyer power
Buyers wield leverage in $1.7T apparel market: uptime & verified TCO drive contracts
Buyers exert strong leverage: global apparel market ~$1.7T in 2024 concentrates purchasing power and enables competitive tenders. Over 66% of buyers prioritize uptime, favoring vendors with rapid commissioning and local service; typical service contracts ~3 years. EU CSRD (2024) and TCO metrics shift negotiations toward verified efficiency and ROI, while 3–9 month lead times can swing power to suppliers.
| Metric | Value (2024) |
|---|---|
| Global apparel market | $1.7T |
| Buyers prioritizing uptime | >66% |
| Typical service contract | ~3 years |
| Lead times (upcycle) | 3–9 months |
Same Document Delivered
Fong's Porter's Five Forces Analysis
This preview displays Fong's Porter's Five Forces Analysis exactly as delivered—complete, professionally formatted, and ready for immediate use. What you see here is the same file you'll download after purchase, with no placeholders or samples. Purchase grants instant access to this final document.

Elevate Your Analysis with the Complete Porter's Five Forces Analysis
Fong's Porter's Five Forces analysis highlights supplier leverage, buyer power, competitive rivalry, threat of new entrants, and substitute pressure shaping its market position. This snapshot identifies key pressure points and strategic levers to protect margins and grow share. The full report delivers force-by-force ratings, visuals and actionable recommendations—unlock it to inform investment or strategic decisions.
Suppliers Bargaining Power
Concentrated critical components
Key subsystems like PLCs, motors, pumps, valves and sensors are sourced from a handful of global OEMs, concentrating supply and raising switching costs; industry reports in 2024 show top-tier automation vendors still dominate procurement pools. This concentration gives suppliers leverage over pricing and lead times, with many control components facing lead times measured in weeks to months. Dual-sourcing reduces risk but certification and integration requirements limit flexibility, so any disruption can delay complex machine builds and push project timelines out by weeks or quarters.
Specialty materials exposure
Stainless steels, specialty alloys and precision castings are critical for corrosion-resistant, high-temp dyeing, but 2024 saw metal-price swings exceeding 20% and energy costs up roughly 15% year-on-year, squeezing margins; long lead times (often 12–20 weeks for custom fabrications) limit schedule agility; strategic inventory buffering and vendor-managed inventory (VMI) deals reduce risk but cannot fully eliminate supplier exposure.
Customization and co-development
Many components are tailored to sustainability features such as heat recovery, low-liquor ratios and advanced controls, and co-developed parts boost performance differentiation while deepening dependence on specific suppliers. Tooling investments often run into millions of dollars and unique specifications materially reduce substitutability and raise switching costs. Renegotiations typically hinge on multi-year lifetime volume commitments and service-level terms, reinforcing supplier leverage.
Logistics and compliance friction
Global shipments of bulky, high-value modules face freight-rate swings and port congestion, with the Drewry World Container Index averaging about $1,500 per 40ft in 2024, raising logistics risk and inventory costs. Compliance with safety and environmental standards adds documentation and testing costs, and suppliers with global footprints can meet these needs and command premiums. Localization reduces exposure but requires qualifying new vendors and upfront CAPEX.
- Freight volatility: higher transit cost and schedule risk
- Compliance burden: added testing/documentation expenses
- Global suppliers: premium pricing for turnkey logistics
- Localization: reduces risk but needs vendor qualification
Aftermarket parts leverage
Installed base drives recurring spares/upgrades, often making aftermarket ~30% of OEM lifecycle revenue; proprietary-part suppliers can command pricing power across the service lifecycle, though predictable volumes enable frame agreements and rebate schemes that can cut parts cost by ~10–15% in negotiated programs; failure-rate analytics (e.g., MTBF trends) underpin should-cost and redesign-to-cost efforts.
- installed-base → recurring demand
- proprietary parts → pricing power
- volume visibility → frame agreements/rebates (~10–15%)
- failure-rate data → should-cost/redesign
OEM concentration raises prices & lead times; metal >20%, aftermarket ~30%
Supplier concentration in 2024 (top OEMs dominate) raises pricing and lead-time leverage—many control parts face weeks–months delays; metal prices swung >20% and energy rose ~15% YoY, squeezing margins. Proprietary spares make aftermarket ~30% of OEM revenue, enabling price premiums, though frame agreements can cut parts cost ~10–15%. Freight volatility (Drewry ~ $1,500/40ft) and compliance add premium to global suppliers.
| Metric | 2024 |
|---|---|
| Metal price swing | >20% |
| Energy cost change | +~15% YoY |
| Aftermarket share | ~30% |
| Freight index | $1,500/40ft |
| Parts rebate | 10–15% |
What is included in the product
Detailed Word Document
Tailored Porter's Five Forces analysis for Fong’s that uncovers key drivers of competition, buyer and supplier power, substitutes and entrant risks, identifies disruptive threats and market dynamics that protect or expose Fong’s profitability, and provides strategic insights for use in investor decks, business plans, or editable Word reports.
Customizable Excel Spreadsheet
Fong's Porter's Five Forces gives a clean one-sheet summary of competitive pressures with customizable pressure levels and a radar chart, ready to drop into decks—no macros, easy for non‑finance users and duplicable for different scenarios.
Customers Bargaining Power
Consolidated industrial buyers
Large textile groups and dye houses place infrequent, high-value capex via competitive tenders, leveraging procurement best practices to drive down prices; the global apparel market reached about $1.7 trillion in 2024, concentrating buying power upstream. Multi-plant rollouts amplify discount and SLA demands as buyers seek rollout economics and uptime guarantees. Prolonged vendor qualification and multi-stage tenders extend negotiation cycles, strengthening buyer leverage.
ROI and sustainability focus
Buyers assess total cost of ownership—throughput, water/energy/chemical savings and downtime—linking operational metrics directly to procurement decisions. The 2024 rollout of the EU CSRD, covering roughly 50,000 companies, intensifies ESG mandates and enables value-based pricing tied to measurable efficiency gains. Transparent performance data and guarantees shift negotiations toward demonstrated ROI, which can reduce emphasis on headline price.
Switching and multi-sourcing
Compatibility with utilities, chemistries and floor layouts materially increases switching costs, since retrofit and validation can require multi-year downtime; service contracts commonly span around 3 years. Buyers routinely multi-source across brands to avoid single-vendor dependency and to benchmark pricing. Standardized interfaces like OPC UA and Ethernet/IP reduce lock-in and bolster buyer power, while proprietary software and high-quality service (99.9% SLA) can partially recreate stickiness.
Service network expectations
Uptime is critical: 2024 industry surveys indicated over two-thirds of buyers prioritize continuous availability, driving demand for rapid commissioning and local technicians. Strong aftermarket support is a decisive bid differentiator; weak coverage often forces price concessions or disqualification. Long-term maintenance contracts shift leverage back to proven OEMs.
- Uptime priority: >66% buyers (2024)
- Fast commissioning & local techs required
- Aftermarket support = bid winner
- Weak coverage → price cuts/disqualification
- Long-term contracts favor OEMs
Cyclical demand and timing
Textile capex cycles drive OEM overcapacity, allowing buyers in downturns to extract deeper discounts and extended payment terms; project bundling and phased deliveries are used as negotiation levers while upcycles—with lead times of roughly 3–9 months—shift power back to suppliers.
- Buyers leverage downturns
- Bundling + phased delivery = concessions
- Upcycle lead times 3–9 months reduce buyer power
Buyers wield leverage in $1.7T apparel market: uptime & verified TCO drive contracts
Buyers exert strong leverage: global apparel market ~$1.7T in 2024 concentrates purchasing power and enables competitive tenders. Over 66% of buyers prioritize uptime, favoring vendors with rapid commissioning and local service; typical service contracts ~3 years. EU CSRD (2024) and TCO metrics shift negotiations toward verified efficiency and ROI, while 3–9 month lead times can swing power to suppliers.
| Metric | Value (2024) |
|---|---|
| Global apparel market | $1.7T |
| Buyers prioritizing uptime | >66% |
| Typical service contract | ~3 years |
| Lead times (upcycle) | 3–9 months |
Same Document Delivered
Fong's Porter's Five Forces Analysis
This preview displays Fong's Porter's Five Forces Analysis exactly as delivered—complete, professionally formatted, and ready for immediate use. What you see here is the same file you'll download after purchase, with no placeholders or samples. Purchase grants instant access to this final document.
Original: $10.00
-65%$10.00
$3.50Description
Elevate Your Analysis with the Complete Porter's Five Forces Analysis
Fong's Porter's Five Forces analysis highlights supplier leverage, buyer power, competitive rivalry, threat of new entrants, and substitute pressure shaping its market position. This snapshot identifies key pressure points and strategic levers to protect margins and grow share. The full report delivers force-by-force ratings, visuals and actionable recommendations—unlock it to inform investment or strategic decisions.
Suppliers Bargaining Power
Concentrated critical components
Key subsystems like PLCs, motors, pumps, valves and sensors are sourced from a handful of global OEMs, concentrating supply and raising switching costs; industry reports in 2024 show top-tier automation vendors still dominate procurement pools. This concentration gives suppliers leverage over pricing and lead times, with many control components facing lead times measured in weeks to months. Dual-sourcing reduces risk but certification and integration requirements limit flexibility, so any disruption can delay complex machine builds and push project timelines out by weeks or quarters.
Specialty materials exposure
Stainless steels, specialty alloys and precision castings are critical for corrosion-resistant, high-temp dyeing, but 2024 saw metal-price swings exceeding 20% and energy costs up roughly 15% year-on-year, squeezing margins; long lead times (often 12–20 weeks for custom fabrications) limit schedule agility; strategic inventory buffering and vendor-managed inventory (VMI) deals reduce risk but cannot fully eliminate supplier exposure.
Customization and co-development
Many components are tailored to sustainability features such as heat recovery, low-liquor ratios and advanced controls, and co-developed parts boost performance differentiation while deepening dependence on specific suppliers. Tooling investments often run into millions of dollars and unique specifications materially reduce substitutability and raise switching costs. Renegotiations typically hinge on multi-year lifetime volume commitments and service-level terms, reinforcing supplier leverage.
Logistics and compliance friction
Global shipments of bulky, high-value modules face freight-rate swings and port congestion, with the Drewry World Container Index averaging about $1,500 per 40ft in 2024, raising logistics risk and inventory costs. Compliance with safety and environmental standards adds documentation and testing costs, and suppliers with global footprints can meet these needs and command premiums. Localization reduces exposure but requires qualifying new vendors and upfront CAPEX.
- Freight volatility: higher transit cost and schedule risk
- Compliance burden: added testing/documentation expenses
- Global suppliers: premium pricing for turnkey logistics
- Localization: reduces risk but needs vendor qualification
Aftermarket parts leverage
Installed base drives recurring spares/upgrades, often making aftermarket ~30% of OEM lifecycle revenue; proprietary-part suppliers can command pricing power across the service lifecycle, though predictable volumes enable frame agreements and rebate schemes that can cut parts cost by ~10–15% in negotiated programs; failure-rate analytics (e.g., MTBF trends) underpin should-cost and redesign-to-cost efforts.
- installed-base → recurring demand
- proprietary parts → pricing power
- volume visibility → frame agreements/rebates (~10–15%)
- failure-rate data → should-cost/redesign
OEM concentration raises prices & lead times; metal >20%, aftermarket ~30%
Supplier concentration in 2024 (top OEMs dominate) raises pricing and lead-time leverage—many control parts face weeks–months delays; metal prices swung >20% and energy rose ~15% YoY, squeezing margins. Proprietary spares make aftermarket ~30% of OEM revenue, enabling price premiums, though frame agreements can cut parts cost ~10–15%. Freight volatility (Drewry ~ $1,500/40ft) and compliance add premium to global suppliers.
| Metric | 2024 |
|---|---|
| Metal price swing | >20% |
| Energy cost change | +~15% YoY |
| Aftermarket share | ~30% |
| Freight index | $1,500/40ft |
| Parts rebate | 10–15% |
What is included in the product
Detailed Word Document
Tailored Porter's Five Forces analysis for Fong’s that uncovers key drivers of competition, buyer and supplier power, substitutes and entrant risks, identifies disruptive threats and market dynamics that protect or expose Fong’s profitability, and provides strategic insights for use in investor decks, business plans, or editable Word reports.
Customizable Excel Spreadsheet
Fong's Porter's Five Forces gives a clean one-sheet summary of competitive pressures with customizable pressure levels and a radar chart, ready to drop into decks—no macros, easy for non‑finance users and duplicable for different scenarios.
Customers Bargaining Power
Consolidated industrial buyers
Large textile groups and dye houses place infrequent, high-value capex via competitive tenders, leveraging procurement best practices to drive down prices; the global apparel market reached about $1.7 trillion in 2024, concentrating buying power upstream. Multi-plant rollouts amplify discount and SLA demands as buyers seek rollout economics and uptime guarantees. Prolonged vendor qualification and multi-stage tenders extend negotiation cycles, strengthening buyer leverage.
ROI and sustainability focus
Buyers assess total cost of ownership—throughput, water/energy/chemical savings and downtime—linking operational metrics directly to procurement decisions. The 2024 rollout of the EU CSRD, covering roughly 50,000 companies, intensifies ESG mandates and enables value-based pricing tied to measurable efficiency gains. Transparent performance data and guarantees shift negotiations toward demonstrated ROI, which can reduce emphasis on headline price.
Switching and multi-sourcing
Compatibility with utilities, chemistries and floor layouts materially increases switching costs, since retrofit and validation can require multi-year downtime; service contracts commonly span around 3 years. Buyers routinely multi-source across brands to avoid single-vendor dependency and to benchmark pricing. Standardized interfaces like OPC UA and Ethernet/IP reduce lock-in and bolster buyer power, while proprietary software and high-quality service (99.9% SLA) can partially recreate stickiness.
Service network expectations
Uptime is critical: 2024 industry surveys indicated over two-thirds of buyers prioritize continuous availability, driving demand for rapid commissioning and local technicians. Strong aftermarket support is a decisive bid differentiator; weak coverage often forces price concessions or disqualification. Long-term maintenance contracts shift leverage back to proven OEMs.
- Uptime priority: >66% buyers (2024)
- Fast commissioning & local techs required
- Aftermarket support = bid winner
- Weak coverage → price cuts/disqualification
- Long-term contracts favor OEMs
Cyclical demand and timing
Textile capex cycles drive OEM overcapacity, allowing buyers in downturns to extract deeper discounts and extended payment terms; project bundling and phased deliveries are used as negotiation levers while upcycles—with lead times of roughly 3–9 months—shift power back to suppliers.
- Buyers leverage downturns
- Bundling + phased delivery = concessions
- Upcycle lead times 3–9 months reduce buyer power
Buyers wield leverage in $1.7T apparel market: uptime & verified TCO drive contracts
Buyers exert strong leverage: global apparel market ~$1.7T in 2024 concentrates purchasing power and enables competitive tenders. Over 66% of buyers prioritize uptime, favoring vendors with rapid commissioning and local service; typical service contracts ~3 years. EU CSRD (2024) and TCO metrics shift negotiations toward verified efficiency and ROI, while 3–9 month lead times can swing power to suppliers.
| Metric | Value (2024) |
|---|---|
| Global apparel market | $1.7T |
| Buyers prioritizing uptime | >66% |
| Typical service contract | ~3 years |
| Lead times (upcycle) | 3–9 months |
Same Document Delivered
Fong's Porter's Five Forces Analysis
This preview displays Fong's Porter's Five Forces Analysis exactly as delivered—complete, professionally formatted, and ready for immediate use. What you see here is the same file you'll download after purchase, with no placeholders or samples. Purchase grants instant access to this final document.











