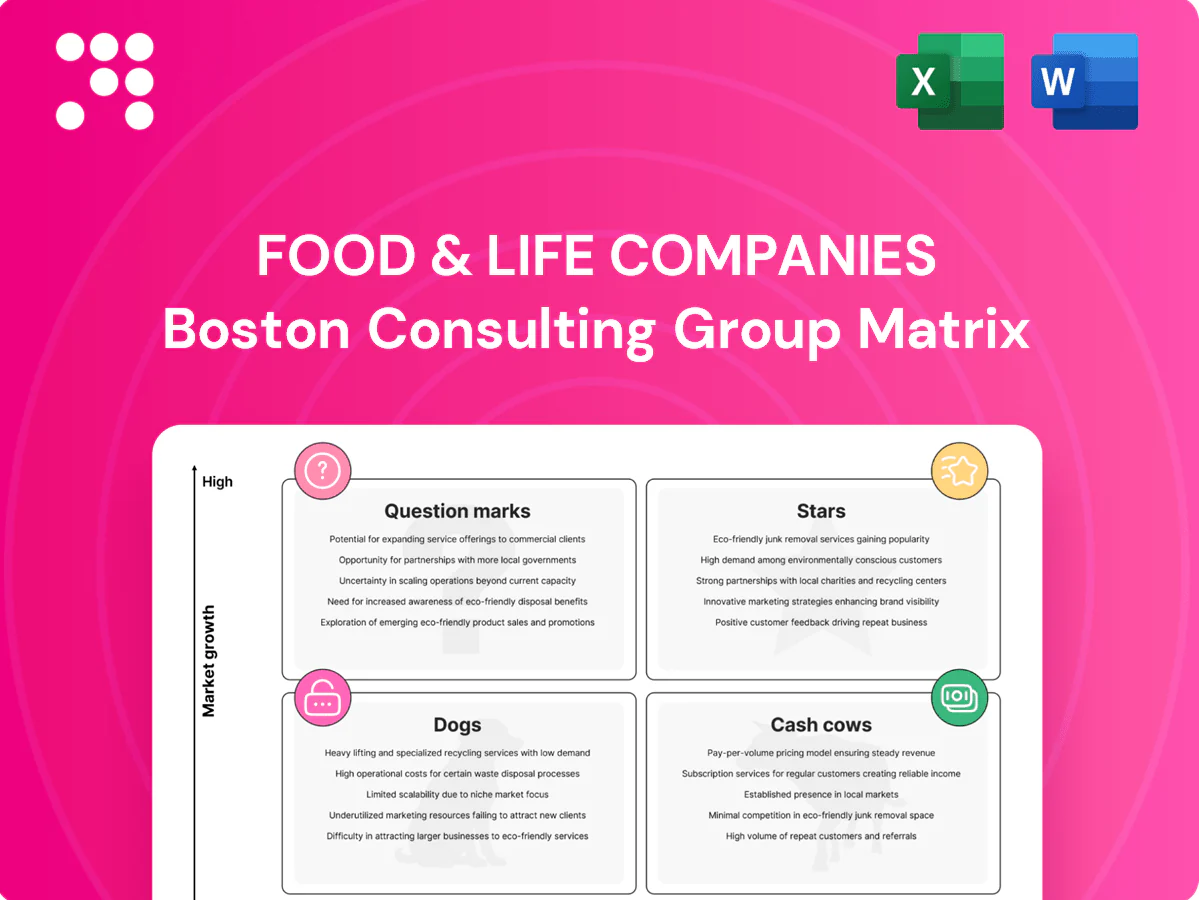
Food & Life Companies Boston Consulting Group Matrix

Download Your Competitive Advantage
Curious where Food & Life Companies’ brands sit—Stars, Cash Cows, Dogs or Question Marks? This preview teases the answers; buy the full BCG Matrix to get quadrant-by-quadrant placements, data-backed recommendations, and a clear roadmap for where to invest or cut. Purchase now for a ready-to-use Word report plus an editable Excel summary that speeds your strategy.
Stars

Sushiro Japan core lanes
Sushiro Japan is Japan's largest conveyor-belt sushi chain (Akindo Sushiro, TSE: 3563) with market-leading brand pull and dense domestic coverage. Demand is still expanding as value dining gains share amid a tough consumer backdrop. Heavy promotional and tech investment to sustain peak-hour share is needed while maximizing throughput, freshness, and speed to compound into future cash-cow cash flow.
Digital ordering + kitchen automation
Digital ordering + kitchen automation is a Star: 2024 industry reports show digital orders can lift table turns 10–20% and ticket size 8–12%, driving high growth and market share expansion. It is capital hungry, with upfront tech and kitchen investment, but ROI appears in labor leverage (labor costs down ~20%) and fewer stockouts (inventory shortfalls down ~30%). Being first and best defends share against lookalikes; continue investing while the tech curve separates winners from the pack.

Family-value menu bundles
Family-value menu bundles are Stars: attach rates run 35–45% with weekend/holiday repeat visits ~1.8x weekday frequency, driving high traffic and basket growth. The affordable family-dining segment grew ~6–7% CAGR through 2024 versus ~2–3% for full-service, per industry data. Ongoing menu engineering and targeted promos are required to sustain share and can lift margins by 200–400 basis points, converting growth into a durable profit center.

Mobile app engagement + waitlist
Mobile app engagement plus a waitlist sits in Stars: user growth often exceeds 40% YoY in fast-rollouts and materially smooths traffic and retention; industry benchmarks show Day-1 retention ~26–30%, Day-7 ~8–10% and Day-30 ~4–6%, enabling pricing and promo leverage but requiring continuous product and data work. Costs are front-loaded (dev, CRM, offers) and CAC for food apps commonly ranges $50–$120; keep investing in acquisition and personalization to cement leadership while rivals lag.
- High growth: >40% YoY in scale-ups
- Retention: D1 26–30%, D7 8–10%, D30 4–6%
- Front-loaded costs: dev, CRM, offers; CAC ~$50–$120
- Strategy: push acquisition + personalization to lock market share
SEA flagship stores (e.g., Thailand)
In 2024 SEA flagship stores (e.g., Thailand) leverage early-mover advantage as middle-class dining-out demand recovered and 2024 foodservice spend exceeded pre-pandemic levels; they drive high buzz and elevated comps but heavy setup and training burn cash. Flagships act as brand beacons and talent hubs, accelerating rollouts. Double down where unit economics hit plan and competition is still fragmented.
- Early mover: captures rising middle-class spend in 2024
- Tradeoff: high comps vs. upfront capex and training burn
- Strategic role: brand beacon and talent hub
- Scale: expand where unit economics proven and market fragmented
Convert >40% digital growth into margin lift via automation & bundles
Sushiro Stars: rapid store and digital growth driving share; invest in automation, app and family bundles to convert demand into margin expansion. Digital orders + automation lift turns 10–20%, ticket 8–12%, labor -20%; mobile CAC $50–$120 and user growth often >40% YoY. Expand SEA flagships where unit economics meet targets; prioritize fragmented markets.
| Metric | Range/Value | Impact |
|---|---|---|
| Growth | >40% YoY | Share capture |
| Turns/Ticket | +10–20% / +8–12% | Revenue lift |
| Labor | -20% | Margin |
| CAC | $50–$120 | Front-loaded cost |
What is included in the product
 Detailed Word Document
In-depth BCG Matrix review of Food & Life Companies, mapping Stars, Cash Cows, Question Marks, Dogs with strategic investment guidance.

 Customizable Excel Spreadsheet
One-page BCG matrix mapping Food & Life units to quadrants for quick strategy decisions.
Cash Cows

Mature Sushiro suburban units
Mature Sushiro suburban units deliver stable traffic, optimized labor and predictable supply chains, keeping incremental spend minimal and generating robust free cash flow in 2024. High share in mature catchments sustains margin resilience and strong unit economics. Capex is largely limited to upkeep and light refresh cycles. Strategy: milk gently while protecting service standards and freshness KPIs.
Weekday lunch value sets
Weekday lunch value sets sit in a low-growth (~3% annual category growth in 2024) but deliver reliable volume from office/local trade, often accounting for 20–30% of weekday transactions. Pricing power is modest, yet gross margins of 12–18% are preserved through strict portion control and high throughput. Minimal marketing beyond in-store and app placements is required. Maintain and harvest; don’t overcomplicate.

Takeout party trays
Takeout party trays are a cash cow with predictable seasonal spikes around major holidays and a steady baseline demand supported by strong brand trust in quality. Prep is highly standardized, waste is predictable, and add-on delivery fees and minimums provide margin cushioning. Growth is mature; priority is operational efficiency and margin optimization. Cash flow funds new-format pilots and market-entry tests.

Franchise royalties (select markets)
Franchise royalties in select markets are a high-margin fee stream once units mature, typically 4–6% of gross sales and yielding franchisor EBITDA margins often 70–90% (2024 industry data). Growth stabilizes after initial ramp to low-single-digit annual revenue growth. Support systems and audits keep quality tight with incremental costs often under 2% of royalty revenue; maintain relationships, update playbooks, and collect the checks.
- royalty rate: 4–6% of sales
- franchisor margin: ~70–90% on fees
- post-ramp growth: low single digits
- support cost: <2% of royalty revenue
Core beverage and dessert add-ons
Core beverage and dessert add-ons are attachment-driven profits requiring minimal training and complexity; in 2024 category growth is effectively flat (~0% CAGR) while delivering dependable incremental gross margins often in the 50–70% range. Little to no media is needed to sustain sales; maintain a tight, proven SKU set and prioritize execution speed to protect throughput and margin.
- High attachment, low complexity
- 2024 growth: ~0% (flat)
- Incremental gross margin: ~50–70%
- No/low media required; focus on SKU and speed
Suburban units: stable traffic, strong free cash flow - unit EBITDA 18-25%
Mature suburban units deliver stable traffic and strong free cash flow in 2024, with unit EBITDA margins ~18–25% and minimal capex. Weekday lunch sets drive 20–30% of weekday tickets, category growth ~3% (2024) and gross margins 12–18%. Takeout trays and beverage add-ons yield incremental margins 50–70%; franchise royalties 4–6% of sales, franchisor margin 70–90%.
| Item | 2024 Metric |
|---|---|
| Unit EBITDA | 18–25% |
| Lunch share | 20–30% |
| Category growth | ~3% CAGR |
| Add-on margin | 50–70% |
| Royalty rate | 4–6% |
Preview = Final Product
Food & Life Companies BCG Matrix
The file you’re previewing here is the exact Food & Life Companies BCG Matrix you’ll receive after purchase — no watermarks, no demo notes, just the finished, professionally formatted report. It’s built for clarity and action, ready to edit, print, or present to your team. Buy once, download immediately, and use it straightaway with no surprises.

Download Your Competitive Advantage
Curious where Food & Life Companies’ brands sit—Stars, Cash Cows, Dogs or Question Marks? This preview teases the answers; buy the full BCG Matrix to get quadrant-by-quadrant placements, data-backed recommendations, and a clear roadmap for where to invest or cut. Purchase now for a ready-to-use Word report plus an editable Excel summary that speeds your strategy.
Stars
Sushiro Japan core lanes
Sushiro Japan is Japan's largest conveyor-belt sushi chain (Akindo Sushiro, TSE: 3563) with market-leading brand pull and dense domestic coverage. Demand is still expanding as value dining gains share amid a tough consumer backdrop. Heavy promotional and tech investment to sustain peak-hour share is needed while maximizing throughput, freshness, and speed to compound into future cash-cow cash flow.
Digital ordering + kitchen automation
Digital ordering + kitchen automation is a Star: 2024 industry reports show digital orders can lift table turns 10–20% and ticket size 8–12%, driving high growth and market share expansion. It is capital hungry, with upfront tech and kitchen investment, but ROI appears in labor leverage (labor costs down ~20%) and fewer stockouts (inventory shortfalls down ~30%). Being first and best defends share against lookalikes; continue investing while the tech curve separates winners from the pack.
Family-value menu bundles
Family-value menu bundles are Stars: attach rates run 35–45% with weekend/holiday repeat visits ~1.8x weekday frequency, driving high traffic and basket growth. The affordable family-dining segment grew ~6–7% CAGR through 2024 versus ~2–3% for full-service, per industry data. Ongoing menu engineering and targeted promos are required to sustain share and can lift margins by 200–400 basis points, converting growth into a durable profit center.
Mobile app engagement + waitlist
Mobile app engagement plus a waitlist sits in Stars: user growth often exceeds 40% YoY in fast-rollouts and materially smooths traffic and retention; industry benchmarks show Day-1 retention ~26–30%, Day-7 ~8–10% and Day-30 ~4–6%, enabling pricing and promo leverage but requiring continuous product and data work. Costs are front-loaded (dev, CRM, offers) and CAC for food apps commonly ranges $50–$120; keep investing in acquisition and personalization to cement leadership while rivals lag.
- High growth: >40% YoY in scale-ups
- Retention: D1 26–30%, D7 8–10%, D30 4–6%
- Front-loaded costs: dev, CRM, offers; CAC ~$50–$120
- Strategy: push acquisition + personalization to lock market share
SEA flagship stores (e.g., Thailand)
In 2024 SEA flagship stores (e.g., Thailand) leverage early-mover advantage as middle-class dining-out demand recovered and 2024 foodservice spend exceeded pre-pandemic levels; they drive high buzz and elevated comps but heavy setup and training burn cash. Flagships act as brand beacons and talent hubs, accelerating rollouts. Double down where unit economics hit plan and competition is still fragmented.
- Early mover: captures rising middle-class spend in 2024
- Tradeoff: high comps vs. upfront capex and training burn
- Strategic role: brand beacon and talent hub
- Scale: expand where unit economics proven and market fragmented
Convert >40% digital growth into margin lift via automation & bundles
Sushiro Stars: rapid store and digital growth driving share; invest in automation, app and family bundles to convert demand into margin expansion. Digital orders + automation lift turns 10–20%, ticket 8–12%, labor -20%; mobile CAC $50–$120 and user growth often >40% YoY. Expand SEA flagships where unit economics meet targets; prioritize fragmented markets.
| Metric | Range/Value | Impact |
|---|---|---|
| Growth | >40% YoY | Share capture |
| Turns/Ticket | +10–20% / +8–12% | Revenue lift |
| Labor | -20% | Margin |
| CAC | $50–$120 | Front-loaded cost |
What is included in the product
Detailed Word Document
In-depth BCG Matrix review of Food & Life Companies, mapping Stars, Cash Cows, Question Marks, Dogs with strategic investment guidance.
Customizable Excel Spreadsheet
One-page BCG matrix mapping Food & Life units to quadrants for quick strategy decisions.
Cash Cows
Mature Sushiro suburban units
Mature Sushiro suburban units deliver stable traffic, optimized labor and predictable supply chains, keeping incremental spend minimal and generating robust free cash flow in 2024. High share in mature catchments sustains margin resilience and strong unit economics. Capex is largely limited to upkeep and light refresh cycles. Strategy: milk gently while protecting service standards and freshness KPIs.
Weekday lunch value sets
Weekday lunch value sets sit in a low-growth (~3% annual category growth in 2024) but deliver reliable volume from office/local trade, often accounting for 20–30% of weekday transactions. Pricing power is modest, yet gross margins of 12–18% are preserved through strict portion control and high throughput. Minimal marketing beyond in-store and app placements is required. Maintain and harvest; don’t overcomplicate.
Takeout party trays
Takeout party trays are a cash cow with predictable seasonal spikes around major holidays and a steady baseline demand supported by strong brand trust in quality. Prep is highly standardized, waste is predictable, and add-on delivery fees and minimums provide margin cushioning. Growth is mature; priority is operational efficiency and margin optimization. Cash flow funds new-format pilots and market-entry tests.
Franchise royalties (select markets)
Franchise royalties in select markets are a high-margin fee stream once units mature, typically 4–6% of gross sales and yielding franchisor EBITDA margins often 70–90% (2024 industry data). Growth stabilizes after initial ramp to low-single-digit annual revenue growth. Support systems and audits keep quality tight with incremental costs often under 2% of royalty revenue; maintain relationships, update playbooks, and collect the checks.
- royalty rate: 4–6% of sales
- franchisor margin: ~70–90% on fees
- post-ramp growth: low single digits
- support cost: <2% of royalty revenue
Core beverage and dessert add-ons
Core beverage and dessert add-ons are attachment-driven profits requiring minimal training and complexity; in 2024 category growth is effectively flat (~0% CAGR) while delivering dependable incremental gross margins often in the 50–70% range. Little to no media is needed to sustain sales; maintain a tight, proven SKU set and prioritize execution speed to protect throughput and margin.
- High attachment, low complexity
- 2024 growth: ~0% (flat)
- Incremental gross margin: ~50–70%
- No/low media required; focus on SKU and speed
Suburban units: stable traffic, strong free cash flow - unit EBITDA 18-25%
Mature suburban units deliver stable traffic and strong free cash flow in 2024, with unit EBITDA margins ~18–25% and minimal capex. Weekday lunch sets drive 20–30% of weekday tickets, category growth ~3% (2024) and gross margins 12–18%. Takeout trays and beverage add-ons yield incremental margins 50–70%; franchise royalties 4–6% of sales, franchisor margin 70–90%.
| Item | 2024 Metric |
|---|---|
| Unit EBITDA | 18–25% |
| Lunch share | 20–30% |
| Category growth | ~3% CAGR |
| Add-on margin | 50–70% |
| Royalty rate | 4–6% |
Preview = Final Product
Food & Life Companies BCG Matrix
The file you’re previewing here is the exact Food & Life Companies BCG Matrix you’ll receive after purchase — no watermarks, no demo notes, just the finished, professionally formatted report. It’s built for clarity and action, ready to edit, print, or present to your team. Buy once, download immediately, and use it straightaway with no surprises.
Original: $10.00
-65%$10.00
$3.50Description
Download Your Competitive Advantage
Curious where Food & Life Companies’ brands sit—Stars, Cash Cows, Dogs or Question Marks? This preview teases the answers; buy the full BCG Matrix to get quadrant-by-quadrant placements, data-backed recommendations, and a clear roadmap for where to invest or cut. Purchase now for a ready-to-use Word report plus an editable Excel summary that speeds your strategy.
Stars
Sushiro Japan core lanes
Sushiro Japan is Japan's largest conveyor-belt sushi chain (Akindo Sushiro, TSE: 3563) with market-leading brand pull and dense domestic coverage. Demand is still expanding as value dining gains share amid a tough consumer backdrop. Heavy promotional and tech investment to sustain peak-hour share is needed while maximizing throughput, freshness, and speed to compound into future cash-cow cash flow.
Digital ordering + kitchen automation
Digital ordering + kitchen automation is a Star: 2024 industry reports show digital orders can lift table turns 10–20% and ticket size 8–12%, driving high growth and market share expansion. It is capital hungry, with upfront tech and kitchen investment, but ROI appears in labor leverage (labor costs down ~20%) and fewer stockouts (inventory shortfalls down ~30%). Being first and best defends share against lookalikes; continue investing while the tech curve separates winners from the pack.
Family-value menu bundles
Family-value menu bundles are Stars: attach rates run 35–45% with weekend/holiday repeat visits ~1.8x weekday frequency, driving high traffic and basket growth. The affordable family-dining segment grew ~6–7% CAGR through 2024 versus ~2–3% for full-service, per industry data. Ongoing menu engineering and targeted promos are required to sustain share and can lift margins by 200–400 basis points, converting growth into a durable profit center.
Mobile app engagement + waitlist
Mobile app engagement plus a waitlist sits in Stars: user growth often exceeds 40% YoY in fast-rollouts and materially smooths traffic and retention; industry benchmarks show Day-1 retention ~26–30%, Day-7 ~8–10% and Day-30 ~4–6%, enabling pricing and promo leverage but requiring continuous product and data work. Costs are front-loaded (dev, CRM, offers) and CAC for food apps commonly ranges $50–$120; keep investing in acquisition and personalization to cement leadership while rivals lag.
- High growth: >40% YoY in scale-ups
- Retention: D1 26–30%, D7 8–10%, D30 4–6%
- Front-loaded costs: dev, CRM, offers; CAC ~$50–$120
- Strategy: push acquisition + personalization to lock market share
SEA flagship stores (e.g., Thailand)
In 2024 SEA flagship stores (e.g., Thailand) leverage early-mover advantage as middle-class dining-out demand recovered and 2024 foodservice spend exceeded pre-pandemic levels; they drive high buzz and elevated comps but heavy setup and training burn cash. Flagships act as brand beacons and talent hubs, accelerating rollouts. Double down where unit economics hit plan and competition is still fragmented.
- Early mover: captures rising middle-class spend in 2024
- Tradeoff: high comps vs. upfront capex and training burn
- Strategic role: brand beacon and talent hub
- Scale: expand where unit economics proven and market fragmented
Convert >40% digital growth into margin lift via automation & bundles
Sushiro Stars: rapid store and digital growth driving share; invest in automation, app and family bundles to convert demand into margin expansion. Digital orders + automation lift turns 10–20%, ticket 8–12%, labor -20%; mobile CAC $50–$120 and user growth often >40% YoY. Expand SEA flagships where unit economics meet targets; prioritize fragmented markets.
| Metric | Range/Value | Impact |
|---|---|---|
| Growth | >40% YoY | Share capture |
| Turns/Ticket | +10–20% / +8–12% | Revenue lift |
| Labor | -20% | Margin |
| CAC | $50–$120 | Front-loaded cost |
What is included in the product
Detailed Word Document
In-depth BCG Matrix review of Food & Life Companies, mapping Stars, Cash Cows, Question Marks, Dogs with strategic investment guidance.
Customizable Excel Spreadsheet
One-page BCG matrix mapping Food & Life units to quadrants for quick strategy decisions.
Cash Cows
Mature Sushiro suburban units
Mature Sushiro suburban units deliver stable traffic, optimized labor and predictable supply chains, keeping incremental spend minimal and generating robust free cash flow in 2024. High share in mature catchments sustains margin resilience and strong unit economics. Capex is largely limited to upkeep and light refresh cycles. Strategy: milk gently while protecting service standards and freshness KPIs.
Weekday lunch value sets
Weekday lunch value sets sit in a low-growth (~3% annual category growth in 2024) but deliver reliable volume from office/local trade, often accounting for 20–30% of weekday transactions. Pricing power is modest, yet gross margins of 12–18% are preserved through strict portion control and high throughput. Minimal marketing beyond in-store and app placements is required. Maintain and harvest; don’t overcomplicate.
Takeout party trays
Takeout party trays are a cash cow with predictable seasonal spikes around major holidays and a steady baseline demand supported by strong brand trust in quality. Prep is highly standardized, waste is predictable, and add-on delivery fees and minimums provide margin cushioning. Growth is mature; priority is operational efficiency and margin optimization. Cash flow funds new-format pilots and market-entry tests.
Franchise royalties (select markets)
Franchise royalties in select markets are a high-margin fee stream once units mature, typically 4–6% of gross sales and yielding franchisor EBITDA margins often 70–90% (2024 industry data). Growth stabilizes after initial ramp to low-single-digit annual revenue growth. Support systems and audits keep quality tight with incremental costs often under 2% of royalty revenue; maintain relationships, update playbooks, and collect the checks.
- royalty rate: 4–6% of sales
- franchisor margin: ~70–90% on fees
- post-ramp growth: low single digits
- support cost: <2% of royalty revenue
Core beverage and dessert add-ons
Core beverage and dessert add-ons are attachment-driven profits requiring minimal training and complexity; in 2024 category growth is effectively flat (~0% CAGR) while delivering dependable incremental gross margins often in the 50–70% range. Little to no media is needed to sustain sales; maintain a tight, proven SKU set and prioritize execution speed to protect throughput and margin.
- High attachment, low complexity
- 2024 growth: ~0% (flat)
- Incremental gross margin: ~50–70%
- No/low media required; focus on SKU and speed
Suburban units: stable traffic, strong free cash flow - unit EBITDA 18-25%
Mature suburban units deliver stable traffic and strong free cash flow in 2024, with unit EBITDA margins ~18–25% and minimal capex. Weekday lunch sets drive 20–30% of weekday tickets, category growth ~3% (2024) and gross margins 12–18%. Takeout trays and beverage add-ons yield incremental margins 50–70%; franchise royalties 4–6% of sales, franchisor margin 70–90%.
| Item | 2024 Metric |
|---|---|
| Unit EBITDA | 18–25% |
| Lunch share | 20–30% |
| Category growth | ~3% CAGR |
| Add-on margin | 50–70% |
| Royalty rate | 4–6% |
Preview = Final Product
Food & Life Companies BCG Matrix
The file you’re previewing here is the exact Food & Life Companies BCG Matrix you’ll receive after purchase — no watermarks, no demo notes, just the finished, professionally formatted report. It’s built for clarity and action, ready to edit, print, or present to your team. Buy once, download immediately, and use it straightaway with no surprises.











