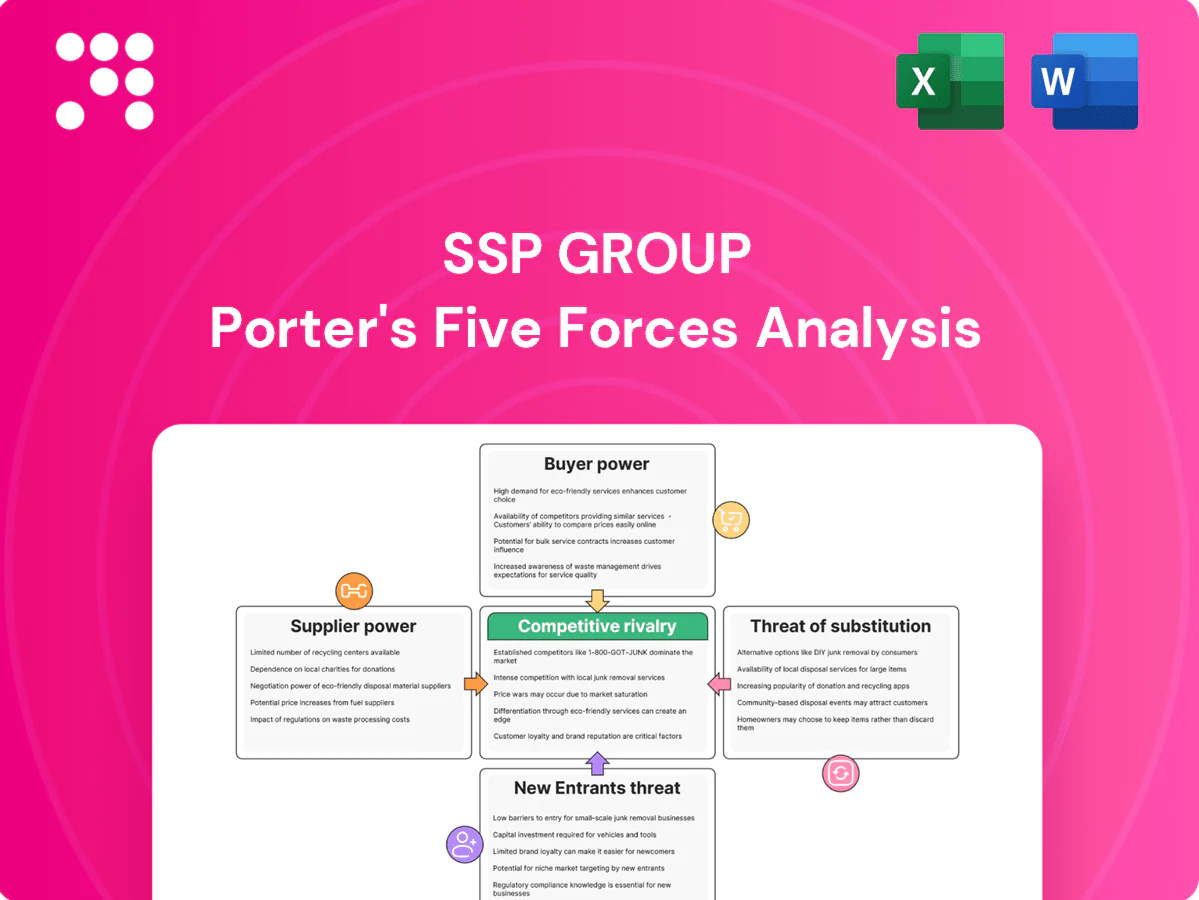
SSP Group Porter's Five Forces Analysis

Go Beyond the Preview—Access the Full Strategic Report
SSP Group faces moderate supplier leverage, shifting buyer power from large travel operators, and a steady threat from low-cost foodservice substitutes and new airport entrants, creating a mixed competitive landscape. Strategic strengths include scale and travel sector expertise, while cyclical passenger volumes and margin pressure are key risks. This brief snapshot only scratches the surface—unlock the full Porter’s Five Forces Analysis for force-by-force ratings, visuals, and actionable recommendations.
Suppliers Bargaining Power

Airport landlords as critical suppliers
Airports and rail operators supply scarce retail space and set lease terms, fees and operating standards, with SSP operating over 2,500 outlets across about 35 countries which concentrates its exposure to landlord decisions. Tender-based allocations and high take-rate structures (often 10–20% of turnover) give landlords leverage over margins and format choice. Dependence on prime locations raises switching costs, while contract lengths typically of 5–15 years and material MAGs further entrench landlord power.
Global brand franchisors’ leverage
Licensors of marquee brands can demand royalties (often 5–10% of sales), strict capex and operational standards, and compliance audits, forcing SSP to accept terms to secure high-footfall concepts that drive volume. SSP’s own estate of in-house brands and 30+ country, c.600-location scale (c.£2bn revenue in 2023) partially offsets this supplier power. Multi-market presence enables master agreements and better pricing, but dependence on global franchisors for premium traffic remains material.

Food commodities and specialty inputs
Volatile costs in proteins, coffee and wheat continue to squeeze margins — ICE Arabica coffee futures rose about 12% in 2024 and Chicago wheat futures were up roughly 8% year-on-year, increasing input cost pressure. Many staple commodities have multiple sources, but specialty or protected-origin items limit substitution and raise supplier power. SSP uses hedging and menu engineering to mitigate exposure, though pass-through to prices lags by quarters. Diversifying local sourcing has reduced single-supplier risk in key markets.

Equipment and tech vendors
POS, kitchen equipment and payment systems have strong integration and airport-certification lock-ins; replacing them disrupts secure operations and materially raises switching costs. Vendors holding airport certifications extract firmer commercial terms. Multi-year service contracts (commonly 3–5 years) embed escalators of ~2–3% p.a. and SLA penalties up to ~10% of fees.
- lock-in: integration + certification
- switching cost: operational disruption
- certified vendors: stronger pricing power
- contracts: 3–5y, 2–3% escalators, SLA ≤10%
Labor agencies and training providers
Security-cleared staffing pools are tight, especially airside, often showing vacancy rates above 10% in 2024, giving agencies leverage; wage floors, unionisation and peak-hour premiums pushed frontline pay up to c.8% higher in 2024, intensifying cost pressure. Training and compliance vendors add mandatory £800–£1,200 per hire in 2024; cross-training and internal academies can cut agency dependency over 18–36 months.
- High agency leverage: vacancy rate >10% (2024)
- Cost pressure: pay inflation ~8% (2024)
- Training cost: £800–£1,200 per hire (2024)
- Mitigation: internal academies reduce dependency in 18–36 months
Travel retail margins under pressure as landlords, licensors and rising input/labour costs bite
Airports/rail landlords and licensors exert high supplier power: 2,500 outlets in ~35 countries, c.£2bn revenue (2023); landlord take-rates 10–20% and leases 5–15y with MAGs; licensors royalties 5–10%. Input shocks (ICE Arabica +12% 2024; Chicago wheat +8% y/y) and labour pressure (vacancy >10%, pay +8% 2024) raise costs.
| Supplier | Metric | 2023/24 |
|---|---|---|
| Landlords | Outlets / take-rate | 2,500 / 10–20% |
| Licensors | Royalties | 5–10% |
| Inputs | Coffee / Wheat | +12% / +8% |
| Labour | Vacancy / pay | >10% / +8% |
What is included in the product
 Detailed Word Document
Tailored Porter's Five Forces analysis for SSP Group uncovering competitive intensity, buyer and supplier bargaining power, threat of new entrants and substitutes, and strategic barriers that safeguard or expose its travel-foodservice market position.

 Customizable Excel Spreadsheet
A concise one-sheet Porter's Five Forces for SSP Group that visualizes strategic pressure with a spider chart and lets you swap in current data—ideal for quick decisions, slide-ready reporting, and easy integration into wider dashboards.
Customers Bargaining Power

Time-pressed, fragmented travelers
End-customers are numerous and uncoordinated—SSP operates across over 35 countries and thousands of travel locations—so collective bargaining is limited. Time constraints, security checks and average short dwell times reduce shopping around, increasing captive demand in sterile zones and lowering switching. Captivity is reinforced by terminal layouts and limited alternatives. Price sensitivity remains, amplified by perceptions of an airport premium despite convenience-driven purchases.
Price transparency via mobile
In 2024 over 65% of travelers use mobile to compare prices and reviews in real time, raising expectations and making excessive premiums trigger social-media backlash and lower conversion rates. Dynamic menu engineering and curated value combos can protect margins while preserving conversion. Clear signage and service speed communicate value beyond price, reducing churn and boosting upsell potential.

Loyalty and brand pull
Strong brands reduce buyer power by raising willingness to pay; SSP’s portfolio presence across 35 countries and c.2,700 outlets in 2024 helps capture premium spend. Deploying owned concepts with loyalty increases repeat capture, lifting average transaction values and visit frequency. In commuter rail, routine buyers demand value and speed, making personalization and pre-order features (adoption rising double digits in travel food tech) key to locking spend.

Dietary and quality expectations
Customers increasingly demand diverse diets, consistent freshness and clear sustainability credentials; failure to meet these needs redirects spend to the nearest alternative. Curated assortments and visible prep counters act as quality signals, while transparent sourcing reduces perceived food-safety and ethical risk. This elevates customer bargaining power in travel-food service contexts.
- diverse diets
- freshness visible
- sourcing transparency
B2B influence via corporate travel
Corporate travel policies and lounge offerings can shift spend off concourses, even though business travelers—about 12% of passengers but responsible for roughly 75% of airport spend—remain high-value; corporations rarely bargain directly with SSP at POS, so SSP leans on airline and rail voucher partnerships to capture captive budgets and uses gate-adjacent bundle deals to reclaim share.
- policy-diversion
- low-pos-bargaining
- voucher-partnerships
- gate-bundling
Travel retail: 65% mobile checks reshape ~75% airport spend
Customers have limited collective bargaining due to fragmented, captive travel settings, but 2024 trends raise power: c.2,700 SSP outlets across 35+ countries face 65% of travelers using mobile price/ review checks, and business travelers (12% of passengers) deliver ~75% of airport spend. Convenience, visible freshness and loyalty reduce churn while social-media backlash penalizes excess premiums.
| Metric | 2024 |
|---|---|
| Outlets | c.2,700 |
| Countries | 35+ |
| Mobile checks | 65% |
| Business travelers | 12% pax / ~75% spend |
Preview Before You Purchase
SSP Group Porter's Five Forces Analysis
This preview shows the exact SSP Group Porter’s Five Forces analysis you’ll receive immediately after purchase—fully formatted and ready for use. It is the complete, professionally written document with no placeholders or mockups. Once you buy, you’ll get instant access to this same file for download and application.

Go Beyond the Preview—Access the Full Strategic Report
SSP Group faces moderate supplier leverage, shifting buyer power from large travel operators, and a steady threat from low-cost foodservice substitutes and new airport entrants, creating a mixed competitive landscape. Strategic strengths include scale and travel sector expertise, while cyclical passenger volumes and margin pressure are key risks. This brief snapshot only scratches the surface—unlock the full Porter’s Five Forces Analysis for force-by-force ratings, visuals, and actionable recommendations.
Suppliers Bargaining Power
Airport landlords as critical suppliers
Airports and rail operators supply scarce retail space and set lease terms, fees and operating standards, with SSP operating over 2,500 outlets across about 35 countries which concentrates its exposure to landlord decisions. Tender-based allocations and high take-rate structures (often 10–20% of turnover) give landlords leverage over margins and format choice. Dependence on prime locations raises switching costs, while contract lengths typically of 5–15 years and material MAGs further entrench landlord power.
Global brand franchisors’ leverage
Licensors of marquee brands can demand royalties (often 5–10% of sales), strict capex and operational standards, and compliance audits, forcing SSP to accept terms to secure high-footfall concepts that drive volume. SSP’s own estate of in-house brands and 30+ country, c.600-location scale (c.£2bn revenue in 2023) partially offsets this supplier power. Multi-market presence enables master agreements and better pricing, but dependence on global franchisors for premium traffic remains material.
Food commodities and specialty inputs
Volatile costs in proteins, coffee and wheat continue to squeeze margins — ICE Arabica coffee futures rose about 12% in 2024 and Chicago wheat futures were up roughly 8% year-on-year, increasing input cost pressure. Many staple commodities have multiple sources, but specialty or protected-origin items limit substitution and raise supplier power. SSP uses hedging and menu engineering to mitigate exposure, though pass-through to prices lags by quarters. Diversifying local sourcing has reduced single-supplier risk in key markets.
Equipment and tech vendors
POS, kitchen equipment and payment systems have strong integration and airport-certification lock-ins; replacing them disrupts secure operations and materially raises switching costs. Vendors holding airport certifications extract firmer commercial terms. Multi-year service contracts (commonly 3–5 years) embed escalators of ~2–3% p.a. and SLA penalties up to ~10% of fees.
- lock-in: integration + certification
- switching cost: operational disruption
- certified vendors: stronger pricing power
- contracts: 3–5y, 2–3% escalators, SLA ≤10%
Labor agencies and training providers
Security-cleared staffing pools are tight, especially airside, often showing vacancy rates above 10% in 2024, giving agencies leverage; wage floors, unionisation and peak-hour premiums pushed frontline pay up to c.8% higher in 2024, intensifying cost pressure. Training and compliance vendors add mandatory £800–£1,200 per hire in 2024; cross-training and internal academies can cut agency dependency over 18–36 months.
- High agency leverage: vacancy rate >10% (2024)
- Cost pressure: pay inflation ~8% (2024)
- Training cost: £800–£1,200 per hire (2024)
- Mitigation: internal academies reduce dependency in 18–36 months
Travel retail margins under pressure as landlords, licensors and rising input/labour costs bite
Airports/rail landlords and licensors exert high supplier power: 2,500 outlets in ~35 countries, c.£2bn revenue (2023); landlord take-rates 10–20% and leases 5–15y with MAGs; licensors royalties 5–10%. Input shocks (ICE Arabica +12% 2024; Chicago wheat +8% y/y) and labour pressure (vacancy >10%, pay +8% 2024) raise costs.
| Supplier | Metric | 2023/24 |
|---|---|---|
| Landlords | Outlets / take-rate | 2,500 / 10–20% |
| Licensors | Royalties | 5–10% |
| Inputs | Coffee / Wheat | +12% / +8% |
| Labour | Vacancy / pay | >10% / +8% |
What is included in the product
Detailed Word Document
Tailored Porter's Five Forces analysis for SSP Group uncovering competitive intensity, buyer and supplier bargaining power, threat of new entrants and substitutes, and strategic barriers that safeguard or expose its travel-foodservice market position.
Customizable Excel Spreadsheet
A concise one-sheet Porter's Five Forces for SSP Group that visualizes strategic pressure with a spider chart and lets you swap in current data—ideal for quick decisions, slide-ready reporting, and easy integration into wider dashboards.
Customers Bargaining Power
Time-pressed, fragmented travelers
End-customers are numerous and uncoordinated—SSP operates across over 35 countries and thousands of travel locations—so collective bargaining is limited. Time constraints, security checks and average short dwell times reduce shopping around, increasing captive demand in sterile zones and lowering switching. Captivity is reinforced by terminal layouts and limited alternatives. Price sensitivity remains, amplified by perceptions of an airport premium despite convenience-driven purchases.
Price transparency via mobile
In 2024 over 65% of travelers use mobile to compare prices and reviews in real time, raising expectations and making excessive premiums trigger social-media backlash and lower conversion rates. Dynamic menu engineering and curated value combos can protect margins while preserving conversion. Clear signage and service speed communicate value beyond price, reducing churn and boosting upsell potential.
Loyalty and brand pull
Strong brands reduce buyer power by raising willingness to pay; SSP’s portfolio presence across 35 countries and c.2,700 outlets in 2024 helps capture premium spend. Deploying owned concepts with loyalty increases repeat capture, lifting average transaction values and visit frequency. In commuter rail, routine buyers demand value and speed, making personalization and pre-order features (adoption rising double digits in travel food tech) key to locking spend.
Dietary and quality expectations
Customers increasingly demand diverse diets, consistent freshness and clear sustainability credentials; failure to meet these needs redirects spend to the nearest alternative. Curated assortments and visible prep counters act as quality signals, while transparent sourcing reduces perceived food-safety and ethical risk. This elevates customer bargaining power in travel-food service contexts.
- diverse diets
- freshness visible
- sourcing transparency
B2B influence via corporate travel
Corporate travel policies and lounge offerings can shift spend off concourses, even though business travelers—about 12% of passengers but responsible for roughly 75% of airport spend—remain high-value; corporations rarely bargain directly with SSP at POS, so SSP leans on airline and rail voucher partnerships to capture captive budgets and uses gate-adjacent bundle deals to reclaim share.
- policy-diversion
- low-pos-bargaining
- voucher-partnerships
- gate-bundling
Travel retail: 65% mobile checks reshape ~75% airport spend
Customers have limited collective bargaining due to fragmented, captive travel settings, but 2024 trends raise power: c.2,700 SSP outlets across 35+ countries face 65% of travelers using mobile price/ review checks, and business travelers (12% of passengers) deliver ~75% of airport spend. Convenience, visible freshness and loyalty reduce churn while social-media backlash penalizes excess premiums.
| Metric | 2024 |
|---|---|
| Outlets | c.2,700 |
| Countries | 35+ |
| Mobile checks | 65% |
| Business travelers | 12% pax / ~75% spend |
Preview Before You Purchase
SSP Group Porter's Five Forces Analysis
This preview shows the exact SSP Group Porter’s Five Forces analysis you’ll receive immediately after purchase—fully formatted and ready for use. It is the complete, professionally written document with no placeholders or mockups. Once you buy, you’ll get instant access to this same file for download and application.
Original: $10.00
-65%$10.00
$3.50Description
Go Beyond the Preview—Access the Full Strategic Report
SSP Group faces moderate supplier leverage, shifting buyer power from large travel operators, and a steady threat from low-cost foodservice substitutes and new airport entrants, creating a mixed competitive landscape. Strategic strengths include scale and travel sector expertise, while cyclical passenger volumes and margin pressure are key risks. This brief snapshot only scratches the surface—unlock the full Porter’s Five Forces Analysis for force-by-force ratings, visuals, and actionable recommendations.
Suppliers Bargaining Power
Airport landlords as critical suppliers
Airports and rail operators supply scarce retail space and set lease terms, fees and operating standards, with SSP operating over 2,500 outlets across about 35 countries which concentrates its exposure to landlord decisions. Tender-based allocations and high take-rate structures (often 10–20% of turnover) give landlords leverage over margins and format choice. Dependence on prime locations raises switching costs, while contract lengths typically of 5–15 years and material MAGs further entrench landlord power.
Global brand franchisors’ leverage
Licensors of marquee brands can demand royalties (often 5–10% of sales), strict capex and operational standards, and compliance audits, forcing SSP to accept terms to secure high-footfall concepts that drive volume. SSP’s own estate of in-house brands and 30+ country, c.600-location scale (c.£2bn revenue in 2023) partially offsets this supplier power. Multi-market presence enables master agreements and better pricing, but dependence on global franchisors for premium traffic remains material.
Food commodities and specialty inputs
Volatile costs in proteins, coffee and wheat continue to squeeze margins — ICE Arabica coffee futures rose about 12% in 2024 and Chicago wheat futures were up roughly 8% year-on-year, increasing input cost pressure. Many staple commodities have multiple sources, but specialty or protected-origin items limit substitution and raise supplier power. SSP uses hedging and menu engineering to mitigate exposure, though pass-through to prices lags by quarters. Diversifying local sourcing has reduced single-supplier risk in key markets.
Equipment and tech vendors
POS, kitchen equipment and payment systems have strong integration and airport-certification lock-ins; replacing them disrupts secure operations and materially raises switching costs. Vendors holding airport certifications extract firmer commercial terms. Multi-year service contracts (commonly 3–5 years) embed escalators of ~2–3% p.a. and SLA penalties up to ~10% of fees.
- lock-in: integration + certification
- switching cost: operational disruption
- certified vendors: stronger pricing power
- contracts: 3–5y, 2–3% escalators, SLA ≤10%
Labor agencies and training providers
Security-cleared staffing pools are tight, especially airside, often showing vacancy rates above 10% in 2024, giving agencies leverage; wage floors, unionisation and peak-hour premiums pushed frontline pay up to c.8% higher in 2024, intensifying cost pressure. Training and compliance vendors add mandatory £800–£1,200 per hire in 2024; cross-training and internal academies can cut agency dependency over 18–36 months.
- High agency leverage: vacancy rate >10% (2024)
- Cost pressure: pay inflation ~8% (2024)
- Training cost: £800–£1,200 per hire (2024)
- Mitigation: internal academies reduce dependency in 18–36 months
Travel retail margins under pressure as landlords, licensors and rising input/labour costs bite
Airports/rail landlords and licensors exert high supplier power: 2,500 outlets in ~35 countries, c.£2bn revenue (2023); landlord take-rates 10–20% and leases 5–15y with MAGs; licensors royalties 5–10%. Input shocks (ICE Arabica +12% 2024; Chicago wheat +8% y/y) and labour pressure (vacancy >10%, pay +8% 2024) raise costs.
| Supplier | Metric | 2023/24 |
|---|---|---|
| Landlords | Outlets / take-rate | 2,500 / 10–20% |
| Licensors | Royalties | 5–10% |
| Inputs | Coffee / Wheat | +12% / +8% |
| Labour | Vacancy / pay | >10% / +8% |
What is included in the product
Detailed Word Document
Tailored Porter's Five Forces analysis for SSP Group uncovering competitive intensity, buyer and supplier bargaining power, threat of new entrants and substitutes, and strategic barriers that safeguard or expose its travel-foodservice market position.
Customizable Excel Spreadsheet
A concise one-sheet Porter's Five Forces for SSP Group that visualizes strategic pressure with a spider chart and lets you swap in current data—ideal for quick decisions, slide-ready reporting, and easy integration into wider dashboards.
Customers Bargaining Power
Time-pressed, fragmented travelers
End-customers are numerous and uncoordinated—SSP operates across over 35 countries and thousands of travel locations—so collective bargaining is limited. Time constraints, security checks and average short dwell times reduce shopping around, increasing captive demand in sterile zones and lowering switching. Captivity is reinforced by terminal layouts and limited alternatives. Price sensitivity remains, amplified by perceptions of an airport premium despite convenience-driven purchases.
Price transparency via mobile
In 2024 over 65% of travelers use mobile to compare prices and reviews in real time, raising expectations and making excessive premiums trigger social-media backlash and lower conversion rates. Dynamic menu engineering and curated value combos can protect margins while preserving conversion. Clear signage and service speed communicate value beyond price, reducing churn and boosting upsell potential.
Loyalty and brand pull
Strong brands reduce buyer power by raising willingness to pay; SSP’s portfolio presence across 35 countries and c.2,700 outlets in 2024 helps capture premium spend. Deploying owned concepts with loyalty increases repeat capture, lifting average transaction values and visit frequency. In commuter rail, routine buyers demand value and speed, making personalization and pre-order features (adoption rising double digits in travel food tech) key to locking spend.
Dietary and quality expectations
Customers increasingly demand diverse diets, consistent freshness and clear sustainability credentials; failure to meet these needs redirects spend to the nearest alternative. Curated assortments and visible prep counters act as quality signals, while transparent sourcing reduces perceived food-safety and ethical risk. This elevates customer bargaining power in travel-food service contexts.
- diverse diets
- freshness visible
- sourcing transparency
B2B influence via corporate travel
Corporate travel policies and lounge offerings can shift spend off concourses, even though business travelers—about 12% of passengers but responsible for roughly 75% of airport spend—remain high-value; corporations rarely bargain directly with SSP at POS, so SSP leans on airline and rail voucher partnerships to capture captive budgets and uses gate-adjacent bundle deals to reclaim share.
- policy-diversion
- low-pos-bargaining
- voucher-partnerships
- gate-bundling
Travel retail: 65% mobile checks reshape ~75% airport spend
Customers have limited collective bargaining due to fragmented, captive travel settings, but 2024 trends raise power: c.2,700 SSP outlets across 35+ countries face 65% of travelers using mobile price/ review checks, and business travelers (12% of passengers) deliver ~75% of airport spend. Convenience, visible freshness and loyalty reduce churn while social-media backlash penalizes excess premiums.
| Metric | 2024 |
|---|---|
| Outlets | c.2,700 |
| Countries | 35+ |
| Mobile checks | 65% |
| Business travelers | 12% pax / ~75% spend |
Preview Before You Purchase
SSP Group Porter's Five Forces Analysis
This preview shows the exact SSP Group Porter’s Five Forces analysis you’ll receive immediately after purchase—fully formatted and ready for use. It is the complete, professionally written document with no placeholders or mockups. Once you buy, you’ll get instant access to this same file for download and application.











