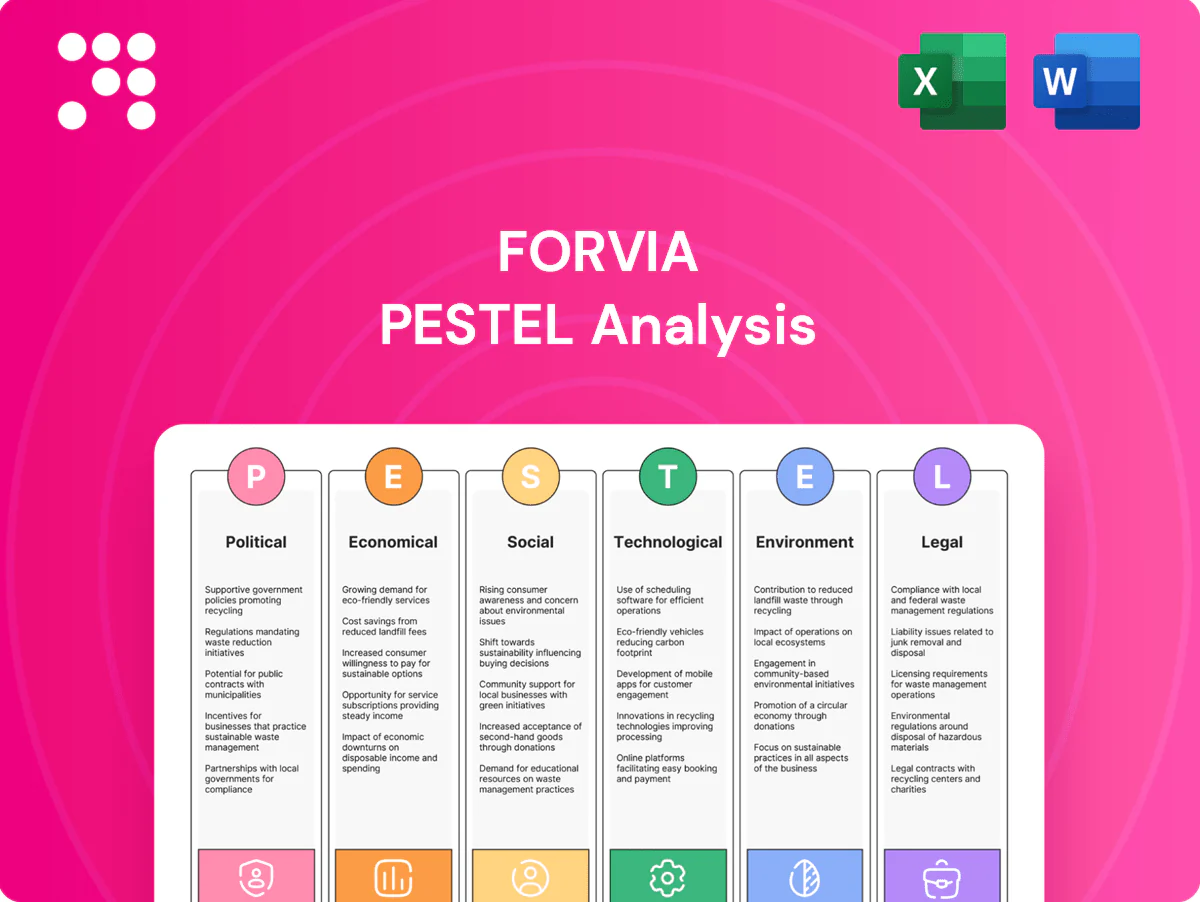
Forvia PESTLE Analysis

Plan Smarter. Present Sharper. Compete Stronger.
Get a competitive edge with our targeted PESTLE analysis of Forvia. Learn how political, economic and technological shifts affect its strategy and risk profile. Perfect for investors and strategists, this ready-made report saves time. Purchase the full analysis for actionable, exportable insights.
Political factors

EV incentives and industrial policy
Government subsidies and industrial strategy—EU Green Deal targets a 55% GHG cut by 2030 and an EU-wide ban on new ICE car sales from 2035, the U.S. IRA offers up to $7,500 EV tax credits with domestic content rules, and China saw ~40% NEV penetration in 2024—drive OEM roadmaps and sourcing; sudden phase-outs or volatility force Forvia to align bids and capacity to policy-driven volume swings.
Trade tariffs and localization
Tariffs on autos and components, including 25% US Section 301 levies on many Chinese parts and USMCA rules-of-origin requiring up to 75% North American content for duty-free autos, shape Forvia plant footprints and sourcing. Localization mandates are driving regional plants and supplier bases, raising capex and working-capital needs. Sudden tariff shifts can compress margins or force redesigns; strategic dual-sourcing and flexible logistics mitigate exposure.

Geopolitical supply risk
Geopolitical tensions disrupting semiconductors, rare earths and energy threaten Forvia: the global semiconductor market was about $560B in 2023 while China supplies roughly 60% of refined rare earths, and EU gas dependence fell to ~17% in 2023 after 2022 shocks. Sanctions and export controls (notably 2023 chip curbs) can constrain critical sensors; Forvia needs political-risk monitoring, inventory buffers, diversified sourcing and nearshoring.

Public procurement and safety priorities
Governments are prioritizing road safety, emissions and resilience—EU rules phase out tailpipe CO2 from new cars by 2035 and WHO reports ~1.3 million road deaths annually—driving demand for ADAS interfaces, advanced lighting and clean mobility. Public procurement (~12% of GDP in OECD) and funding cycles affect revenue timing; early standard engagement can secure specification wins.
- EU 2035 ICE sales phase-out
- WHO ~1.3M annual road deaths
- Public procurement ~12% GDP (OECD)
- Standards early-entry = higher spec win probability
Workforce and industrial relations
Nation-specific labor policies and union dynamics shape plant productivity for Forvia, which employs about 125,000 people worldwide; political backing for reindustrialization (NextGenerationEU €723.8bn) can unlock grants for advanced manufacturing. Strikes or election-related disruptions in OEM hubs can delay assembly lines and cascade to Tier-1 suppliers. Active stakeholder engagement with unions and governments stabilizes operations and mitigates schedule risk.
- labor-policies: nation-specific rules drive staffing costs
- unions: influence productivity and strike risk
- grants: NextGenerationEU €723.8bn supports reindustrialization
- disruption-risk: strikes/elections ripple through supply chain
- mitigation: proactive stakeholder engagement
EU 55% CO2 cut + 2035 ICE ban, US $7,500 EV credit, China NEV ~40% drive capex & nearshoring
EU 55% CO2 cut target by 2030 and 2035 ICE ban force Forvia product shifts and capex reallocation.
US IRA offers up to $7,500 EV credit with domestic-content rules, altering supplier sourcing.
China NEV penetration ~40% in 2024 and semiconductor market ~$560B (2023) heighten supply-risk focus.
Forvia headcount ~125,000; political volatility requires nearshoring and policy monitoring.
| Metric | Value |
|---|---|
| EU ICE phase-out | 2035 |
| US EV credit | $7,500 |
| China NEV (2024) | ~40% |
| Forvia employees | ~125,000 |
What is included in the product
 Detailed Word Document
Explores how Political, Economic, Social, Technological, Environmental and Legal forces uniquely impact Forvia—an automotive systems supplier—linking each factor to current market and regulatory trends across its key regions. Designed for executives and advisors, it provides data-backed, forward-looking insights to identify strategic risks and opportunities.

 Customizable Excel Spreadsheet
Forvia PESTLE Analysis condenses external risks and market drivers into a visually segmented, easy-to-share summary for rapid team alignment and presentation use, with editable notes to tailor insights to specific regions or business lines for faster decision-making.
Economic factors

Auto production cycles
Global light-vehicle builds recovered to about 80 million units in 2024, directly driving Forvia volumes across Seating, Interiors, Clean Mobility and Electronics. Policy rates remain elevated in 2025 (Fed funds ~5.25%, ECB ~4%), weighing on consumer confidence and OEM inventory-led scheduling. Downcycles compress pricing and capacity utilization; flexible cost structures and a resilient program mix are critical to protect margins.
Input cost inflation
Input-cost inflation for Forvia is driven by swings in steel, plastics, energy and semiconductor pricing that have pushed BOM costs — e.g., global hot-rolled coil and polymer markets saw multi‑quarter volatility and semiconductor lead times spiking above 40 weeks in 2021–22. Indexation clauses and design‑to‑cost programs allow passthrough of increases with a lag, typically one to four quarters. European plants face outsized energy risk after TTF gas peaked near €345/MWh in Aug 2022, while long‑term supply contracts and efficiency programs have helped protect margins.

Currency fluctuations
Forvia’s revenues and costs span EUR, USD, CNY and other currencies, with pro forma group sales around €20bn (2023), creating material FX risk. Currency mismatches between sourcing in Asia and sales in Europe/North America can erode margins during adverse moves. Active hedging and natural offsets (local sourcing, invoicing) are essential. Regionalized production and local content strategies reduce FX volatility exposure.

Electrification and mix shift
IEA reports EVs reached 14% of global passenger car sales in 2023, shifting value from exhaust aftertreatment toward electronics and interiors; Forvia must pivot its portfolio to high-growth cockpit electronics, lighting and thermal comfort while keeping ICE/hybrid capabilities for mixed fleets. Capital allocation will follow margin and growth pools, favoring electronics-intensive segments.
- EV penetration: 14% (IEA 2023)
- Value shift: exhaust → electronics/interiors
- Priority: cockpit electronics, lighting, thermal comfort
- Requirement: parallel ICE/hybrid/BEV capabilities
- Capital: directed to margin/growth pools
OEM pricing pressure
Automakers demand 3–5% annual cost-downs and productivity gains, forcing suppliers into tighter RFQ competition that compresses margins and favors scale and innovation. Demonstrable TCO and sustainability benefits raise win rates materially, while platform standardization can unlock up to 20% unit-cost savings, privileging suppliers with broad, scalable footprints and advanced engineering.
- OEM cost-down targets: 3–5% p.a.
- Platform savings: up to 20%
- Competitive RFQs: margin compression — favors scale
- TCO/sustainability: higher win rates
EU 55% CO2 cut + 2035 ICE ban, US $7,500 EV credit, China NEV ~40% drive capex & nearshoring
Global light-vehicle builds ~80m in 2024, supporting Forvia volumes; policy rates stay elevated in 2025 (Fed ~5.25%, ECB ~4%), pressuring demand. Input-cost volatility (steel, polymers, energy, semiconductors) and OEM 3–5% cost-down targets compress margins; pro forma sales ~€20bn (2023) create material FX exposure. EVs 14% of global sales (IEA 2023) shift value toward electronics and interiors, directing capital to those pools.
| Metric | Value |
|---|---|
| Global builds 2024 | ~80m |
| Forvia pro forma sales 2023 | €20bn |
| EV share 2023 | 14% |
| Fed funds 2025 | ~5.25% |
| ECB 2025 | ~4% |
Full Version Awaits
Forvia PESTLE Analysis
This Forvia PESTLE Analysis preview is the exact document you’ll receive after purchase—fully formatted and ready to use. The layout, content, and structure shown here are exactly what you’ll be able to download immediately after buying. No placeholders, no teasers—this is the real, final file, ready for analysis and presentation.

Plan Smarter. Present Sharper. Compete Stronger.
Get a competitive edge with our targeted PESTLE analysis of Forvia. Learn how political, economic and technological shifts affect its strategy and risk profile. Perfect for investors and strategists, this ready-made report saves time. Purchase the full analysis for actionable, exportable insights.
Political factors
EV incentives and industrial policy
Government subsidies and industrial strategy—EU Green Deal targets a 55% GHG cut by 2030 and an EU-wide ban on new ICE car sales from 2035, the U.S. IRA offers up to $7,500 EV tax credits with domestic content rules, and China saw ~40% NEV penetration in 2024—drive OEM roadmaps and sourcing; sudden phase-outs or volatility force Forvia to align bids and capacity to policy-driven volume swings.
Trade tariffs and localization
Tariffs on autos and components, including 25% US Section 301 levies on many Chinese parts and USMCA rules-of-origin requiring up to 75% North American content for duty-free autos, shape Forvia plant footprints and sourcing. Localization mandates are driving regional plants and supplier bases, raising capex and working-capital needs. Sudden tariff shifts can compress margins or force redesigns; strategic dual-sourcing and flexible logistics mitigate exposure.
Geopolitical supply risk
Geopolitical tensions disrupting semiconductors, rare earths and energy threaten Forvia: the global semiconductor market was about $560B in 2023 while China supplies roughly 60% of refined rare earths, and EU gas dependence fell to ~17% in 2023 after 2022 shocks. Sanctions and export controls (notably 2023 chip curbs) can constrain critical sensors; Forvia needs political-risk monitoring, inventory buffers, diversified sourcing and nearshoring.
Public procurement and safety priorities
Governments are prioritizing road safety, emissions and resilience—EU rules phase out tailpipe CO2 from new cars by 2035 and WHO reports ~1.3 million road deaths annually—driving demand for ADAS interfaces, advanced lighting and clean mobility. Public procurement (~12% of GDP in OECD) and funding cycles affect revenue timing; early standard engagement can secure specification wins.
- EU 2035 ICE sales phase-out
- WHO ~1.3M annual road deaths
- Public procurement ~12% GDP (OECD)
- Standards early-entry = higher spec win probability
Workforce and industrial relations
Nation-specific labor policies and union dynamics shape plant productivity for Forvia, which employs about 125,000 people worldwide; political backing for reindustrialization (NextGenerationEU €723.8bn) can unlock grants for advanced manufacturing. Strikes or election-related disruptions in OEM hubs can delay assembly lines and cascade to Tier-1 suppliers. Active stakeholder engagement with unions and governments stabilizes operations and mitigates schedule risk.
- labor-policies: nation-specific rules drive staffing costs
- unions: influence productivity and strike risk
- grants: NextGenerationEU €723.8bn supports reindustrialization
- disruption-risk: strikes/elections ripple through supply chain
- mitigation: proactive stakeholder engagement
EU 55% CO2 cut + 2035 ICE ban, US $7,500 EV credit, China NEV ~40% drive capex & nearshoring
EU 55% CO2 cut target by 2030 and 2035 ICE ban force Forvia product shifts and capex reallocation.
US IRA offers up to $7,500 EV credit with domestic-content rules, altering supplier sourcing.
China NEV penetration ~40% in 2024 and semiconductor market ~$560B (2023) heighten supply-risk focus.
Forvia headcount ~125,000; political volatility requires nearshoring and policy monitoring.
| Metric | Value |
|---|---|
| EU ICE phase-out | 2035 |
| US EV credit | $7,500 |
| China NEV (2024) | ~40% |
| Forvia employees | ~125,000 |
What is included in the product
Detailed Word Document
Explores how Political, Economic, Social, Technological, Environmental and Legal forces uniquely impact Forvia—an automotive systems supplier—linking each factor to current market and regulatory trends across its key regions. Designed for executives and advisors, it provides data-backed, forward-looking insights to identify strategic risks and opportunities.
Customizable Excel Spreadsheet
Forvia PESTLE Analysis condenses external risks and market drivers into a visually segmented, easy-to-share summary for rapid team alignment and presentation use, with editable notes to tailor insights to specific regions or business lines for faster decision-making.
Economic factors
Auto production cycles
Global light-vehicle builds recovered to about 80 million units in 2024, directly driving Forvia volumes across Seating, Interiors, Clean Mobility and Electronics. Policy rates remain elevated in 2025 (Fed funds ~5.25%, ECB ~4%), weighing on consumer confidence and OEM inventory-led scheduling. Downcycles compress pricing and capacity utilization; flexible cost structures and a resilient program mix are critical to protect margins.
Input cost inflation
Input-cost inflation for Forvia is driven by swings in steel, plastics, energy and semiconductor pricing that have pushed BOM costs — e.g., global hot-rolled coil and polymer markets saw multi‑quarter volatility and semiconductor lead times spiking above 40 weeks in 2021–22. Indexation clauses and design‑to‑cost programs allow passthrough of increases with a lag, typically one to four quarters. European plants face outsized energy risk after TTF gas peaked near €345/MWh in Aug 2022, while long‑term supply contracts and efficiency programs have helped protect margins.
Currency fluctuations
Forvia’s revenues and costs span EUR, USD, CNY and other currencies, with pro forma group sales around €20bn (2023), creating material FX risk. Currency mismatches between sourcing in Asia and sales in Europe/North America can erode margins during adverse moves. Active hedging and natural offsets (local sourcing, invoicing) are essential. Regionalized production and local content strategies reduce FX volatility exposure.
Electrification and mix shift
IEA reports EVs reached 14% of global passenger car sales in 2023, shifting value from exhaust aftertreatment toward electronics and interiors; Forvia must pivot its portfolio to high-growth cockpit electronics, lighting and thermal comfort while keeping ICE/hybrid capabilities for mixed fleets. Capital allocation will follow margin and growth pools, favoring electronics-intensive segments.
- EV penetration: 14% (IEA 2023)
- Value shift: exhaust → electronics/interiors
- Priority: cockpit electronics, lighting, thermal comfort
- Requirement: parallel ICE/hybrid/BEV capabilities
- Capital: directed to margin/growth pools
OEM pricing pressure
Automakers demand 3–5% annual cost-downs and productivity gains, forcing suppliers into tighter RFQ competition that compresses margins and favors scale and innovation. Demonstrable TCO and sustainability benefits raise win rates materially, while platform standardization can unlock up to 20% unit-cost savings, privileging suppliers with broad, scalable footprints and advanced engineering.
- OEM cost-down targets: 3–5% p.a.
- Platform savings: up to 20%
- Competitive RFQs: margin compression — favors scale
- TCO/sustainability: higher win rates
EU 55% CO2 cut + 2035 ICE ban, US $7,500 EV credit, China NEV ~40% drive capex & nearshoring
Global light-vehicle builds ~80m in 2024, supporting Forvia volumes; policy rates stay elevated in 2025 (Fed ~5.25%, ECB ~4%), pressuring demand. Input-cost volatility (steel, polymers, energy, semiconductors) and OEM 3–5% cost-down targets compress margins; pro forma sales ~€20bn (2023) create material FX exposure. EVs 14% of global sales (IEA 2023) shift value toward electronics and interiors, directing capital to those pools.
| Metric | Value |
|---|---|
| Global builds 2024 | ~80m |
| Forvia pro forma sales 2023 | €20bn |
| EV share 2023 | 14% |
| Fed funds 2025 | ~5.25% |
| ECB 2025 | ~4% |
Full Version Awaits
Forvia PESTLE Analysis
This Forvia PESTLE Analysis preview is the exact document you’ll receive after purchase—fully formatted and ready to use. The layout, content, and structure shown here are exactly what you’ll be able to download immediately after buying. No placeholders, no teasers—this is the real, final file, ready for analysis and presentation.
Original: $10.00
-65%$10.00
$3.50Description
Plan Smarter. Present Sharper. Compete Stronger.
Get a competitive edge with our targeted PESTLE analysis of Forvia. Learn how political, economic and technological shifts affect its strategy and risk profile. Perfect for investors and strategists, this ready-made report saves time. Purchase the full analysis for actionable, exportable insights.
Political factors
EV incentives and industrial policy
Government subsidies and industrial strategy—EU Green Deal targets a 55% GHG cut by 2030 and an EU-wide ban on new ICE car sales from 2035, the U.S. IRA offers up to $7,500 EV tax credits with domestic content rules, and China saw ~40% NEV penetration in 2024—drive OEM roadmaps and sourcing; sudden phase-outs or volatility force Forvia to align bids and capacity to policy-driven volume swings.
Trade tariffs and localization
Tariffs on autos and components, including 25% US Section 301 levies on many Chinese parts and USMCA rules-of-origin requiring up to 75% North American content for duty-free autos, shape Forvia plant footprints and sourcing. Localization mandates are driving regional plants and supplier bases, raising capex and working-capital needs. Sudden tariff shifts can compress margins or force redesigns; strategic dual-sourcing and flexible logistics mitigate exposure.
Geopolitical supply risk
Geopolitical tensions disrupting semiconductors, rare earths and energy threaten Forvia: the global semiconductor market was about $560B in 2023 while China supplies roughly 60% of refined rare earths, and EU gas dependence fell to ~17% in 2023 after 2022 shocks. Sanctions and export controls (notably 2023 chip curbs) can constrain critical sensors; Forvia needs political-risk monitoring, inventory buffers, diversified sourcing and nearshoring.
Public procurement and safety priorities
Governments are prioritizing road safety, emissions and resilience—EU rules phase out tailpipe CO2 from new cars by 2035 and WHO reports ~1.3 million road deaths annually—driving demand for ADAS interfaces, advanced lighting and clean mobility. Public procurement (~12% of GDP in OECD) and funding cycles affect revenue timing; early standard engagement can secure specification wins.
- EU 2035 ICE sales phase-out
- WHO ~1.3M annual road deaths
- Public procurement ~12% GDP (OECD)
- Standards early-entry = higher spec win probability
Workforce and industrial relations
Nation-specific labor policies and union dynamics shape plant productivity for Forvia, which employs about 125,000 people worldwide; political backing for reindustrialization (NextGenerationEU €723.8bn) can unlock grants for advanced manufacturing. Strikes or election-related disruptions in OEM hubs can delay assembly lines and cascade to Tier-1 suppliers. Active stakeholder engagement with unions and governments stabilizes operations and mitigates schedule risk.
- labor-policies: nation-specific rules drive staffing costs
- unions: influence productivity and strike risk
- grants: NextGenerationEU €723.8bn supports reindustrialization
- disruption-risk: strikes/elections ripple through supply chain
- mitigation: proactive stakeholder engagement
EU 55% CO2 cut + 2035 ICE ban, US $7,500 EV credit, China NEV ~40% drive capex & nearshoring
EU 55% CO2 cut target by 2030 and 2035 ICE ban force Forvia product shifts and capex reallocation.
US IRA offers up to $7,500 EV credit with domestic-content rules, altering supplier sourcing.
China NEV penetration ~40% in 2024 and semiconductor market ~$560B (2023) heighten supply-risk focus.
Forvia headcount ~125,000; political volatility requires nearshoring and policy monitoring.
| Metric | Value |
|---|---|
| EU ICE phase-out | 2035 |
| US EV credit | $7,500 |
| China NEV (2024) | ~40% |
| Forvia employees | ~125,000 |
What is included in the product
Detailed Word Document
Explores how Political, Economic, Social, Technological, Environmental and Legal forces uniquely impact Forvia—an automotive systems supplier—linking each factor to current market and regulatory trends across its key regions. Designed for executives and advisors, it provides data-backed, forward-looking insights to identify strategic risks and opportunities.
Customizable Excel Spreadsheet
Forvia PESTLE Analysis condenses external risks and market drivers into a visually segmented, easy-to-share summary for rapid team alignment and presentation use, with editable notes to tailor insights to specific regions or business lines for faster decision-making.
Economic factors
Auto production cycles
Global light-vehicle builds recovered to about 80 million units in 2024, directly driving Forvia volumes across Seating, Interiors, Clean Mobility and Electronics. Policy rates remain elevated in 2025 (Fed funds ~5.25%, ECB ~4%), weighing on consumer confidence and OEM inventory-led scheduling. Downcycles compress pricing and capacity utilization; flexible cost structures and a resilient program mix are critical to protect margins.
Input cost inflation
Input-cost inflation for Forvia is driven by swings in steel, plastics, energy and semiconductor pricing that have pushed BOM costs — e.g., global hot-rolled coil and polymer markets saw multi‑quarter volatility and semiconductor lead times spiking above 40 weeks in 2021–22. Indexation clauses and design‑to‑cost programs allow passthrough of increases with a lag, typically one to four quarters. European plants face outsized energy risk after TTF gas peaked near €345/MWh in Aug 2022, while long‑term supply contracts and efficiency programs have helped protect margins.
Currency fluctuations
Forvia’s revenues and costs span EUR, USD, CNY and other currencies, with pro forma group sales around €20bn (2023), creating material FX risk. Currency mismatches between sourcing in Asia and sales in Europe/North America can erode margins during adverse moves. Active hedging and natural offsets (local sourcing, invoicing) are essential. Regionalized production and local content strategies reduce FX volatility exposure.
Electrification and mix shift
IEA reports EVs reached 14% of global passenger car sales in 2023, shifting value from exhaust aftertreatment toward electronics and interiors; Forvia must pivot its portfolio to high-growth cockpit electronics, lighting and thermal comfort while keeping ICE/hybrid capabilities for mixed fleets. Capital allocation will follow margin and growth pools, favoring electronics-intensive segments.
- EV penetration: 14% (IEA 2023)
- Value shift: exhaust → electronics/interiors
- Priority: cockpit electronics, lighting, thermal comfort
- Requirement: parallel ICE/hybrid/BEV capabilities
- Capital: directed to margin/growth pools
OEM pricing pressure
Automakers demand 3–5% annual cost-downs and productivity gains, forcing suppliers into tighter RFQ competition that compresses margins and favors scale and innovation. Demonstrable TCO and sustainability benefits raise win rates materially, while platform standardization can unlock up to 20% unit-cost savings, privileging suppliers with broad, scalable footprints and advanced engineering.
- OEM cost-down targets: 3–5% p.a.
- Platform savings: up to 20%
- Competitive RFQs: margin compression — favors scale
- TCO/sustainability: higher win rates
EU 55% CO2 cut + 2035 ICE ban, US $7,500 EV credit, China NEV ~40% drive capex & nearshoring
Global light-vehicle builds ~80m in 2024, supporting Forvia volumes; policy rates stay elevated in 2025 (Fed ~5.25%, ECB ~4%), pressuring demand. Input-cost volatility (steel, polymers, energy, semiconductors) and OEM 3–5% cost-down targets compress margins; pro forma sales ~€20bn (2023) create material FX exposure. EVs 14% of global sales (IEA 2023) shift value toward electronics and interiors, directing capital to those pools.
| Metric | Value |
|---|---|
| Global builds 2024 | ~80m |
| Forvia pro forma sales 2023 | €20bn |
| EV share 2023 | 14% |
| Fed funds 2025 | ~5.25% |
| ECB 2025 | ~4% |
Full Version Awaits
Forvia PESTLE Analysis
This Forvia PESTLE Analysis preview is the exact document you’ll receive after purchase—fully formatted and ready to use. The layout, content, and structure shown here are exactly what you’ll be able to download immediately after buying. No placeholders, no teasers—this is the real, final file, ready for analysis and presentation.











