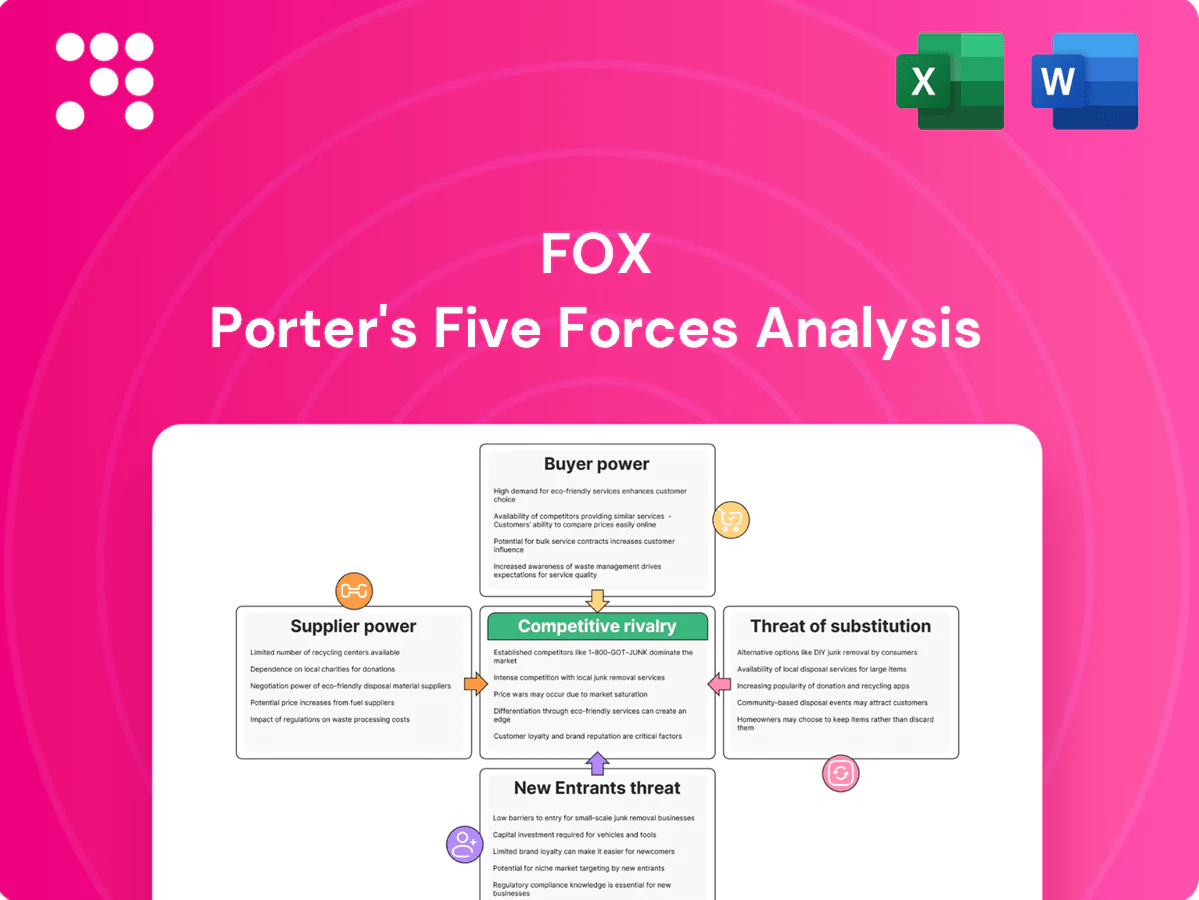
Fox Porter's Five Forces Analysis

From Overview to Strategy Blueprint
Fox’s Porter's Five Forces snapshot highlights competitive intensity, supplier and buyer pressures, substitute risks, and barriers to entry that shape profitability. It reveals where Fox holds leverage and where vulnerabilities lie. This brief overview only scratches the surface. Unlock the full Porter's Five Forces Analysis to explore Fox’s competitive dynamics and strategic implications in depth.
Suppliers Bargaining Power

Premium sports rights concentration
Leagues like the NFL and FIFA hold must-have packages that concentrate supplier power; NFL national rights were reported at about 110 billion dollars over an 11-year cycle (2023–2033), while FIFA’s 2019–2022 cycle generated roughly 6.1 billion dollars, driving intense auction bidding that inflates fees, ties broadcasters to long, inflationary contracts, and means losing a marquee package can sharply cut ratings and affiliate fee revenue.
Top talent and production guilds
On-air personalities, producers and unionized crews such as SAG-AFTRA (~160,000 members) and WGA (~11,500 members) command premium pay, driving Fox Porter’s cost base. The 2023 writers and actors strikes paused thousands of productions and were estimated to inflict over $2 billion in economic losses, highlighting disruption risk. Star departures can quickly erode news and sports audiences, reducing ad revenue. Contract renewals increasingly include above-inflation escalators tied to prevailing CPI.

Distribution platforms as gatekeepers
MVPDs, vMVPDs and device OS platforms act as distribution gatekeepers, shaping app placement and data access and dictating carriage and discoverability terms. In 2024 platform revenue splits remain up to 30% (15% under small‑business programs on Apple/Google), which carriers use to condition data sharing and ad terms. Algorithm changes can cut organic reach virtually overnight, and negotiations increasingly bundle distribution, advertising tech and measurement into single deals.

Technology vendors and ad-tech stacks
In 2024 Insider Intelligence estimated Google at ~38% and Meta at ~24% of US digital ad revenue, reflecting concentrated ad-serving, measurement, and streaming infrastructure vendors; switching costs and complex integrations (server-to-server, proprietary SDKs) deepen dependency. Vendor outages directly reduce CPMs and degrade UX. GDPR, CCPA and iOS ATT have narrowed vendor optionality and raised compliance costs.
- Concentration: Google ~38%, Meta ~24% (Insider Intelligence 2024)
- Risk: outages => immediate monetization/UX impact
- Barriers: high switching costs, integration complexity
- Constrainers: GDPR, CCPA, iOS ATT increase vendor lock-in
Independent content producers
Selective shows and live events from independent producers bring scarcity value and variety; hit makers increasingly demand favorable back-end and windowing terms. Competition from streamers drives bid pressure, while industry labor pools (SAG-AFTRA ~160,000 members in 2024) constrain supply. Fox’s sizable in-house production partially mitigates exposure.
- Scarcity value: premium pricing
- Hit-maker leverage: back-end/windowing
- Streamer bids: higher competition
- Mitigation: in-house production
Supplier power surges: must-have league rights, strong unions and ad-tech concentration
Supplier power is high: leagues hold must-have rights (NFL ~$110B 2023–33; FIFA ~$6.1B 2019–22) that drive bidding and long contracts. Talent unions (SAG‑AFTRA ~160,000; WGA ~11,500) and 2023 strikes (> $2B economic loss) raise costs and disruption risk. Platforms concentrate ad/tech (Google ~38%, Meta ~24% 2024), charge up to 30% and impose integration/regulatory burdens.
| Supplier | Metric | Figure |
|---|---|---|
| Leagues | NFL rights | $110B (2023–33) |
| Leagues | FIFA cycle | $6.1B (2019–22) |
| Talent | SAG‑AFTRA / WGA | 160,000 / 11,500 |
| Platforms | Market share / fees | Google 38% / Meta 24%; fees up to 30% |
| Risk | Strike loss | > $2B (2023) |
What is included in the product
 Detailed Word Document
Concise Porter’s Five Forces analysis of Fox, revealing competitive intensity, buyer/supplier power, threat of entrants and substitutes, and strategic levers to defend market share.

 Customizable Excel Spreadsheet
Rapidly spot competitive bottlenecks with a single-sheet Fox Porter Five Forces view—customizable pressure levels and a clean radar chart make strategic gaps and relief actions obvious for faster decisions.
Customers Bargaining Power

MVPD/vMVPD carriage negotiators
Large distributors like Comcast, Charter and YouTube TV aggregate millions of viewers—YouTube TV reported roughly 5 million subscribers—letting them resist affiliate fee hikes and push for skinny bundles. Blackout risks make brinkmanship costly: both sides face ad and subscription revenue losses during disputes. Accelerating cord-cutting shifts leverage further to distributors, intensifying the tug-of-war over pricing and packaging.
Advertisers seeking ROI and data
Marketers routinely benchmark Fox inventory against digital platforms on reach and performance, favoring channels that deliver measurable ROI and audience-level attribution. Demand for addressable, measurable ads depresses rates for non-targeted linear and scatter inventory as programmatic buying now represents about 75% of U.S. display ad spend. Scatter market softness can quickly flow through CPMs, while Google and Meta together account for roughly 60% of U.S. digital ad spend, increasing buyer choice and price sensitivity.

Local advertisers at stations
Regional businesses remain highly price sensitive and budget-constrained, limiting negotiating flexibility for stations; local ad buyers often prioritize cost-effective digital channels as local digital ad spend grew about 8% in 2024. Political cycles produce pronounced volatility, with local TV demand and pricing swinging roughly 20–40% around election peaks. Competing local media and programmatic digital options increase buyer alternatives, yet Fox sports and news lead-ins still command CPM premiums up to about 2.5x in key DMAs.

Sports fans as end-consumers
Sports fans prize exclusive rights but readily churn across bundles and apps; a 2024 survey found 70% of fans prioritize exclusives when subscribing. Rising subscription costs (average bundle price growth ~12% y/y in 2024) increased elasticity and switch risk. Piracy and short-form highlights cut full-game viewing materially, while superior production and companion content can partially offset churn.
- Exclusive rights: retention driver
- Price sensitivity: higher churn risk
- Piracy/highlights: reduces full-game consumption
- Production/companion content: mitigates customer power
News audiences with partisan preferences
News audiences with partisan preferences show strong loyalty—Fox averaged about 1.2 million primetime viewers in 2024 (Nielsen)—but loyalty shifts quickly with perceived credibility and tone; trust shocks have caused rapid ratings swings. Competing outlets and digital creators fragment attention, while personalization and community features (comments, subscriptions) can soften buyer leverage by increasing switching costs and engagement.
- High loyalty: ~1.2M primetime (2024 Nielsen)
- Trust shocks → rapid ratings swings
- Fragmentation: rivals + creators split attention
- Personalization/community reduce churn
Distributors resisting fee hikes as cord‑cutting and programmatic ad shift squeeze linear rates
Distributors (Comcast, Charter, YouTube TV ~5M subs) command leverage, resisting fee hikes as cord‑cutting and ~12% y/y bundle price growth raise churn risk. Advertisers shift to programmatic (~75% of US display spend) and Google+Meta (~60% digital spend), depressing linear rates. Local buyers are price sensitive (local digital ad spend +8% in 2024) while Fox primetime ~1.2M adds loyalty value.
| Metric | 2024 |
|---|---|
| YouTube TV subs | ~5M |
| Programmatic share (display) | ~75% |
| Google+Meta digital spend | ~60% |
| Local digital ad growth | +8% |
| Fox primetime | ~1.2M |
Preview Before You Purchase
Fox Porter's Five Forces Analysis
This preview shows the exact Fox Porter Five Forces analysis you'll receive immediately after purchase—no placeholders or mockups. The document is fully formatted, professionally written and ready for download and use the moment you buy. What you see is what you'll get.

From Overview to Strategy Blueprint
Fox’s Porter's Five Forces snapshot highlights competitive intensity, supplier and buyer pressures, substitute risks, and barriers to entry that shape profitability. It reveals where Fox holds leverage and where vulnerabilities lie. This brief overview only scratches the surface. Unlock the full Porter's Five Forces Analysis to explore Fox’s competitive dynamics and strategic implications in depth.
Suppliers Bargaining Power
Premium sports rights concentration
Leagues like the NFL and FIFA hold must-have packages that concentrate supplier power; NFL national rights were reported at about 110 billion dollars over an 11-year cycle (2023–2033), while FIFA’s 2019–2022 cycle generated roughly 6.1 billion dollars, driving intense auction bidding that inflates fees, ties broadcasters to long, inflationary contracts, and means losing a marquee package can sharply cut ratings and affiliate fee revenue.
Top talent and production guilds
On-air personalities, producers and unionized crews such as SAG-AFTRA (~160,000 members) and WGA (~11,500 members) command premium pay, driving Fox Porter’s cost base. The 2023 writers and actors strikes paused thousands of productions and were estimated to inflict over $2 billion in economic losses, highlighting disruption risk. Star departures can quickly erode news and sports audiences, reducing ad revenue. Contract renewals increasingly include above-inflation escalators tied to prevailing CPI.
Distribution platforms as gatekeepers
MVPDs, vMVPDs and device OS platforms act as distribution gatekeepers, shaping app placement and data access and dictating carriage and discoverability terms. In 2024 platform revenue splits remain up to 30% (15% under small‑business programs on Apple/Google), which carriers use to condition data sharing and ad terms. Algorithm changes can cut organic reach virtually overnight, and negotiations increasingly bundle distribution, advertising tech and measurement into single deals.
Technology vendors and ad-tech stacks
In 2024 Insider Intelligence estimated Google at ~38% and Meta at ~24% of US digital ad revenue, reflecting concentrated ad-serving, measurement, and streaming infrastructure vendors; switching costs and complex integrations (server-to-server, proprietary SDKs) deepen dependency. Vendor outages directly reduce CPMs and degrade UX. GDPR, CCPA and iOS ATT have narrowed vendor optionality and raised compliance costs.
- Concentration: Google ~38%, Meta ~24% (Insider Intelligence 2024)
- Risk: outages => immediate monetization/UX impact
- Barriers: high switching costs, integration complexity
- Constrainers: GDPR, CCPA, iOS ATT increase vendor lock-in
Independent content producers
Selective shows and live events from independent producers bring scarcity value and variety; hit makers increasingly demand favorable back-end and windowing terms. Competition from streamers drives bid pressure, while industry labor pools (SAG-AFTRA ~160,000 members in 2024) constrain supply. Fox’s sizable in-house production partially mitigates exposure.
- Scarcity value: premium pricing
- Hit-maker leverage: back-end/windowing
- Streamer bids: higher competition
- Mitigation: in-house production
Supplier power surges: must-have league rights, strong unions and ad-tech concentration
Supplier power is high: leagues hold must-have rights (NFL ~$110B 2023–33; FIFA ~$6.1B 2019–22) that drive bidding and long contracts. Talent unions (SAG‑AFTRA ~160,000; WGA ~11,500) and 2023 strikes (> $2B economic loss) raise costs and disruption risk. Platforms concentrate ad/tech (Google ~38%, Meta ~24% 2024), charge up to 30% and impose integration/regulatory burdens.
| Supplier | Metric | Figure |
|---|---|---|
| Leagues | NFL rights | $110B (2023–33) |
| Leagues | FIFA cycle | $6.1B (2019–22) |
| Talent | SAG‑AFTRA / WGA | 160,000 / 11,500 |
| Platforms | Market share / fees | Google 38% / Meta 24%; fees up to 30% |
| Risk | Strike loss | > $2B (2023) |
What is included in the product
Detailed Word Document
Concise Porter’s Five Forces analysis of Fox, revealing competitive intensity, buyer/supplier power, threat of entrants and substitutes, and strategic levers to defend market share.
Customizable Excel Spreadsheet
Rapidly spot competitive bottlenecks with a single-sheet Fox Porter Five Forces view—customizable pressure levels and a clean radar chart make strategic gaps and relief actions obvious for faster decisions.
Customers Bargaining Power
MVPD/vMVPD carriage negotiators
Large distributors like Comcast, Charter and YouTube TV aggregate millions of viewers—YouTube TV reported roughly 5 million subscribers—letting them resist affiliate fee hikes and push for skinny bundles. Blackout risks make brinkmanship costly: both sides face ad and subscription revenue losses during disputes. Accelerating cord-cutting shifts leverage further to distributors, intensifying the tug-of-war over pricing and packaging.
Advertisers seeking ROI and data
Marketers routinely benchmark Fox inventory against digital platforms on reach and performance, favoring channels that deliver measurable ROI and audience-level attribution. Demand for addressable, measurable ads depresses rates for non-targeted linear and scatter inventory as programmatic buying now represents about 75% of U.S. display ad spend. Scatter market softness can quickly flow through CPMs, while Google and Meta together account for roughly 60% of U.S. digital ad spend, increasing buyer choice and price sensitivity.
Local advertisers at stations
Regional businesses remain highly price sensitive and budget-constrained, limiting negotiating flexibility for stations; local ad buyers often prioritize cost-effective digital channels as local digital ad spend grew about 8% in 2024. Political cycles produce pronounced volatility, with local TV demand and pricing swinging roughly 20–40% around election peaks. Competing local media and programmatic digital options increase buyer alternatives, yet Fox sports and news lead-ins still command CPM premiums up to about 2.5x in key DMAs.
Sports fans as end-consumers
Sports fans prize exclusive rights but readily churn across bundles and apps; a 2024 survey found 70% of fans prioritize exclusives when subscribing. Rising subscription costs (average bundle price growth ~12% y/y in 2024) increased elasticity and switch risk. Piracy and short-form highlights cut full-game viewing materially, while superior production and companion content can partially offset churn.
- Exclusive rights: retention driver
- Price sensitivity: higher churn risk
- Piracy/highlights: reduces full-game consumption
- Production/companion content: mitigates customer power
News audiences with partisan preferences
News audiences with partisan preferences show strong loyalty—Fox averaged about 1.2 million primetime viewers in 2024 (Nielsen)—but loyalty shifts quickly with perceived credibility and tone; trust shocks have caused rapid ratings swings. Competing outlets and digital creators fragment attention, while personalization and community features (comments, subscriptions) can soften buyer leverage by increasing switching costs and engagement.
- High loyalty: ~1.2M primetime (2024 Nielsen)
- Trust shocks → rapid ratings swings
- Fragmentation: rivals + creators split attention
- Personalization/community reduce churn
Distributors resisting fee hikes as cord‑cutting and programmatic ad shift squeeze linear rates
Distributors (Comcast, Charter, YouTube TV ~5M subs) command leverage, resisting fee hikes as cord‑cutting and ~12% y/y bundle price growth raise churn risk. Advertisers shift to programmatic (~75% of US display spend) and Google+Meta (~60% digital spend), depressing linear rates. Local buyers are price sensitive (local digital ad spend +8% in 2024) while Fox primetime ~1.2M adds loyalty value.
| Metric | 2024 |
|---|---|
| YouTube TV subs | ~5M |
| Programmatic share (display) | ~75% |
| Google+Meta digital spend | ~60% |
| Local digital ad growth | +8% |
| Fox primetime | ~1.2M |
Preview Before You Purchase
Fox Porter's Five Forces Analysis
This preview shows the exact Fox Porter Five Forces analysis you'll receive immediately after purchase—no placeholders or mockups. The document is fully formatted, professionally written and ready for download and use the moment you buy. What you see is what you'll get.
Original: $10.00
-65%$10.00
$3.50Description
From Overview to Strategy Blueprint
Fox’s Porter's Five Forces snapshot highlights competitive intensity, supplier and buyer pressures, substitute risks, and barriers to entry that shape profitability. It reveals where Fox holds leverage and where vulnerabilities lie. This brief overview only scratches the surface. Unlock the full Porter's Five Forces Analysis to explore Fox’s competitive dynamics and strategic implications in depth.
Suppliers Bargaining Power
Premium sports rights concentration
Leagues like the NFL and FIFA hold must-have packages that concentrate supplier power; NFL national rights were reported at about 110 billion dollars over an 11-year cycle (2023–2033), while FIFA’s 2019–2022 cycle generated roughly 6.1 billion dollars, driving intense auction bidding that inflates fees, ties broadcasters to long, inflationary contracts, and means losing a marquee package can sharply cut ratings and affiliate fee revenue.
Top talent and production guilds
On-air personalities, producers and unionized crews such as SAG-AFTRA (~160,000 members) and WGA (~11,500 members) command premium pay, driving Fox Porter’s cost base. The 2023 writers and actors strikes paused thousands of productions and were estimated to inflict over $2 billion in economic losses, highlighting disruption risk. Star departures can quickly erode news and sports audiences, reducing ad revenue. Contract renewals increasingly include above-inflation escalators tied to prevailing CPI.
Distribution platforms as gatekeepers
MVPDs, vMVPDs and device OS platforms act as distribution gatekeepers, shaping app placement and data access and dictating carriage and discoverability terms. In 2024 platform revenue splits remain up to 30% (15% under small‑business programs on Apple/Google), which carriers use to condition data sharing and ad terms. Algorithm changes can cut organic reach virtually overnight, and negotiations increasingly bundle distribution, advertising tech and measurement into single deals.
Technology vendors and ad-tech stacks
In 2024 Insider Intelligence estimated Google at ~38% and Meta at ~24% of US digital ad revenue, reflecting concentrated ad-serving, measurement, and streaming infrastructure vendors; switching costs and complex integrations (server-to-server, proprietary SDKs) deepen dependency. Vendor outages directly reduce CPMs and degrade UX. GDPR, CCPA and iOS ATT have narrowed vendor optionality and raised compliance costs.
- Concentration: Google ~38%, Meta ~24% (Insider Intelligence 2024)
- Risk: outages => immediate monetization/UX impact
- Barriers: high switching costs, integration complexity
- Constrainers: GDPR, CCPA, iOS ATT increase vendor lock-in
Independent content producers
Selective shows and live events from independent producers bring scarcity value and variety; hit makers increasingly demand favorable back-end and windowing terms. Competition from streamers drives bid pressure, while industry labor pools (SAG-AFTRA ~160,000 members in 2024) constrain supply. Fox’s sizable in-house production partially mitigates exposure.
- Scarcity value: premium pricing
- Hit-maker leverage: back-end/windowing
- Streamer bids: higher competition
- Mitigation: in-house production
Supplier power surges: must-have league rights, strong unions and ad-tech concentration
Supplier power is high: leagues hold must-have rights (NFL ~$110B 2023–33; FIFA ~$6.1B 2019–22) that drive bidding and long contracts. Talent unions (SAG‑AFTRA ~160,000; WGA ~11,500) and 2023 strikes (> $2B economic loss) raise costs and disruption risk. Platforms concentrate ad/tech (Google ~38%, Meta ~24% 2024), charge up to 30% and impose integration/regulatory burdens.
| Supplier | Metric | Figure |
|---|---|---|
| Leagues | NFL rights | $110B (2023–33) |
| Leagues | FIFA cycle | $6.1B (2019–22) |
| Talent | SAG‑AFTRA / WGA | 160,000 / 11,500 |
| Platforms | Market share / fees | Google 38% / Meta 24%; fees up to 30% |
| Risk | Strike loss | > $2B (2023) |
What is included in the product
Detailed Word Document
Concise Porter’s Five Forces analysis of Fox, revealing competitive intensity, buyer/supplier power, threat of entrants and substitutes, and strategic levers to defend market share.
Customizable Excel Spreadsheet
Rapidly spot competitive bottlenecks with a single-sheet Fox Porter Five Forces view—customizable pressure levels and a clean radar chart make strategic gaps and relief actions obvious for faster decisions.
Customers Bargaining Power
MVPD/vMVPD carriage negotiators
Large distributors like Comcast, Charter and YouTube TV aggregate millions of viewers—YouTube TV reported roughly 5 million subscribers—letting them resist affiliate fee hikes and push for skinny bundles. Blackout risks make brinkmanship costly: both sides face ad and subscription revenue losses during disputes. Accelerating cord-cutting shifts leverage further to distributors, intensifying the tug-of-war over pricing and packaging.
Advertisers seeking ROI and data
Marketers routinely benchmark Fox inventory against digital platforms on reach and performance, favoring channels that deliver measurable ROI and audience-level attribution. Demand for addressable, measurable ads depresses rates for non-targeted linear and scatter inventory as programmatic buying now represents about 75% of U.S. display ad spend. Scatter market softness can quickly flow through CPMs, while Google and Meta together account for roughly 60% of U.S. digital ad spend, increasing buyer choice and price sensitivity.
Local advertisers at stations
Regional businesses remain highly price sensitive and budget-constrained, limiting negotiating flexibility for stations; local ad buyers often prioritize cost-effective digital channels as local digital ad spend grew about 8% in 2024. Political cycles produce pronounced volatility, with local TV demand and pricing swinging roughly 20–40% around election peaks. Competing local media and programmatic digital options increase buyer alternatives, yet Fox sports and news lead-ins still command CPM premiums up to about 2.5x in key DMAs.
Sports fans as end-consumers
Sports fans prize exclusive rights but readily churn across bundles and apps; a 2024 survey found 70% of fans prioritize exclusives when subscribing. Rising subscription costs (average bundle price growth ~12% y/y in 2024) increased elasticity and switch risk. Piracy and short-form highlights cut full-game viewing materially, while superior production and companion content can partially offset churn.
- Exclusive rights: retention driver
- Price sensitivity: higher churn risk
- Piracy/highlights: reduces full-game consumption
- Production/companion content: mitigates customer power
News audiences with partisan preferences
News audiences with partisan preferences show strong loyalty—Fox averaged about 1.2 million primetime viewers in 2024 (Nielsen)—but loyalty shifts quickly with perceived credibility and tone; trust shocks have caused rapid ratings swings. Competing outlets and digital creators fragment attention, while personalization and community features (comments, subscriptions) can soften buyer leverage by increasing switching costs and engagement.
- High loyalty: ~1.2M primetime (2024 Nielsen)
- Trust shocks → rapid ratings swings
- Fragmentation: rivals + creators split attention
- Personalization/community reduce churn
Distributors resisting fee hikes as cord‑cutting and programmatic ad shift squeeze linear rates
Distributors (Comcast, Charter, YouTube TV ~5M subs) command leverage, resisting fee hikes as cord‑cutting and ~12% y/y bundle price growth raise churn risk. Advertisers shift to programmatic (~75% of US display spend) and Google+Meta (~60% digital spend), depressing linear rates. Local buyers are price sensitive (local digital ad spend +8% in 2024) while Fox primetime ~1.2M adds loyalty value.
| Metric | 2024 |
|---|---|
| YouTube TV subs | ~5M |
| Programmatic share (display) | ~75% |
| Google+Meta digital spend | ~60% |
| Local digital ad growth | +8% |
| Fox primetime | ~1.2M |
Preview Before You Purchase
Fox Porter's Five Forces Analysis
This preview shows the exact Fox Porter Five Forces analysis you'll receive immediately after purchase—no placeholders or mockups. The document is fully formatted, professionally written and ready for download and use the moment you buy. What you see is what you'll get.











