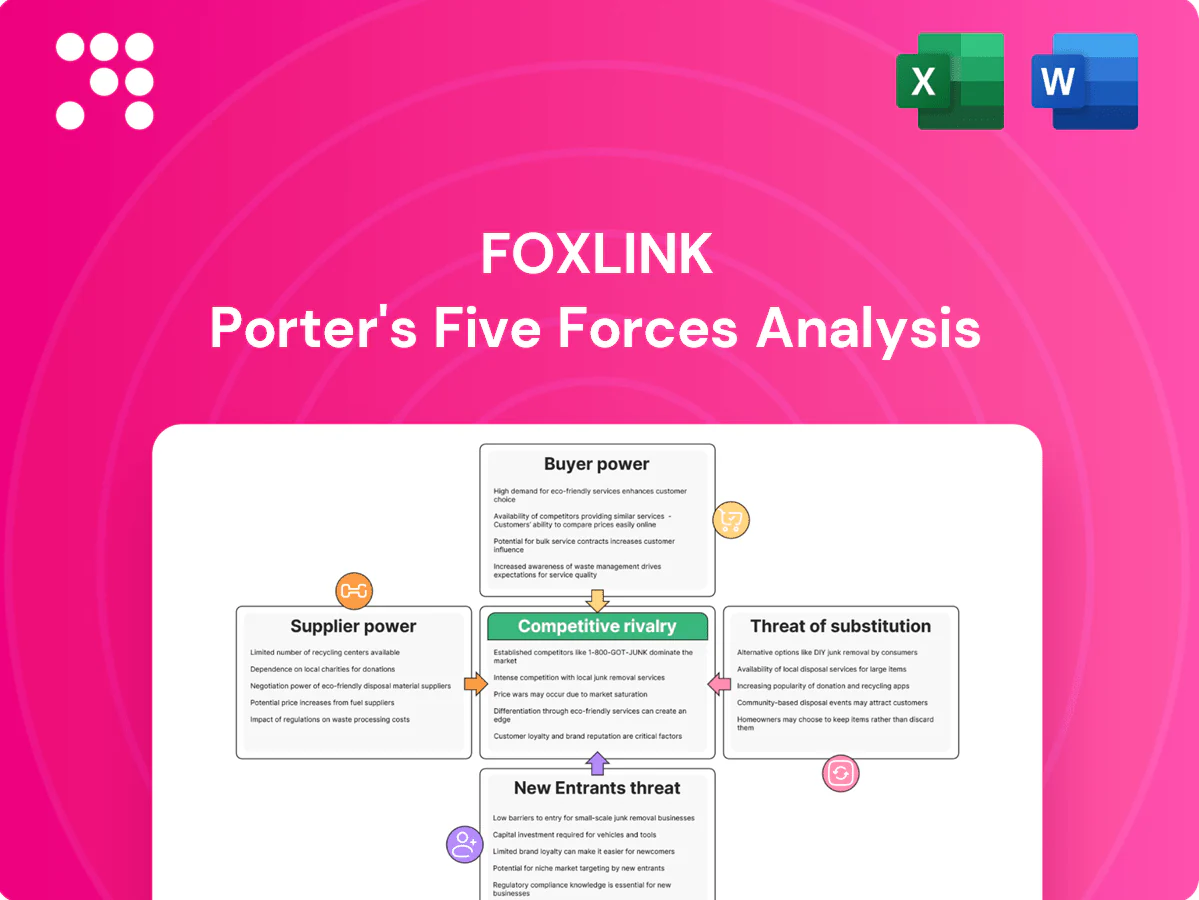
Foxlink Porter's Five Forces Analysis

Go Beyond the Preview—Access the Full Strategic Report
Foxlink’s Porter's Five Forces snapshot highlights strong supplier leverage, moderate buyer power, and rising substitute and entrant threats shaped by rapid tech shifts. Competitive rivalry is intense due to thin margins and scale-driven contracts. This brief teases strategic implications and risks. Unlock the full Porter's Five Forces Analysis for force-by-force ratings, visuals, and actionable recommendations.
Suppliers Bargaining Power

Diverse but specialized materials
Foxlink sources broad categories like copper alloys and general resins from competitive markets while relying on a small set of niche vendors for specialty resins, high-reliability plating chemistries and micro-stamping tools, creating supplier leverage over performance-critical inputs in 2024. This split keeps commodity inputs price-competitive but concentrates risk with unique-supply vendors. Managing BOM specifications toward widely available grades and approved vendor lists reduces exposure and bargaining pressure.
Regional concentration risk
Suppliers clustered across Taiwan, China and broader Asia expose Foxlink to geopolitical and logistics shocks, with Asia accounting for roughly 75% of global electronics manufacturing output in 2024, concentrating risk. Disruptions can raise input costs and lead times, increasing supplier leverage and margin pressure. Diversifying geographies, inventory buffers and near‑shoring automotive programs can rebalance power, though critical‑path items keep vulnerability elevated.

Scale procurement leverage
Foxlink’s scale across connectors, cable assemblies and power products positions it as a top-10 supplier in the global connector ecosystem (global connector market ~US$75 billion in 2024), enabling bulk buying and multi-category bundling. Aggregated demand drives supplier cost-down roadmaps and annual rebate programs that materially reduce input costs. Cross-plant sourcing and should-cost analytics further weaken supplier bargaining power on commoditized inputs.

Qualification-driven switching costs
Qualification-driven switching costs are high in automotive and high-speed interconnects because stringent validation (IATF 16949/PPAP) and requalification commonly take 6–18 months, raising time and cost to requalify materials or tools. Suppliers of pre-qualified inputs gain pricing and allocation leverage, as seen in 2021–2023 allocation events. Long requalification cycles limit rapid substitution during shortages; early dual-qualification in NPI mitigates lock-in.
- Requalification time: 6–18 months
- Standards: IATF 16949/PPAP
- Leverage: pricing & allocation during 2021–2023 shortages
- Mitigation: dual-qualify in NPI
Vertical integration and LTAs
Foxlink’s in-house tooling, molding and assembly capability reduces dependency on upstream vendors, shifting bargaining leverage toward the firm and lowering outsourced spend and lead-time exposure.
Long-term agreements and vendor-managed inventory programs stabilize pricing and supply, transferring inventory and some demand risk back to suppliers and capping short-term volatility.
Continuous value engineering and multi-year contracts preserve supplier balance over time, enabling predictable margins and iterative cost reductions.
- In-house vertical integration: lowers vendor dependency
- LTAs + VMI: stabilize price and supply
- Risk transfer: caps volatility for Foxlink
- Value engineering: maintains multi-year balance
Concentrated suppliers heighten leverage in specialty resins, plating and micro-stamping; Asia risk
Foxlink faces concentrated supplier leverage for specialty resins, plating chemistries and micro-stamping tools in 2024 while commodity inputs remain price-competitive. Asia concentration and logistics risk (Asia ~75% of electronics output) and long requalification (6–18 months) increase supplier power; Foxlink scale (connector market ~US$75bn; Foxlink top‑10) plus in‑house tooling, LTAs and VMI mitigate pressure.
| Metric | Value (2024) |
|---|---|
| Asia share of electronics output | ~75% |
| Global connector market | ~US$75bn |
| Requalification time | 6–18 months |
| Foxlink market position | Top‑10 |
What is included in the product
 Detailed Word Document
Uncovers key drivers of competition and customer influence tailored exclusively for Foxlink, evaluating supplier and buyer power, barriers to entry, substitutes, and disruptive threats with strategic commentary to inform pricing, profitability, and market defense.

 Customizable Excel Spreadsheet
A concise one-sheet Porter's Five Forces for Foxlink—instantly highlights competitive pressures, supplier/buyer risks and substitute threats with an editable radar chart; customizable force levels and clean layout make it deck-ready and decision-friendly without macros.
Customers Bargaining Power

Concentrated OEM customer base
Global OEMs in consumer, communications and automotive buy very high volumes and negotiate aggressively, leveraging scale and multi-sourcing to extract price concessions; Gartner reports global smartphone shipments around 1.17 billion units in 2024, underpinning buyer clout. Consolidated purchasing and increased use of e-auctions compress supplier margins. Strategic account management and joint product roadmaps are essential to retain share.
Price transparency and RFQ intensity
Connector and cable buyers run quarterly benchmark RFQs with routine cost-downs of 3–8% per cycle; over 50% of SKUs are commoditized, letting buyers pit suppliers against each other and keeping ASPs compressed by roughly 2–6% annually. This dynamic favors low-cost producers in the ≈$70B global connector market (2024), while rigorous cost modeling and design-to-cost programs typically recover 1–3 percentage points of margin.

Design-in creates lock-in
Custom interconnects co-developed and qualified into end-products create strong design-in lock-in for Foxlink, raising buyers switching costs through change-control, tooling and compliance hurdles. Once designed-in, buyers often concede price for guaranteed volume and longevity, and strong NPI collaboration converts supplier advantage into long-term stickiness. Foxlink trades on TWSE as 2392, underscoring its strategic market position.

Quality and compliance leverage
Automotive-grade IATF 16949 and PPAP compliance plus safety and environmental rules give buyers veto power over suppliers; failures cause line stoppages, recalls and fines, so OEMs enforce strict SLAs. Buyers use these risks to demand penalties and service metrics, while superior quality (target <50 ppm in auto) reduces switching threats. Proactive APQP and zero-defect programs materially strengthen Foxlink's negotiating position.
- IATF/PPAP required
- Target <50 ppm
- APQP + zero-defect
Lead-time and service differentiation
Rapid proto-to-mass ramps, flexible MOQs and global logistics reduce buyer leverage by shortening lead-times and smoothing supply transitions, easing price pressure. Consignment stock, regional hubs and EDI integration add operational value beyond unit cost, lowering buyers total landed cost. Reliable OTIF performance and engineering support win share from buyers, and consistent service excellence buffers aggressive pricing demands.
OEM scale, 1.17B phones and $70B connector market squeeze margins
Global OEMs buy huge volumes and multi-source, driving price concessions; smartphone shipments ~1.17B (2024) and connector market ≈$70B (2024) amplify buyer clout. Quarterly RFQs force 3–8% cost-downs; >50% SKUs commoditized, keeping ASPs down ~2–6% annually. Design-in, IATF/PPAP and APQP reduce switching and grant Foxlink pricing power in automotive with target <50 ppm.
| Metric | Value | Impact |
|---|---|---|
| Smartphone shipments (2024) | 1.17B | High buyer leverage |
| Connector market (2024) | $70B | Price competition |
| RFQ cost-downs | 3–8%/cycle | Margin pressure |
| Commoditized SKUs | >50% | ASPs -2–6%/yr |
| Auto defect target | <50 ppm | Reduced switching |
Full Version Awaits
Foxlink Porter's Five Forces Analysis
This preview shows the exact Foxlink Porter's Five Forces Analysis you'll receive immediately after purchase—no placeholders or mockups. The file is fully formatted, professionally written, and ready for download and use the moment you buy. You're viewing the final deliverable, identical to the document provided upon payment.

Go Beyond the Preview—Access the Full Strategic Report
Foxlink’s Porter's Five Forces snapshot highlights strong supplier leverage, moderate buyer power, and rising substitute and entrant threats shaped by rapid tech shifts. Competitive rivalry is intense due to thin margins and scale-driven contracts. This brief teases strategic implications and risks. Unlock the full Porter's Five Forces Analysis for force-by-force ratings, visuals, and actionable recommendations.
Suppliers Bargaining Power
Diverse but specialized materials
Foxlink sources broad categories like copper alloys and general resins from competitive markets while relying on a small set of niche vendors for specialty resins, high-reliability plating chemistries and micro-stamping tools, creating supplier leverage over performance-critical inputs in 2024. This split keeps commodity inputs price-competitive but concentrates risk with unique-supply vendors. Managing BOM specifications toward widely available grades and approved vendor lists reduces exposure and bargaining pressure.
Regional concentration risk
Suppliers clustered across Taiwan, China and broader Asia expose Foxlink to geopolitical and logistics shocks, with Asia accounting for roughly 75% of global electronics manufacturing output in 2024, concentrating risk. Disruptions can raise input costs and lead times, increasing supplier leverage and margin pressure. Diversifying geographies, inventory buffers and near‑shoring automotive programs can rebalance power, though critical‑path items keep vulnerability elevated.
Scale procurement leverage
Foxlink’s scale across connectors, cable assemblies and power products positions it as a top-10 supplier in the global connector ecosystem (global connector market ~US$75 billion in 2024), enabling bulk buying and multi-category bundling. Aggregated demand drives supplier cost-down roadmaps and annual rebate programs that materially reduce input costs. Cross-plant sourcing and should-cost analytics further weaken supplier bargaining power on commoditized inputs.
Qualification-driven switching costs
Qualification-driven switching costs are high in automotive and high-speed interconnects because stringent validation (IATF 16949/PPAP) and requalification commonly take 6–18 months, raising time and cost to requalify materials or tools. Suppliers of pre-qualified inputs gain pricing and allocation leverage, as seen in 2021–2023 allocation events. Long requalification cycles limit rapid substitution during shortages; early dual-qualification in NPI mitigates lock-in.
- Requalification time: 6–18 months
- Standards: IATF 16949/PPAP
- Leverage: pricing & allocation during 2021–2023 shortages
- Mitigation: dual-qualify in NPI
Vertical integration and LTAs
Foxlink’s in-house tooling, molding and assembly capability reduces dependency on upstream vendors, shifting bargaining leverage toward the firm and lowering outsourced spend and lead-time exposure.
Long-term agreements and vendor-managed inventory programs stabilize pricing and supply, transferring inventory and some demand risk back to suppliers and capping short-term volatility.
Continuous value engineering and multi-year contracts preserve supplier balance over time, enabling predictable margins and iterative cost reductions.
- In-house vertical integration: lowers vendor dependency
- LTAs + VMI: stabilize price and supply
- Risk transfer: caps volatility for Foxlink
- Value engineering: maintains multi-year balance
Concentrated suppliers heighten leverage in specialty resins, plating and micro-stamping; Asia risk
Foxlink faces concentrated supplier leverage for specialty resins, plating chemistries and micro-stamping tools in 2024 while commodity inputs remain price-competitive. Asia concentration and logistics risk (Asia ~75% of electronics output) and long requalification (6–18 months) increase supplier power; Foxlink scale (connector market ~US$75bn; Foxlink top‑10) plus in‑house tooling, LTAs and VMI mitigate pressure.
| Metric | Value (2024) |
|---|---|
| Asia share of electronics output | ~75% |
| Global connector market | ~US$75bn |
| Requalification time | 6–18 months |
| Foxlink market position | Top‑10 |
What is included in the product
Detailed Word Document
Uncovers key drivers of competition and customer influence tailored exclusively for Foxlink, evaluating supplier and buyer power, barriers to entry, substitutes, and disruptive threats with strategic commentary to inform pricing, profitability, and market defense.
Customizable Excel Spreadsheet
A concise one-sheet Porter's Five Forces for Foxlink—instantly highlights competitive pressures, supplier/buyer risks and substitute threats with an editable radar chart; customizable force levels and clean layout make it deck-ready and decision-friendly without macros.
Customers Bargaining Power
Concentrated OEM customer base
Global OEMs in consumer, communications and automotive buy very high volumes and negotiate aggressively, leveraging scale and multi-sourcing to extract price concessions; Gartner reports global smartphone shipments around 1.17 billion units in 2024, underpinning buyer clout. Consolidated purchasing and increased use of e-auctions compress supplier margins. Strategic account management and joint product roadmaps are essential to retain share.
Price transparency and RFQ intensity
Connector and cable buyers run quarterly benchmark RFQs with routine cost-downs of 3–8% per cycle; over 50% of SKUs are commoditized, letting buyers pit suppliers against each other and keeping ASPs compressed by roughly 2–6% annually. This dynamic favors low-cost producers in the ≈$70B global connector market (2024), while rigorous cost modeling and design-to-cost programs typically recover 1–3 percentage points of margin.
Design-in creates lock-in
Custom interconnects co-developed and qualified into end-products create strong design-in lock-in for Foxlink, raising buyers switching costs through change-control, tooling and compliance hurdles. Once designed-in, buyers often concede price for guaranteed volume and longevity, and strong NPI collaboration converts supplier advantage into long-term stickiness. Foxlink trades on TWSE as 2392, underscoring its strategic market position.
Quality and compliance leverage
Automotive-grade IATF 16949 and PPAP compliance plus safety and environmental rules give buyers veto power over suppliers; failures cause line stoppages, recalls and fines, so OEMs enforce strict SLAs. Buyers use these risks to demand penalties and service metrics, while superior quality (target <50 ppm in auto) reduces switching threats. Proactive APQP and zero-defect programs materially strengthen Foxlink's negotiating position.
- IATF/PPAP required
- Target <50 ppm
- APQP + zero-defect
Lead-time and service differentiation
Rapid proto-to-mass ramps, flexible MOQs and global logistics reduce buyer leverage by shortening lead-times and smoothing supply transitions, easing price pressure. Consignment stock, regional hubs and EDI integration add operational value beyond unit cost, lowering buyers total landed cost. Reliable OTIF performance and engineering support win share from buyers, and consistent service excellence buffers aggressive pricing demands.
OEM scale, 1.17B phones and $70B connector market squeeze margins
Global OEMs buy huge volumes and multi-source, driving price concessions; smartphone shipments ~1.17B (2024) and connector market ≈$70B (2024) amplify buyer clout. Quarterly RFQs force 3–8% cost-downs; >50% SKUs commoditized, keeping ASPs down ~2–6% annually. Design-in, IATF/PPAP and APQP reduce switching and grant Foxlink pricing power in automotive with target <50 ppm.
| Metric | Value | Impact |
|---|---|---|
| Smartphone shipments (2024) | 1.17B | High buyer leverage |
| Connector market (2024) | $70B | Price competition |
| RFQ cost-downs | 3–8%/cycle | Margin pressure |
| Commoditized SKUs | >50% | ASPs -2–6%/yr |
| Auto defect target | <50 ppm | Reduced switching |
Full Version Awaits
Foxlink Porter's Five Forces Analysis
This preview shows the exact Foxlink Porter's Five Forces Analysis you'll receive immediately after purchase—no placeholders or mockups. The file is fully formatted, professionally written, and ready for download and use the moment you buy. You're viewing the final deliverable, identical to the document provided upon payment.
Original: $10.00
-65%$10.00
$3.50Description
Go Beyond the Preview—Access the Full Strategic Report
Foxlink’s Porter's Five Forces snapshot highlights strong supplier leverage, moderate buyer power, and rising substitute and entrant threats shaped by rapid tech shifts. Competitive rivalry is intense due to thin margins and scale-driven contracts. This brief teases strategic implications and risks. Unlock the full Porter's Five Forces Analysis for force-by-force ratings, visuals, and actionable recommendations.
Suppliers Bargaining Power
Diverse but specialized materials
Foxlink sources broad categories like copper alloys and general resins from competitive markets while relying on a small set of niche vendors for specialty resins, high-reliability plating chemistries and micro-stamping tools, creating supplier leverage over performance-critical inputs in 2024. This split keeps commodity inputs price-competitive but concentrates risk with unique-supply vendors. Managing BOM specifications toward widely available grades and approved vendor lists reduces exposure and bargaining pressure.
Regional concentration risk
Suppliers clustered across Taiwan, China and broader Asia expose Foxlink to geopolitical and logistics shocks, with Asia accounting for roughly 75% of global electronics manufacturing output in 2024, concentrating risk. Disruptions can raise input costs and lead times, increasing supplier leverage and margin pressure. Diversifying geographies, inventory buffers and near‑shoring automotive programs can rebalance power, though critical‑path items keep vulnerability elevated.
Scale procurement leverage
Foxlink’s scale across connectors, cable assemblies and power products positions it as a top-10 supplier in the global connector ecosystem (global connector market ~US$75 billion in 2024), enabling bulk buying and multi-category bundling. Aggregated demand drives supplier cost-down roadmaps and annual rebate programs that materially reduce input costs. Cross-plant sourcing and should-cost analytics further weaken supplier bargaining power on commoditized inputs.
Qualification-driven switching costs
Qualification-driven switching costs are high in automotive and high-speed interconnects because stringent validation (IATF 16949/PPAP) and requalification commonly take 6–18 months, raising time and cost to requalify materials or tools. Suppliers of pre-qualified inputs gain pricing and allocation leverage, as seen in 2021–2023 allocation events. Long requalification cycles limit rapid substitution during shortages; early dual-qualification in NPI mitigates lock-in.
- Requalification time: 6–18 months
- Standards: IATF 16949/PPAP
- Leverage: pricing & allocation during 2021–2023 shortages
- Mitigation: dual-qualify in NPI
Vertical integration and LTAs
Foxlink’s in-house tooling, molding and assembly capability reduces dependency on upstream vendors, shifting bargaining leverage toward the firm and lowering outsourced spend and lead-time exposure.
Long-term agreements and vendor-managed inventory programs stabilize pricing and supply, transferring inventory and some demand risk back to suppliers and capping short-term volatility.
Continuous value engineering and multi-year contracts preserve supplier balance over time, enabling predictable margins and iterative cost reductions.
- In-house vertical integration: lowers vendor dependency
- LTAs + VMI: stabilize price and supply
- Risk transfer: caps volatility for Foxlink
- Value engineering: maintains multi-year balance
Concentrated suppliers heighten leverage in specialty resins, plating and micro-stamping; Asia risk
Foxlink faces concentrated supplier leverage for specialty resins, plating chemistries and micro-stamping tools in 2024 while commodity inputs remain price-competitive. Asia concentration and logistics risk (Asia ~75% of electronics output) and long requalification (6–18 months) increase supplier power; Foxlink scale (connector market ~US$75bn; Foxlink top‑10) plus in‑house tooling, LTAs and VMI mitigate pressure.
| Metric | Value (2024) |
|---|---|
| Asia share of electronics output | ~75% |
| Global connector market | ~US$75bn |
| Requalification time | 6–18 months |
| Foxlink market position | Top‑10 |
What is included in the product
Detailed Word Document
Uncovers key drivers of competition and customer influence tailored exclusively for Foxlink, evaluating supplier and buyer power, barriers to entry, substitutes, and disruptive threats with strategic commentary to inform pricing, profitability, and market defense.
Customizable Excel Spreadsheet
A concise one-sheet Porter's Five Forces for Foxlink—instantly highlights competitive pressures, supplier/buyer risks and substitute threats with an editable radar chart; customizable force levels and clean layout make it deck-ready and decision-friendly without macros.
Customers Bargaining Power
Concentrated OEM customer base
Global OEMs in consumer, communications and automotive buy very high volumes and negotiate aggressively, leveraging scale and multi-sourcing to extract price concessions; Gartner reports global smartphone shipments around 1.17 billion units in 2024, underpinning buyer clout. Consolidated purchasing and increased use of e-auctions compress supplier margins. Strategic account management and joint product roadmaps are essential to retain share.
Price transparency and RFQ intensity
Connector and cable buyers run quarterly benchmark RFQs with routine cost-downs of 3–8% per cycle; over 50% of SKUs are commoditized, letting buyers pit suppliers against each other and keeping ASPs compressed by roughly 2–6% annually. This dynamic favors low-cost producers in the ≈$70B global connector market (2024), while rigorous cost modeling and design-to-cost programs typically recover 1–3 percentage points of margin.
Design-in creates lock-in
Custom interconnects co-developed and qualified into end-products create strong design-in lock-in for Foxlink, raising buyers switching costs through change-control, tooling and compliance hurdles. Once designed-in, buyers often concede price for guaranteed volume and longevity, and strong NPI collaboration converts supplier advantage into long-term stickiness. Foxlink trades on TWSE as 2392, underscoring its strategic market position.
Quality and compliance leverage
Automotive-grade IATF 16949 and PPAP compliance plus safety and environmental rules give buyers veto power over suppliers; failures cause line stoppages, recalls and fines, so OEMs enforce strict SLAs. Buyers use these risks to demand penalties and service metrics, while superior quality (target <50 ppm in auto) reduces switching threats. Proactive APQP and zero-defect programs materially strengthen Foxlink's negotiating position.
- IATF/PPAP required
- Target <50 ppm
- APQP + zero-defect
Lead-time and service differentiation
Rapid proto-to-mass ramps, flexible MOQs and global logistics reduce buyer leverage by shortening lead-times and smoothing supply transitions, easing price pressure. Consignment stock, regional hubs and EDI integration add operational value beyond unit cost, lowering buyers total landed cost. Reliable OTIF performance and engineering support win share from buyers, and consistent service excellence buffers aggressive pricing demands.
OEM scale, 1.17B phones and $70B connector market squeeze margins
Global OEMs buy huge volumes and multi-source, driving price concessions; smartphone shipments ~1.17B (2024) and connector market ≈$70B (2024) amplify buyer clout. Quarterly RFQs force 3–8% cost-downs; >50% SKUs commoditized, keeping ASPs down ~2–6% annually. Design-in, IATF/PPAP and APQP reduce switching and grant Foxlink pricing power in automotive with target <50 ppm.
| Metric | Value | Impact |
|---|---|---|
| Smartphone shipments (2024) | 1.17B | High buyer leverage |
| Connector market (2024) | $70B | Price competition |
| RFQ cost-downs | 3–8%/cycle | Margin pressure |
| Commoditized SKUs | >50% | ASPs -2–6%/yr |
| Auto defect target | <50 ppm | Reduced switching |
Full Version Awaits
Foxlink Porter's Five Forces Analysis
This preview shows the exact Foxlink Porter's Five Forces Analysis you'll receive immediately after purchase—no placeholders or mockups. The file is fully formatted, professionally written, and ready for download and use the moment you buy. You're viewing the final deliverable, identical to the document provided upon payment.











