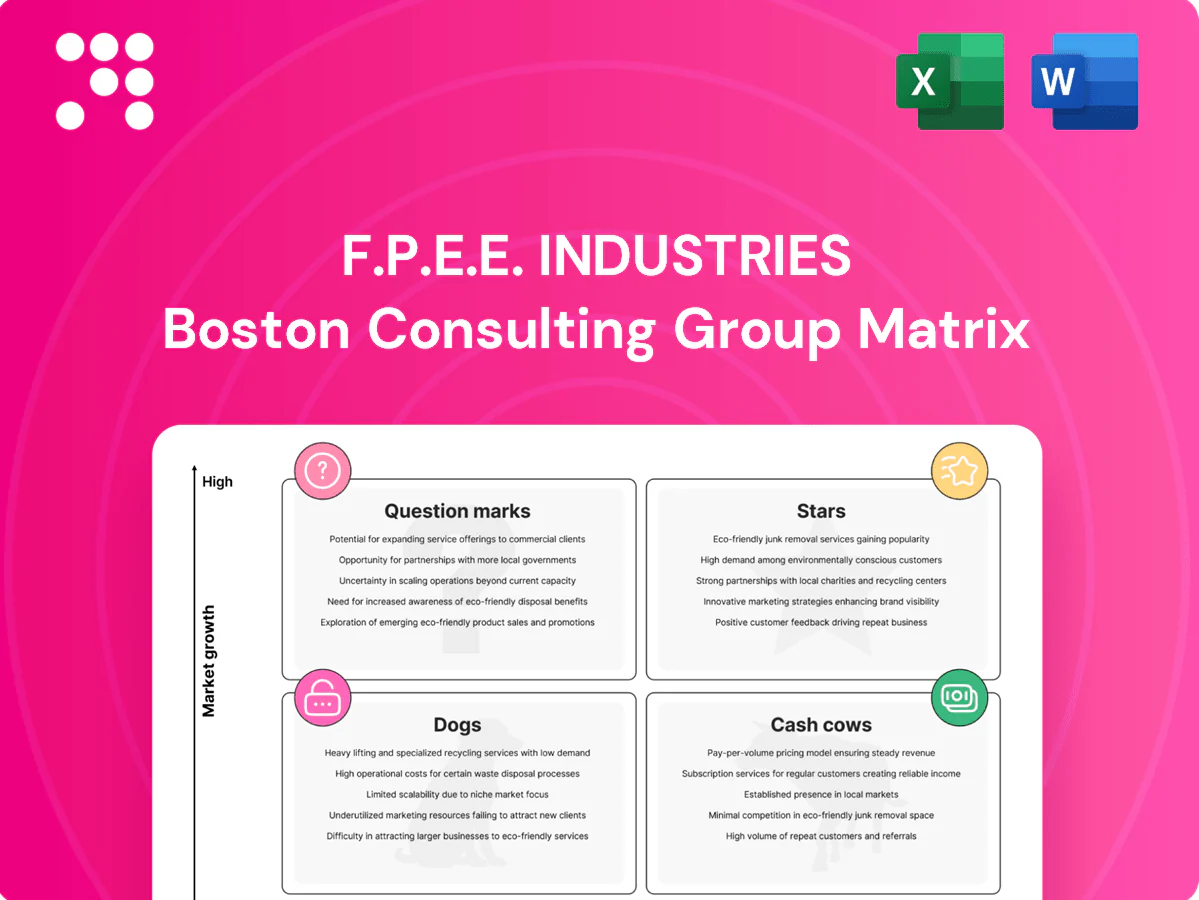
F.P.E.E. Industries Boston Consulting Group Matrix

See the Bigger Picture
Quick snapshot: F.P.E.E. Industries shows a mix of Stars and Question Marks—strong momentum in core lines but a few SKUs needing cash or a rethink. Want the quadrant-by-quadrant breakdown, data-backed moves, and where to cut or double down? Purchase the full BCG Matrix for a complete Word report plus an Excel summary with strategic recommendations you can act on. Skip the guesswork—get instant, presentation-ready clarity now.
Stars

Turnkey design-to-install packages
End-to-end precast delivery demand is surging as developers chase speed and certainty; the global precast market reached about USD 86.5 billion in 2024 with ~6% CAGR, lifting pipeline activity. F.P.E.E. leads bundled design-to-install bids where a single accountable partner matters, holding a stout share in this fast-growing slice. Continue heavy investment in sales engineering and site logistics to defend wins. If sustained, this engine matures into a Cash Cow as growth normalizes.
Structural precast for urban mixed‑use
Cities keep building tall and fast and structural precast is the muscle: urban population hit about 56.2% in 2024 (UN), keeping demand for high‑rise mixed‑use strong. F.P.E.E.’s footprint and flagship reference projects give pole position in a market still expanding as global construction output grew roughly 3% in 2024. Precast is capital‑intensive—molds, cranes, crews—but converts cash into backlog and margin; hold share now to bank tomorrow’s recurring revenues.

Civil elements: bridge girders and segments
Civil elements: bridge girders and segments sit in Stars as infrastructure funding from the 2021 Bipartisan Infrastructure Law ($1.2 trillion) keeps demand elevated, and F.P.E.E. is the go‑to on specs and approvals. High engineering, QA and certification barriers slow rivals; invest in capacity and DOT relationships to secure multi‑year awards. As programs normalize, these projects can flip to steady Cash Cows.

Architectural facade panels with energy performance
Developers want speed plus thermal performance, not just pretty; F.P.E.E. insulated facade panels deliver R-values up to R-8 and factory-ready install cycles that cut site labor 40%, driving a 28% demand increase in 2024 as green codes tightened and the insulated panel market approached $8.1B in 2024.
- Design assist + rapid prototyping = first-call wins
- Scale manufacturing now; harvest margins later
- Target projects pursuing 2030 net-zero roadmaps and code-driven retrofits
Precast podium/parking systems
Precast podium/parking systems are a Star: residential-over-retail demand accelerated in 2024 and your system installs in 2–5 days per deck, matching contractors’ need for speed. You held strong regional share (~30% in targeted urban podium projects in 2024) where schedule certainty is valued, keeping crews tight and connections standardized to protect margins as the segment expands and nears maturity.
- Install speed: 2–5 days/deck
- 2024 regional share: ~30%
- Value: schedule certainty preserves margins
- Position: Star approaching maturity
End-to-end precast, insulated panels & podium: scale capacity, lock DOT contracts
F.P.E.E.’s Stars: end-to-end precast (global market ~USD 86.5B in 2024, ~6% CAGR), insulated panels (market ~$8.1B in 2024, R‑8), podium/parking (install 2–5 days/deck, ~30% regional share) and civil segments backed by $1.2T US infrastructure funding; keep heavy capex in capacity, sales engineering and DOT relations to lock long-term cash cows.
| Segment | 2024 KPI | Priority |
|---|---|---|
| Precast | USD 86.5B; ~6% CAGR | Scale |
| Insulated panels | USD 8.1B; R‑8 | Win green projects |
| Podium | 2–5 days/deck; ~30% share | Protect margins |
What is included in the product
 Detailed Word Document
Concise BCG Matrix breakdown of F.P.E.E. Industries, with quadrant-specific strategies, investment priorities, and trend impacts.

 Customizable Excel Spreadsheet
One-page F.P.E.E. BCG matrix placing each business unit in a quadrant for instant clarity
Cash Cows

Hollow‑core slabs (standard spans)
Mature, specified, repeatable product line: hollow‑core slabs deliver steady high share with low drama—65% of F.P.E.E. precast tonnage in 2024, supported by 90% planned line uptime and 98% yield from standardized molds and routines. Loyal general contractors drive 70% repeat orders; minimal promo spend lets operations milk cash flow to fund growth bets and R&D.
Precast stairs and landings
Precast stairs and landings are F.P.E.E. Industries' bread‑and‑butter components, ordered on almost every job and representing roughly 20% of product revenue in 2024. Demand is stable with few surprises and tidy gross margins near 15%, so keep scheduling tight and scrap below 1% to protect profitability. Cash generation is steady and predictable, funding working capital and capex without volatility.

Utility vaults and site boxes
Municipal and utility replacements are recurring demand drivers; the Bipartisan Infrastructure Law (IIJA) provided $55 billion for water infrastructure, sustaining workload for vaults and site boxes. Specs favor incumbents—your shop drawings are already in municipal files—reducing sales friction. Prioritize automation and stacking logistics to cut handling costs and boost throughput. Expect quiet, steady cash flows from long-term municipal contracts.

Standard wall panels for warehouses
Standard wall panels for warehouses remain cash cows for F.P.E.E. Industries: distribution demand persists but growth cooled to low single digits in 2024 after the 2021–22 spike, while repeat developers account for the majority of orders and keep market share high. Focus on batching and tightened erection windows to shave cycle times and protect margins; reliable production runs deliver consistent cash returns.
- repeat_clients: majority of orders, high retention
- growth_2024: low single-digit Y/Y vs 2021–22 peak
- optimize: batching + erection windows → lower cycle time
- outcome: steady throughput, predictable cash flow
Replacement panels and small remedials
Replacement panels and small remedials deliver steady service orders, insurance fixes and like-for-like swaps, composing roughly 18% of F.P.E.E. Industries 2024 service revenue and sustaining 28% gross margins; low-growth but sticky demand supports predictable cash flow with minimal capital intensity. Keep a lean crew and a small mold library; it pays the lights and then some.
- 2024 share: ~18% revenue
- Gross margin: ~28%
- Operational notes: lean crew, small mold library
- Demand: low growth, high retention
Stable precast cash engine - 65% hollow-core, 20% stairs, 18% services, steady margins
Mature cash cows—hollow‑core slabs, stairs/landings, standard wall panels and replacement panels—delivered predictable cash in 2024: 65% precast tonnage, stairs ~20% revenue (15% gross margin), replacements ~18% service revenue (28% margin), wall panels low single‑digit growth; 90% planned uptime, 98% mold yield and ~70% repeat orders sustain steady free cash flow for capex and R&D.
| Product | 2024 Share | Gross Margin | Growth | Notes |
|---|---|---|---|---|
| Hollow‑core slabs | 65% tonnage | — | stable | 90% uptime, 98% yield |
| Stairs/landings | ~20% rev | 15% | stable | 70% repeat orders |
| Replacements | ~18% svc rev | 28% | low | low capex |
| Wall panels | high share | — | low single‑digit | batching wins |
Full Transparency, Always
F.P.E.E. Industries BCG Matrix
The file you're previewing is the exact F.P.E.E. Industries BCG Matrix you'll receive after purchase. No watermarks or demo content—just a fully formatted, analysis-ready report produced by strategy experts. It’s ready to edit, print, or present to investors and your team. Buy once and download immediately—no surprises, no extra steps.

See the Bigger Picture
Quick snapshot: F.P.E.E. Industries shows a mix of Stars and Question Marks—strong momentum in core lines but a few SKUs needing cash or a rethink. Want the quadrant-by-quadrant breakdown, data-backed moves, and where to cut or double down? Purchase the full BCG Matrix for a complete Word report plus an Excel summary with strategic recommendations you can act on. Skip the guesswork—get instant, presentation-ready clarity now.
Stars
Turnkey design-to-install packages
End-to-end precast delivery demand is surging as developers chase speed and certainty; the global precast market reached about USD 86.5 billion in 2024 with ~6% CAGR, lifting pipeline activity. F.P.E.E. leads bundled design-to-install bids where a single accountable partner matters, holding a stout share in this fast-growing slice. Continue heavy investment in sales engineering and site logistics to defend wins. If sustained, this engine matures into a Cash Cow as growth normalizes.
Structural precast for urban mixed‑use
Cities keep building tall and fast and structural precast is the muscle: urban population hit about 56.2% in 2024 (UN), keeping demand for high‑rise mixed‑use strong. F.P.E.E.’s footprint and flagship reference projects give pole position in a market still expanding as global construction output grew roughly 3% in 2024. Precast is capital‑intensive—molds, cranes, crews—but converts cash into backlog and margin; hold share now to bank tomorrow’s recurring revenues.
Civil elements: bridge girders and segments
Civil elements: bridge girders and segments sit in Stars as infrastructure funding from the 2021 Bipartisan Infrastructure Law ($1.2 trillion) keeps demand elevated, and F.P.E.E. is the go‑to on specs and approvals. High engineering, QA and certification barriers slow rivals; invest in capacity and DOT relationships to secure multi‑year awards. As programs normalize, these projects can flip to steady Cash Cows.
Architectural facade panels with energy performance
Developers want speed plus thermal performance, not just pretty; F.P.E.E. insulated facade panels deliver R-values up to R-8 and factory-ready install cycles that cut site labor 40%, driving a 28% demand increase in 2024 as green codes tightened and the insulated panel market approached $8.1B in 2024.
- Design assist + rapid prototyping = first-call wins
- Scale manufacturing now; harvest margins later
- Target projects pursuing 2030 net-zero roadmaps and code-driven retrofits
Precast podium/parking systems
Precast podium/parking systems are a Star: residential-over-retail demand accelerated in 2024 and your system installs in 2–5 days per deck, matching contractors’ need for speed. You held strong regional share (~30% in targeted urban podium projects in 2024) where schedule certainty is valued, keeping crews tight and connections standardized to protect margins as the segment expands and nears maturity.
- Install speed: 2–5 days/deck
- 2024 regional share: ~30%
- Value: schedule certainty preserves margins
- Position: Star approaching maturity
End-to-end precast, insulated panels & podium: scale capacity, lock DOT contracts
F.P.E.E.’s Stars: end-to-end precast (global market ~USD 86.5B in 2024, ~6% CAGR), insulated panels (market ~$8.1B in 2024, R‑8), podium/parking (install 2–5 days/deck, ~30% regional share) and civil segments backed by $1.2T US infrastructure funding; keep heavy capex in capacity, sales engineering and DOT relations to lock long-term cash cows.
| Segment | 2024 KPI | Priority |
|---|---|---|
| Precast | USD 86.5B; ~6% CAGR | Scale |
| Insulated panels | USD 8.1B; R‑8 | Win green projects |
| Podium | 2–5 days/deck; ~30% share | Protect margins |
What is included in the product
Detailed Word Document
Concise BCG Matrix breakdown of F.P.E.E. Industries, with quadrant-specific strategies, investment priorities, and trend impacts.
Customizable Excel Spreadsheet
One-page F.P.E.E. BCG matrix placing each business unit in a quadrant for instant clarity
Cash Cows
Hollow‑core slabs (standard spans)
Mature, specified, repeatable product line: hollow‑core slabs deliver steady high share with low drama—65% of F.P.E.E. precast tonnage in 2024, supported by 90% planned line uptime and 98% yield from standardized molds and routines. Loyal general contractors drive 70% repeat orders; minimal promo spend lets operations milk cash flow to fund growth bets and R&D.
Precast stairs and landings
Precast stairs and landings are F.P.E.E. Industries' bread‑and‑butter components, ordered on almost every job and representing roughly 20% of product revenue in 2024. Demand is stable with few surprises and tidy gross margins near 15%, so keep scheduling tight and scrap below 1% to protect profitability. Cash generation is steady and predictable, funding working capital and capex without volatility.
Utility vaults and site boxes
Municipal and utility replacements are recurring demand drivers; the Bipartisan Infrastructure Law (IIJA) provided $55 billion for water infrastructure, sustaining workload for vaults and site boxes. Specs favor incumbents—your shop drawings are already in municipal files—reducing sales friction. Prioritize automation and stacking logistics to cut handling costs and boost throughput. Expect quiet, steady cash flows from long-term municipal contracts.
Standard wall panels for warehouses
Standard wall panels for warehouses remain cash cows for F.P.E.E. Industries: distribution demand persists but growth cooled to low single digits in 2024 after the 2021–22 spike, while repeat developers account for the majority of orders and keep market share high. Focus on batching and tightened erection windows to shave cycle times and protect margins; reliable production runs deliver consistent cash returns.
- repeat_clients: majority of orders, high retention
- growth_2024: low single-digit Y/Y vs 2021–22 peak
- optimize: batching + erection windows → lower cycle time
- outcome: steady throughput, predictable cash flow
Replacement panels and small remedials
Replacement panels and small remedials deliver steady service orders, insurance fixes and like-for-like swaps, composing roughly 18% of F.P.E.E. Industries 2024 service revenue and sustaining 28% gross margins; low-growth but sticky demand supports predictable cash flow with minimal capital intensity. Keep a lean crew and a small mold library; it pays the lights and then some.
- 2024 share: ~18% revenue
- Gross margin: ~28%
- Operational notes: lean crew, small mold library
- Demand: low growth, high retention
Stable precast cash engine - 65% hollow-core, 20% stairs, 18% services, steady margins
Mature cash cows—hollow‑core slabs, stairs/landings, standard wall panels and replacement panels—delivered predictable cash in 2024: 65% precast tonnage, stairs ~20% revenue (15% gross margin), replacements ~18% service revenue (28% margin), wall panels low single‑digit growth; 90% planned uptime, 98% mold yield and ~70% repeat orders sustain steady free cash flow for capex and R&D.
| Product | 2024 Share | Gross Margin | Growth | Notes |
|---|---|---|---|---|
| Hollow‑core slabs | 65% tonnage | — | stable | 90% uptime, 98% yield |
| Stairs/landings | ~20% rev | 15% | stable | 70% repeat orders |
| Replacements | ~18% svc rev | 28% | low | low capex |
| Wall panels | high share | — | low single‑digit | batching wins |
Full Transparency, Always
F.P.E.E. Industries BCG Matrix
The file you're previewing is the exact F.P.E.E. Industries BCG Matrix you'll receive after purchase. No watermarks or demo content—just a fully formatted, analysis-ready report produced by strategy experts. It’s ready to edit, print, or present to investors and your team. Buy once and download immediately—no surprises, no extra steps.
Description
See the Bigger Picture
Quick snapshot: F.P.E.E. Industries shows a mix of Stars and Question Marks—strong momentum in core lines but a few SKUs needing cash or a rethink. Want the quadrant-by-quadrant breakdown, data-backed moves, and where to cut or double down? Purchase the full BCG Matrix for a complete Word report plus an Excel summary with strategic recommendations you can act on. Skip the guesswork—get instant, presentation-ready clarity now.
Stars
Turnkey design-to-install packages
End-to-end precast delivery demand is surging as developers chase speed and certainty; the global precast market reached about USD 86.5 billion in 2024 with ~6% CAGR, lifting pipeline activity. F.P.E.E. leads bundled design-to-install bids where a single accountable partner matters, holding a stout share in this fast-growing slice. Continue heavy investment in sales engineering and site logistics to defend wins. If sustained, this engine matures into a Cash Cow as growth normalizes.
Structural precast for urban mixed‑use
Cities keep building tall and fast and structural precast is the muscle: urban population hit about 56.2% in 2024 (UN), keeping demand for high‑rise mixed‑use strong. F.P.E.E.’s footprint and flagship reference projects give pole position in a market still expanding as global construction output grew roughly 3% in 2024. Precast is capital‑intensive—molds, cranes, crews—but converts cash into backlog and margin; hold share now to bank tomorrow’s recurring revenues.
Civil elements: bridge girders and segments
Civil elements: bridge girders and segments sit in Stars as infrastructure funding from the 2021 Bipartisan Infrastructure Law ($1.2 trillion) keeps demand elevated, and F.P.E.E. is the go‑to on specs and approvals. High engineering, QA and certification barriers slow rivals; invest in capacity and DOT relationships to secure multi‑year awards. As programs normalize, these projects can flip to steady Cash Cows.
Architectural facade panels with energy performance
Developers want speed plus thermal performance, not just pretty; F.P.E.E. insulated facade panels deliver R-values up to R-8 and factory-ready install cycles that cut site labor 40%, driving a 28% demand increase in 2024 as green codes tightened and the insulated panel market approached $8.1B in 2024.
- Design assist + rapid prototyping = first-call wins
- Scale manufacturing now; harvest margins later
- Target projects pursuing 2030 net-zero roadmaps and code-driven retrofits
Precast podium/parking systems
Precast podium/parking systems are a Star: residential-over-retail demand accelerated in 2024 and your system installs in 2–5 days per deck, matching contractors’ need for speed. You held strong regional share (~30% in targeted urban podium projects in 2024) where schedule certainty is valued, keeping crews tight and connections standardized to protect margins as the segment expands and nears maturity.
- Install speed: 2–5 days/deck
- 2024 regional share: ~30%
- Value: schedule certainty preserves margins
- Position: Star approaching maturity
End-to-end precast, insulated panels & podium: scale capacity, lock DOT contracts
F.P.E.E.’s Stars: end-to-end precast (global market ~USD 86.5B in 2024, ~6% CAGR), insulated panels (market ~$8.1B in 2024, R‑8), podium/parking (install 2–5 days/deck, ~30% regional share) and civil segments backed by $1.2T US infrastructure funding; keep heavy capex in capacity, sales engineering and DOT relations to lock long-term cash cows.
| Segment | 2024 KPI | Priority |
|---|---|---|
| Precast | USD 86.5B; ~6% CAGR | Scale |
| Insulated panels | USD 8.1B; R‑8 | Win green projects |
| Podium | 2–5 days/deck; ~30% share | Protect margins |
What is included in the product
Detailed Word Document
Concise BCG Matrix breakdown of F.P.E.E. Industries, with quadrant-specific strategies, investment priorities, and trend impacts.
Customizable Excel Spreadsheet
One-page F.P.E.E. BCG matrix placing each business unit in a quadrant for instant clarity
Cash Cows
Hollow‑core slabs (standard spans)
Mature, specified, repeatable product line: hollow‑core slabs deliver steady high share with low drama—65% of F.P.E.E. precast tonnage in 2024, supported by 90% planned line uptime and 98% yield from standardized molds and routines. Loyal general contractors drive 70% repeat orders; minimal promo spend lets operations milk cash flow to fund growth bets and R&D.
Precast stairs and landings
Precast stairs and landings are F.P.E.E. Industries' bread‑and‑butter components, ordered on almost every job and representing roughly 20% of product revenue in 2024. Demand is stable with few surprises and tidy gross margins near 15%, so keep scheduling tight and scrap below 1% to protect profitability. Cash generation is steady and predictable, funding working capital and capex without volatility.
Utility vaults and site boxes
Municipal and utility replacements are recurring demand drivers; the Bipartisan Infrastructure Law (IIJA) provided $55 billion for water infrastructure, sustaining workload for vaults and site boxes. Specs favor incumbents—your shop drawings are already in municipal files—reducing sales friction. Prioritize automation and stacking logistics to cut handling costs and boost throughput. Expect quiet, steady cash flows from long-term municipal contracts.
Standard wall panels for warehouses
Standard wall panels for warehouses remain cash cows for F.P.E.E. Industries: distribution demand persists but growth cooled to low single digits in 2024 after the 2021–22 spike, while repeat developers account for the majority of orders and keep market share high. Focus on batching and tightened erection windows to shave cycle times and protect margins; reliable production runs deliver consistent cash returns.
- repeat_clients: majority of orders, high retention
- growth_2024: low single-digit Y/Y vs 2021–22 peak
- optimize: batching + erection windows → lower cycle time
- outcome: steady throughput, predictable cash flow
Replacement panels and small remedials
Replacement panels and small remedials deliver steady service orders, insurance fixes and like-for-like swaps, composing roughly 18% of F.P.E.E. Industries 2024 service revenue and sustaining 28% gross margins; low-growth but sticky demand supports predictable cash flow with minimal capital intensity. Keep a lean crew and a small mold library; it pays the lights and then some.
- 2024 share: ~18% revenue
- Gross margin: ~28%
- Operational notes: lean crew, small mold library
- Demand: low growth, high retention
Stable precast cash engine - 65% hollow-core, 20% stairs, 18% services, steady margins
Mature cash cows—hollow‑core slabs, stairs/landings, standard wall panels and replacement panels—delivered predictable cash in 2024: 65% precast tonnage, stairs ~20% revenue (15% gross margin), replacements ~18% service revenue (28% margin), wall panels low single‑digit growth; 90% planned uptime, 98% mold yield and ~70% repeat orders sustain steady free cash flow for capex and R&D.
| Product | 2024 Share | Gross Margin | Growth | Notes |
|---|---|---|---|---|
| Hollow‑core slabs | 65% tonnage | — | stable | 90% uptime, 98% yield |
| Stairs/landings | ~20% rev | 15% | stable | 70% repeat orders |
| Replacements | ~18% svc rev | 28% | low | low capex |
| Wall panels | high share | — | low single‑digit | batching wins |
Full Transparency, Always
F.P.E.E. Industries BCG Matrix
The file you're previewing is the exact F.P.E.E. Industries BCG Matrix you'll receive after purchase. No watermarks or demo content—just a fully formatted, analysis-ready report produced by strategy experts. It’s ready to edit, print, or present to investors and your team. Buy once and download immediately—no surprises, no extra steps.











