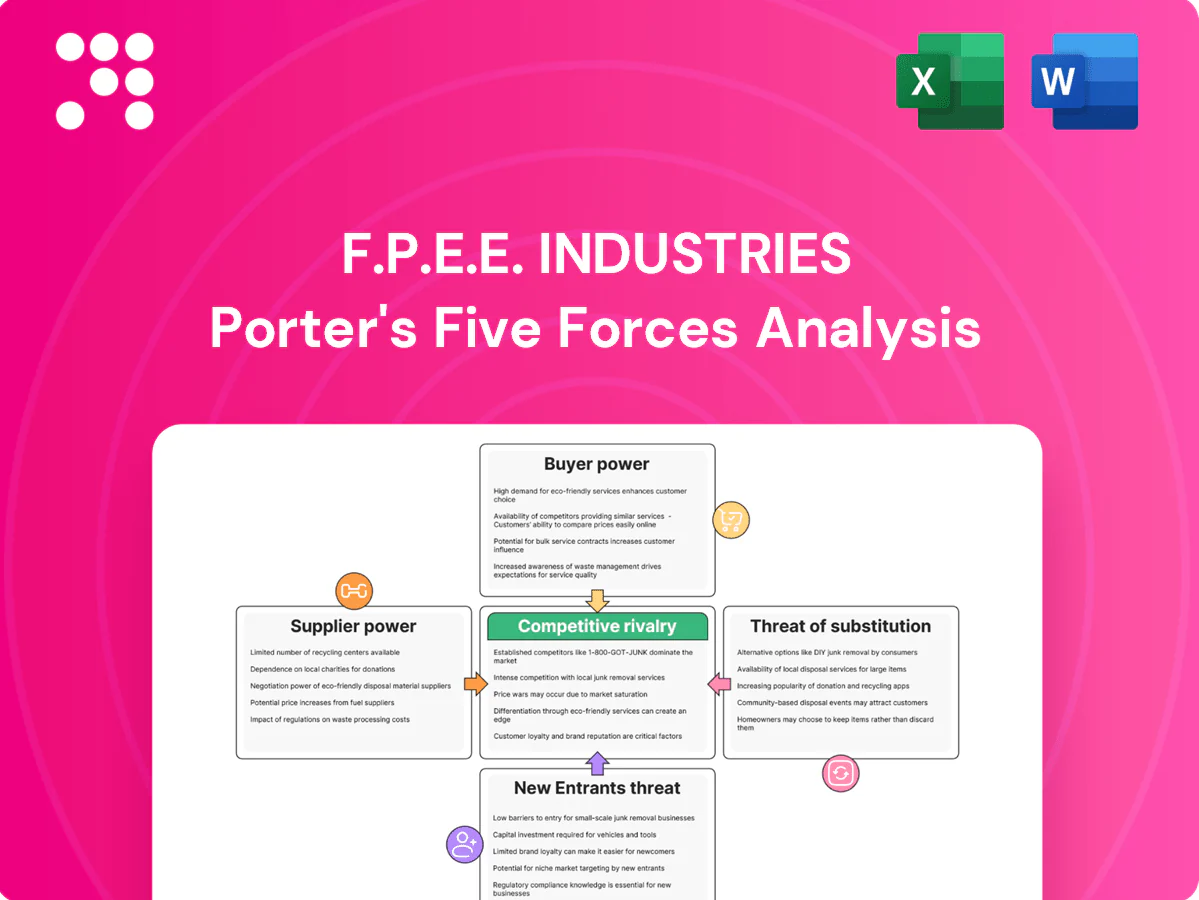
F.P.E.E. Industries Porter's Five Forces Analysis

Don't Miss the Bigger Picture
F.P.E.E. Industries faces moderate supplier power, rising buyer sophistication, and growing substitute threats that are reshaping margins and strategic priorities. Competitive rivalry intensifies as new entrants leverage technology to erode differentiation, while regulatory shifts add external pressure. This brief snapshot only scratches the surface—unlock the full Porter's Five Forces Analysis to explore force-by-force ratings, visuals, and actionable strategy guidance.
Suppliers Bargaining Power

Concentrated cement and admixture sources
Core inputs like cement, admixtures and specialty aggregates come from a concentrated supplier base—China accounts for roughly 55% of global cement production (2023–24), giving key suppliers pricing leverage. Supply disruptions or energy price spikes transmit quickly to costs, as seen in 2022–24 volatility in fuel-driven production costs. Long-term contracts and dual-sourcing reduce outage risk but limit flexibility, while qualification of alternatives needs testing and certification, slowing switches.
Steel rebar and hardware volatility
Rebar, prestressing strands and embedded hardware are exposed to global commodity cycles and trade barriers, notably the US Section 232 steel tariff (25%), enabling suppliers to pass through mill surcharges and tariffs that compress margins on fixed-price contracts. Inventory buffers and hedging mitigate volatility but lock up working capital and increase carrying costs. Design optimization to reduce steel intensity can materially offset supplier pricing power.

Special molds and formwork dependencies
As of 2024, custom molds and formwork often come from niche providers, creating switching frictions that give suppliers outsized influence. Lead times frequently run 6–16 weeks, directly affecting project schedules and timing leverage. Investing in in-house mold-making reduces dependency but requires capex typically in the $200k–$1.5M range and specialized skills. Standardizing across product families can cut supplier spend and takt variability by up to 25–30%.

Logistics and lifting equipment constraints
Logistics and lifting equipment constraints create strong supplier power as specialized haulage, cranes and escort services are capacity-constrained in peak seasons, causing premium pricing and scheduling risk in 2024. Transport weight/size permits and route restrictions amplify delays and rerouting costs. Limited alternatives give niche logistics providers leverage; early booking and bundled volumes improve rates and reliability.
- Specialized haulage scarcity
- Permit and route risk
- Price power to niche providers
- Early booking helps
Energy and environmental inputs
Power, fuel and SCMs (fly ash, slag) exert elevated supplier power due to regional scarcity from coal‑plant retirements and constrained logistics; markets tightened in 2023–24 lifting SCM premiums in several regions. Carbon compliance (EU ETS ~€90/t in 2024) and decarbonization credits shift bargaining toward low‑carbon suppliers. On‑site efficiency and PPAs (corporate renewables volumes rising) cut exposure; EPD‑backed mixes increase dependence on specific low‑carbon suppliers.
- SCM scarcity: regional constraints
- EU ETS: ~€90/t (2024)
- PPAs: reduce market exposure
- EPD mixes: higher supplier reliance
Cost squeeze: China ~55% cement, EU ETS €90/t
Concentrated inputs (China ~55% cement production) and 2022–24 fuel volatility give suppliers pricing leverage and rapid cost transmission. Steel tariffs (US Section 232 ~25%) and commodity cycles enable pass-through; rebar/molds face 6–16 week lead times and mold capex $200k–$1.5M. Logistics scarcity, permits and EU ETS ~€90/t (2024) shift power toward niche and low‑carbon suppliers.
| Input | 2024 stat | Implication |
|---|---|---|
| Cement | China ~55% | High price leverage |
| Steel | Tariff ~25% | Pass-through risk |
| Molds | Lead 6–16w | Schedule risk |
| Carbon | EU ETS ~€90/t | Low‑carbon dependence |
What is included in the product
 Detailed Word Document
Comprehensive Porter's Five Forces analysis tailored to F.P.E.E. Industries, uncovering competitive drivers, supplier and buyer power, substitutes, and entry threats that shape pricing and profitability; identifies disruptive forces and strategic barriers protecting incumbency. Delivered in fully editable Word format for use in investor materials, strategy decks, business plans, or academic projects.

 Customizable Excel Spreadsheet
F.P.E.E. Industries Porter's Five Forces delivers a clean one-sheet summary and spider chart for instant strategic clarity, customizable pressure levels and labels for evolving markets, no macros so non-finance users can edit easily, and a deck-ready layout that integrates into reports or dashboards to relieve analysis bottlenecks.
Customers Bargaining Power

Large contractors aggregate demand
General contractors, developers and public agencies place sizable, project-based orders—EU public procurement alone accounted for about 14% of GDP in 2024—enabling tough negotiations and volume leverage. Competitive tendering intensifies price pressure and tighter payment terms. Prequalification and proven track records defend margins via non-price criteria. Value-added design-assist can shift selection away from lowest bid.
Design-in lowers switching
Design-in raises switching costs because once precast is engineered into a project, redesign and approvals commonly add 5–15% to contract value and can delay delivery weeks to months. Early engagement captures specifications and reduces buyer leverage by embedding requirements. Buyers still solicit alternate designs to induce price tension. Clear technical differentiation and documented performance sustain lock-in without excessive discounting.

Price transparency and benchmarks

Quality, safety, ESG requirements
Public and blue-chip buyers now routinely mandate certifications, EPDs, and strong safety records, narrowing the pool of qualified suppliers and accelerating gatekeeping; by 2024 the EU CSRD extends ESG reporting to roughly 50,000 companies, increasing buyer expectations. Compliance reduces buyer options and raises switching costs, while demonstrable superior ESG performance weakens buyer price pressure; non-compliance rapidly disqualifies vendors.
Payment terms and risk transfer
Buyers increasingly push retention (commonly 5–10% in US heavy-civil 2024), extended payment terms (30–90 days) and liquidated damages (often $1,000–$10,000/day on large infrastructure projects), shifting cash and performance risk; turnkey install obligations move interface risk onto the precaster. Milestone billing, backed by performance bonds (bond premiums ~0.5–3%), and strong project controls and claims management protect margins and mitigate cash strain.
- Retention: 5–10%
- Payment terms: 30–90 days
- Liquidated damages: $1,000–$10,000/day
- Bond premiums: 0.5–3%
- Mitigants: milestone billing, bonding, controls, claims management
Buyers use tenders to press prices; design-assist wins 3–7% premiums
Buyers exert strong project-level leverage via large, competitive tenders (EU public procurement ~14% of GDP in 2024), using benchmarking and 2024 material-index volatility up to 12% to press prices. Design-in, certifications and CSRD (~50,000 EU firms) raise switching costs, while buyers push retentions (5–10%), 30–90 day terms and liquidated damages ($1,000–$10,000/day). Value-added design-assist and guarantees (3–7% premium) and milestone billing mitigate buyer power.
| Metric | 2024 Value |
|---|---|
| EU public procurement | ~14% GDP |
| Material index volatility | up to 12% |
| Retention | 5–10% |
| Payment terms | 30–90 days |
| Liquidated damages | $1,000–$10,000/day |
| Bond premiums | 0.5–3% |
| CSRD coverage | ~50,000 firms |
| Price premium for guarantees | 3–7% |
Preview Before You Purchase
F.P.E.E. Industries Porter's Five Forces Analysis
The F.P.E.E. Industries Porter’s Five Forces analysis evaluates competitive rivalry, threat of new entrants, bargaining power of suppliers and buyers, and threat of substitutes, highlighting strategic threats and opportunities. It offers actionable insights and implications for pricing, margins, and entry barriers. This preview shows the exact document you'll receive—fully formatted and ready to download immediately after purchase.

Don't Miss the Bigger Picture
F.P.E.E. Industries faces moderate supplier power, rising buyer sophistication, and growing substitute threats that are reshaping margins and strategic priorities. Competitive rivalry intensifies as new entrants leverage technology to erode differentiation, while regulatory shifts add external pressure. This brief snapshot only scratches the surface—unlock the full Porter's Five Forces Analysis to explore force-by-force ratings, visuals, and actionable strategy guidance.
Suppliers Bargaining Power
Concentrated cement and admixture sources
Core inputs like cement, admixtures and specialty aggregates come from a concentrated supplier base—China accounts for roughly 55% of global cement production (2023–24), giving key suppliers pricing leverage. Supply disruptions or energy price spikes transmit quickly to costs, as seen in 2022–24 volatility in fuel-driven production costs. Long-term contracts and dual-sourcing reduce outage risk but limit flexibility, while qualification of alternatives needs testing and certification, slowing switches.
Steel rebar and hardware volatility
Rebar, prestressing strands and embedded hardware are exposed to global commodity cycles and trade barriers, notably the US Section 232 steel tariff (25%), enabling suppliers to pass through mill surcharges and tariffs that compress margins on fixed-price contracts. Inventory buffers and hedging mitigate volatility but lock up working capital and increase carrying costs. Design optimization to reduce steel intensity can materially offset supplier pricing power.
Special molds and formwork dependencies
As of 2024, custom molds and formwork often come from niche providers, creating switching frictions that give suppliers outsized influence. Lead times frequently run 6–16 weeks, directly affecting project schedules and timing leverage. Investing in in-house mold-making reduces dependency but requires capex typically in the $200k–$1.5M range and specialized skills. Standardizing across product families can cut supplier spend and takt variability by up to 25–30%.
Logistics and lifting equipment constraints
Logistics and lifting equipment constraints create strong supplier power as specialized haulage, cranes and escort services are capacity-constrained in peak seasons, causing premium pricing and scheduling risk in 2024. Transport weight/size permits and route restrictions amplify delays and rerouting costs. Limited alternatives give niche logistics providers leverage; early booking and bundled volumes improve rates and reliability.
- Specialized haulage scarcity
- Permit and route risk
- Price power to niche providers
- Early booking helps
Energy and environmental inputs
Power, fuel and SCMs (fly ash, slag) exert elevated supplier power due to regional scarcity from coal‑plant retirements and constrained logistics; markets tightened in 2023–24 lifting SCM premiums in several regions. Carbon compliance (EU ETS ~€90/t in 2024) and decarbonization credits shift bargaining toward low‑carbon suppliers. On‑site efficiency and PPAs (corporate renewables volumes rising) cut exposure; EPD‑backed mixes increase dependence on specific low‑carbon suppliers.
- SCM scarcity: regional constraints
- EU ETS: ~€90/t (2024)
- PPAs: reduce market exposure
- EPD mixes: higher supplier reliance
Cost squeeze: China ~55% cement, EU ETS €90/t
Concentrated inputs (China ~55% cement production) and 2022–24 fuel volatility give suppliers pricing leverage and rapid cost transmission. Steel tariffs (US Section 232 ~25%) and commodity cycles enable pass-through; rebar/molds face 6–16 week lead times and mold capex $200k–$1.5M. Logistics scarcity, permits and EU ETS ~€90/t (2024) shift power toward niche and low‑carbon suppliers.
| Input | 2024 stat | Implication |
|---|---|---|
| Cement | China ~55% | High price leverage |
| Steel | Tariff ~25% | Pass-through risk |
| Molds | Lead 6–16w | Schedule risk |
| Carbon | EU ETS ~€90/t | Low‑carbon dependence |
What is included in the product
Detailed Word Document
Comprehensive Porter's Five Forces analysis tailored to F.P.E.E. Industries, uncovering competitive drivers, supplier and buyer power, substitutes, and entry threats that shape pricing and profitability; identifies disruptive forces and strategic barriers protecting incumbency. Delivered in fully editable Word format for use in investor materials, strategy decks, business plans, or academic projects.
Customizable Excel Spreadsheet
F.P.E.E. Industries Porter's Five Forces delivers a clean one-sheet summary and spider chart for instant strategic clarity, customizable pressure levels and labels for evolving markets, no macros so non-finance users can edit easily, and a deck-ready layout that integrates into reports or dashboards to relieve analysis bottlenecks.
Customers Bargaining Power
Large contractors aggregate demand
General contractors, developers and public agencies place sizable, project-based orders—EU public procurement alone accounted for about 14% of GDP in 2024—enabling tough negotiations and volume leverage. Competitive tendering intensifies price pressure and tighter payment terms. Prequalification and proven track records defend margins via non-price criteria. Value-added design-assist can shift selection away from lowest bid.
Design-in lowers switching
Design-in raises switching costs because once precast is engineered into a project, redesign and approvals commonly add 5–15% to contract value and can delay delivery weeks to months. Early engagement captures specifications and reduces buyer leverage by embedding requirements. Buyers still solicit alternate designs to induce price tension. Clear technical differentiation and documented performance sustain lock-in without excessive discounting.
Price transparency and benchmarks
Quality, safety, ESG requirements
Public and blue-chip buyers now routinely mandate certifications, EPDs, and strong safety records, narrowing the pool of qualified suppliers and accelerating gatekeeping; by 2024 the EU CSRD extends ESG reporting to roughly 50,000 companies, increasing buyer expectations. Compliance reduces buyer options and raises switching costs, while demonstrable superior ESG performance weakens buyer price pressure; non-compliance rapidly disqualifies vendors.
Payment terms and risk transfer
Buyers increasingly push retention (commonly 5–10% in US heavy-civil 2024), extended payment terms (30–90 days) and liquidated damages (often $1,000–$10,000/day on large infrastructure projects), shifting cash and performance risk; turnkey install obligations move interface risk onto the precaster. Milestone billing, backed by performance bonds (bond premiums ~0.5–3%), and strong project controls and claims management protect margins and mitigate cash strain.
- Retention: 5–10%
- Payment terms: 30–90 days
- Liquidated damages: $1,000–$10,000/day
- Bond premiums: 0.5–3%
- Mitigants: milestone billing, bonding, controls, claims management
Buyers use tenders to press prices; design-assist wins 3–7% premiums
Buyers exert strong project-level leverage via large, competitive tenders (EU public procurement ~14% of GDP in 2024), using benchmarking and 2024 material-index volatility up to 12% to press prices. Design-in, certifications and CSRD (~50,000 EU firms) raise switching costs, while buyers push retentions (5–10%), 30–90 day terms and liquidated damages ($1,000–$10,000/day). Value-added design-assist and guarantees (3–7% premium) and milestone billing mitigate buyer power.
| Metric | 2024 Value |
|---|---|
| EU public procurement | ~14% GDP |
| Material index volatility | up to 12% |
| Retention | 5–10% |
| Payment terms | 30–90 days |
| Liquidated damages | $1,000–$10,000/day |
| Bond premiums | 0.5–3% |
| CSRD coverage | ~50,000 firms |
| Price premium for guarantees | 3–7% |
Preview Before You Purchase
F.P.E.E. Industries Porter's Five Forces Analysis
The F.P.E.E. Industries Porter’s Five Forces analysis evaluates competitive rivalry, threat of new entrants, bargaining power of suppliers and buyers, and threat of substitutes, highlighting strategic threats and opportunities. It offers actionable insights and implications for pricing, margins, and entry barriers. This preview shows the exact document you'll receive—fully formatted and ready to download immediately after purchase.
Description
Don't Miss the Bigger Picture
F.P.E.E. Industries faces moderate supplier power, rising buyer sophistication, and growing substitute threats that are reshaping margins and strategic priorities. Competitive rivalry intensifies as new entrants leverage technology to erode differentiation, while regulatory shifts add external pressure. This brief snapshot only scratches the surface—unlock the full Porter's Five Forces Analysis to explore force-by-force ratings, visuals, and actionable strategy guidance.
Suppliers Bargaining Power
Concentrated cement and admixture sources
Core inputs like cement, admixtures and specialty aggregates come from a concentrated supplier base—China accounts for roughly 55% of global cement production (2023–24), giving key suppliers pricing leverage. Supply disruptions or energy price spikes transmit quickly to costs, as seen in 2022–24 volatility in fuel-driven production costs. Long-term contracts and dual-sourcing reduce outage risk but limit flexibility, while qualification of alternatives needs testing and certification, slowing switches.
Steel rebar and hardware volatility
Rebar, prestressing strands and embedded hardware are exposed to global commodity cycles and trade barriers, notably the US Section 232 steel tariff (25%), enabling suppliers to pass through mill surcharges and tariffs that compress margins on fixed-price contracts. Inventory buffers and hedging mitigate volatility but lock up working capital and increase carrying costs. Design optimization to reduce steel intensity can materially offset supplier pricing power.
Special molds and formwork dependencies
As of 2024, custom molds and formwork often come from niche providers, creating switching frictions that give suppliers outsized influence. Lead times frequently run 6–16 weeks, directly affecting project schedules and timing leverage. Investing in in-house mold-making reduces dependency but requires capex typically in the $200k–$1.5M range and specialized skills. Standardizing across product families can cut supplier spend and takt variability by up to 25–30%.
Logistics and lifting equipment constraints
Logistics and lifting equipment constraints create strong supplier power as specialized haulage, cranes and escort services are capacity-constrained in peak seasons, causing premium pricing and scheduling risk in 2024. Transport weight/size permits and route restrictions amplify delays and rerouting costs. Limited alternatives give niche logistics providers leverage; early booking and bundled volumes improve rates and reliability.
- Specialized haulage scarcity
- Permit and route risk
- Price power to niche providers
- Early booking helps
Energy and environmental inputs
Power, fuel and SCMs (fly ash, slag) exert elevated supplier power due to regional scarcity from coal‑plant retirements and constrained logistics; markets tightened in 2023–24 lifting SCM premiums in several regions. Carbon compliance (EU ETS ~€90/t in 2024) and decarbonization credits shift bargaining toward low‑carbon suppliers. On‑site efficiency and PPAs (corporate renewables volumes rising) cut exposure; EPD‑backed mixes increase dependence on specific low‑carbon suppliers.
- SCM scarcity: regional constraints
- EU ETS: ~€90/t (2024)
- PPAs: reduce market exposure
- EPD mixes: higher supplier reliance
Cost squeeze: China ~55% cement, EU ETS €90/t
Concentrated inputs (China ~55% cement production) and 2022–24 fuel volatility give suppliers pricing leverage and rapid cost transmission. Steel tariffs (US Section 232 ~25%) and commodity cycles enable pass-through; rebar/molds face 6–16 week lead times and mold capex $200k–$1.5M. Logistics scarcity, permits and EU ETS ~€90/t (2024) shift power toward niche and low‑carbon suppliers.
| Input | 2024 stat | Implication |
|---|---|---|
| Cement | China ~55% | High price leverage |
| Steel | Tariff ~25% | Pass-through risk |
| Molds | Lead 6–16w | Schedule risk |
| Carbon | EU ETS ~€90/t | Low‑carbon dependence |
What is included in the product
Detailed Word Document
Comprehensive Porter's Five Forces analysis tailored to F.P.E.E. Industries, uncovering competitive drivers, supplier and buyer power, substitutes, and entry threats that shape pricing and profitability; identifies disruptive forces and strategic barriers protecting incumbency. Delivered in fully editable Word format for use in investor materials, strategy decks, business plans, or academic projects.
Customizable Excel Spreadsheet
F.P.E.E. Industries Porter's Five Forces delivers a clean one-sheet summary and spider chart for instant strategic clarity, customizable pressure levels and labels for evolving markets, no macros so non-finance users can edit easily, and a deck-ready layout that integrates into reports or dashboards to relieve analysis bottlenecks.
Customers Bargaining Power
Large contractors aggregate demand
General contractors, developers and public agencies place sizable, project-based orders—EU public procurement alone accounted for about 14% of GDP in 2024—enabling tough negotiations and volume leverage. Competitive tendering intensifies price pressure and tighter payment terms. Prequalification and proven track records defend margins via non-price criteria. Value-added design-assist can shift selection away from lowest bid.
Design-in lowers switching
Design-in raises switching costs because once precast is engineered into a project, redesign and approvals commonly add 5–15% to contract value and can delay delivery weeks to months. Early engagement captures specifications and reduces buyer leverage by embedding requirements. Buyers still solicit alternate designs to induce price tension. Clear technical differentiation and documented performance sustain lock-in without excessive discounting.
Price transparency and benchmarks
Quality, safety, ESG requirements
Public and blue-chip buyers now routinely mandate certifications, EPDs, and strong safety records, narrowing the pool of qualified suppliers and accelerating gatekeeping; by 2024 the EU CSRD extends ESG reporting to roughly 50,000 companies, increasing buyer expectations. Compliance reduces buyer options and raises switching costs, while demonstrable superior ESG performance weakens buyer price pressure; non-compliance rapidly disqualifies vendors.
Payment terms and risk transfer
Buyers increasingly push retention (commonly 5–10% in US heavy-civil 2024), extended payment terms (30–90 days) and liquidated damages (often $1,000–$10,000/day on large infrastructure projects), shifting cash and performance risk; turnkey install obligations move interface risk onto the precaster. Milestone billing, backed by performance bonds (bond premiums ~0.5–3%), and strong project controls and claims management protect margins and mitigate cash strain.
- Retention: 5–10%
- Payment terms: 30–90 days
- Liquidated damages: $1,000–$10,000/day
- Bond premiums: 0.5–3%
- Mitigants: milestone billing, bonding, controls, claims management
Buyers use tenders to press prices; design-assist wins 3–7% premiums
Buyers exert strong project-level leverage via large, competitive tenders (EU public procurement ~14% of GDP in 2024), using benchmarking and 2024 material-index volatility up to 12% to press prices. Design-in, certifications and CSRD (~50,000 EU firms) raise switching costs, while buyers push retentions (5–10%), 30–90 day terms and liquidated damages ($1,000–$10,000/day). Value-added design-assist and guarantees (3–7% premium) and milestone billing mitigate buyer power.
| Metric | 2024 Value |
|---|---|
| EU public procurement | ~14% GDP |
| Material index volatility | up to 12% |
| Retention | 5–10% |
| Payment terms | 30–90 days |
| Liquidated damages | $1,000–$10,000/day |
| Bond premiums | 0.5–3% |
| CSRD coverage | ~50,000 firms |
| Price premium for guarantees | 3–7% |
Preview Before You Purchase
F.P.E.E. Industries Porter's Five Forces Analysis
The F.P.E.E. Industries Porter’s Five Forces analysis evaluates competitive rivalry, threat of new entrants, bargaining power of suppliers and buyers, and threat of substitutes, highlighting strategic threats and opportunities. It offers actionable insights and implications for pricing, margins, and entry barriers. This preview shows the exact document you'll receive—fully formatted and ready to download immediately after purchase.











