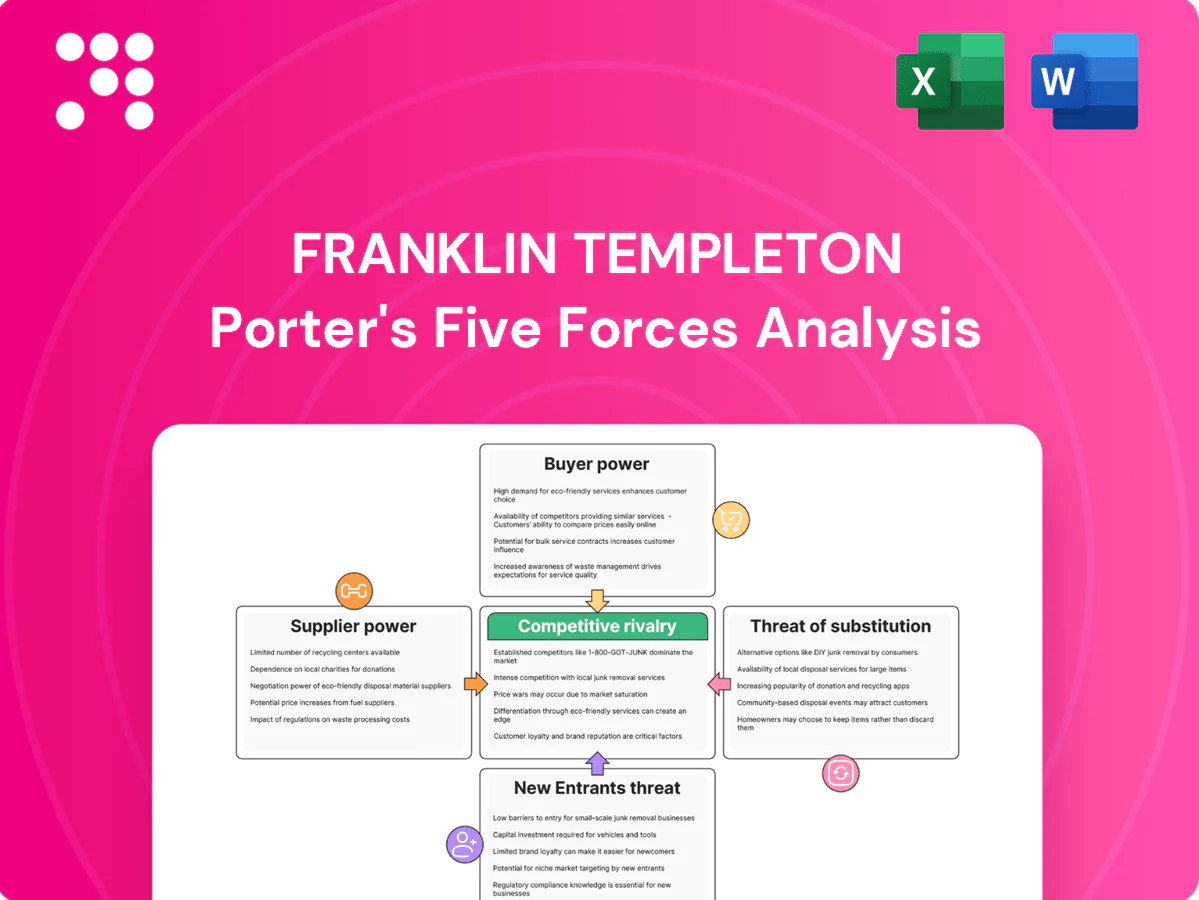
Franklin Templeton Porter's Five Forces Analysis

Go Beyond the Preview—Access the Full Strategic Report
Franklin Templeton’s Porter's Five Forces snapshot highlights industry rivalry, buyer/supplier leverage, entrant threats, and substitutes shaping its competitive edge. The concise view surfaces strategic pressure points and operational risks you need to watch. Unlock the full Porter's Five Forces Analysis to explore Franklin Templeton’s competitive dynamics, market pressures, and strategic advantages in detail.
Suppliers Bargaining Power

Dependence on star investment talent
Experienced portfolio managers and analysts are scarce and highly mobile, giving key investment talent leverage to demand higher pay and resources. Retention packages and carried-interest-like incentives can materially raise fixed compensation costs. Loss of star managers risks asset outflows and brand damage—Franklin Templeton managed about $1.53 trillion AUM as of Dec 31, 2023. Succession planning and team-based processes help dilute this supplier power.
Critical market data and analytics vendors
Essential market data, benchmarks and analytics for Franklin Templeton come from a concentrated set of providers—Bloomberg, LSEG (Refinitiv, acquired 2021) and S&P Global (IHS Markit closed 2022)—giving vendors outsized pricing power and higher switching costs.
Price escalators and bundled services can compress fund margins, while vendor consolidation raises dependency and operational risk; multi-sourcing and in‑house proprietary research are used to mitigate exposure.

Custody, fund admin, and transfer agents
Franklin Templeton relies on custody, fund administration and transfer agents dominated by global custodians holding >$30 trillion each while the firm manages roughly $1.5 trillion AUM (2024), giving suppliers scale advantages. Deep integration and regulatory constraints create high switching frictions, and outages or errors have triggered regulatory fines in the tens of millions and client trust loss. Strong SLAs, redundancy architectures and periodic re-tenders blunt supplier leverage and limit single-vendor risk.

Cloud, fintech, and trading infrastructure
Index licensors and benchmark providers
Popular indices require paid licenses, especially for ETFs and smart beta products, and by 2024 MSCI, S&P and FTSE remained the dominant benchmark providers, giving them pricing leverage that can compress product economics. Limited substitutability for flagship benchmarks raises supplier power, while developing proprietary indices is a proven offset to reduce licensing dependency.
- Index licensing common for ETFs/smart beta
- Flagship benchmarks = high supplier power
- Fees can compress margins
- Proprietary indices reduce reliance
Cloud, custodians and index providers concentrate supplier power over asset managers
Suppliers—from scarce portfolio talent to data, custody, cloud and index providers—wield significant leverage over Franklin Templeton, raising costs and switching frictions. Firm manages ~$1.5T AUM (2024), while top cloud providers hold ~66% market share and global custodians each hold >$30T, and MSCI/S&P/FTSE dominate index licensing. Multi-sourcing, in‑house research and proprietary indices partly mitigate supplier power.
| Supplier | Metric |
|---|---|
| AUM | $1.5T (2024) |
| Cloud | 66% market share (2024) |
| Custodians | >$30T each |
| Indices | MSCI/S&P/FTSE dominance |
What is included in the product
 Detailed Word Document
Uncovers key drivers of competition, customer influence, and market entry risks tailored exclusively for Franklin Templeton, identifying disruptive forces, substitutes, and supplier/buyer power that influence pricing, profitability, and barriers protecting incumbents.

 Customizable Excel Spreadsheet
A concise one-sheet Porter's Five Forces for Franklin Templeton that instantly highlights strategic pressures and relieves analysis bottlenecks—customizable for scenarios, ready for pitch decks or Excel dashboards, and simple enough for non-finance users (no macros required).
Customers Bargaining Power

Large institutional mandate leverage
Pensions (global pension assets ~57 trillion USD in 2024) and sovereign wealth funds (around 11 trillion USD in 2024) negotiate fees, mandates, and reporting rigorously, exerting strong leverage over managers like Franklin Templeton. Mandate concentration increases client bargaining power and revenue volatility when large mandates are reallocated. Performance shortfalls by managers can prompt rapid mandate reviews or redemptions. Tailored solutions and co-investments are used to defend and deepen relationships.
Retail via advisors and platforms
Intermediated retail flows hinge on model placements and platform approvals, with custodial gatekeepers overseeing over $15 trillion in US retail assets in 2024, giving them substantial leverage. Gatekeepers can demand revenue-sharing, fee cuts or marketing support, pressuring margins. Delistings or model reallocations can trigger rapid outflows—Franklin Templeton, with about $1.5 trillion AUM at end-2023, is exposed to such shifts. Strong wholesaling and practice-management support materially reduce this risk.

Fee transparency and benchmarking
Comparative tools spotlight net-of-fee performance, raising price sensitivity for Franklin Templeton, which managed about $1.5 trillion AUM in 2024; low-cost passive ETFs with expense ratios near 0.03–0.10% set a sharp low-cost anchor. Clients increasingly press for breakpoints and performance-fee structures to narrow net-of-fee gaps. Clear articulation of differentiated alpha is required to justify active pricing.

Low switching costs across funds
Demand for customization and ESG
Clients increasingly demand screens, impact metrics and bespoke reporting, shifting mandates toward customization and ESG and raising service burdens that can threaten fee and mandate retention if preferences are unmet.
- Clients request bespoke ESG screens and impact reporting
- Custom mandates expand scope and operational cost
- Non-compliance risks mandate loss
- Scalable data frameworks turn buyer power into partnership
Pensions ~57T & SWFs ~11T tighten fee leverage; custodial ~15T boosts buyer power
Pensions (~57 trillion USD global, 2024) and sovereign wealth funds (~11 trillion USD, 2024) exert strong fee and mandate leverage over Franklin Templeton (AUM ~1.6 trillion USD mid‑2024). Custodial gatekeepers control ~15 trillion USD US retail platforms, pressuring fees and placement. Low switching costs, passive ETFs (0.03–0.10% ER) and demand for bespoke ESG/reporting increase buyer power and customization costs.
| Metric | 2024 Value |
|---|---|
| Global pensions | ~57T USD |
| Sovereign wealth funds | ~11T USD |
| US custodial platforms | ~15T USD |
| Franklin Templeton AUM | ~1.6T USD |
| Passive ETF ER range | 0.03–0.10% |
Full Version Awaits
Franklin Templeton Porter's Five Forces Analysis
This preview shows the exact Franklin Templeton Porter's Five Forces analysis you'll receive immediately after purchase—no placeholders or sample pages. The document is the professionally formatted, complete analysis ready for download and immediate use. What you see here is precisely the deliverable you'll get upon payment.

Go Beyond the Preview—Access the Full Strategic Report
Franklin Templeton’s Porter's Five Forces snapshot highlights industry rivalry, buyer/supplier leverage, entrant threats, and substitutes shaping its competitive edge. The concise view surfaces strategic pressure points and operational risks you need to watch. Unlock the full Porter's Five Forces Analysis to explore Franklin Templeton’s competitive dynamics, market pressures, and strategic advantages in detail.
Suppliers Bargaining Power
Dependence on star investment talent
Experienced portfolio managers and analysts are scarce and highly mobile, giving key investment talent leverage to demand higher pay and resources. Retention packages and carried-interest-like incentives can materially raise fixed compensation costs. Loss of star managers risks asset outflows and brand damage—Franklin Templeton managed about $1.53 trillion AUM as of Dec 31, 2023. Succession planning and team-based processes help dilute this supplier power.
Critical market data and analytics vendors
Essential market data, benchmarks and analytics for Franklin Templeton come from a concentrated set of providers—Bloomberg, LSEG (Refinitiv, acquired 2021) and S&P Global (IHS Markit closed 2022)—giving vendors outsized pricing power and higher switching costs.
Price escalators and bundled services can compress fund margins, while vendor consolidation raises dependency and operational risk; multi-sourcing and in‑house proprietary research are used to mitigate exposure.
Custody, fund admin, and transfer agents
Franklin Templeton relies on custody, fund administration and transfer agents dominated by global custodians holding >$30 trillion each while the firm manages roughly $1.5 trillion AUM (2024), giving suppliers scale advantages. Deep integration and regulatory constraints create high switching frictions, and outages or errors have triggered regulatory fines in the tens of millions and client trust loss. Strong SLAs, redundancy architectures and periodic re-tenders blunt supplier leverage and limit single-vendor risk.
Cloud, fintech, and trading infrastructure
Index licensors and benchmark providers
Popular indices require paid licenses, especially for ETFs and smart beta products, and by 2024 MSCI, S&P and FTSE remained the dominant benchmark providers, giving them pricing leverage that can compress product economics. Limited substitutability for flagship benchmarks raises supplier power, while developing proprietary indices is a proven offset to reduce licensing dependency.
- Index licensing common for ETFs/smart beta
- Flagship benchmarks = high supplier power
- Fees can compress margins
- Proprietary indices reduce reliance
Cloud, custodians and index providers concentrate supplier power over asset managers
Suppliers—from scarce portfolio talent to data, custody, cloud and index providers—wield significant leverage over Franklin Templeton, raising costs and switching frictions. Firm manages ~$1.5T AUM (2024), while top cloud providers hold ~66% market share and global custodians each hold >$30T, and MSCI/S&P/FTSE dominate index licensing. Multi-sourcing, in‑house research and proprietary indices partly mitigate supplier power.
| Supplier | Metric |
|---|---|
| AUM | $1.5T (2024) |
| Cloud | 66% market share (2024) |
| Custodians | >$30T each |
| Indices | MSCI/S&P/FTSE dominance |
What is included in the product
Detailed Word Document
Uncovers key drivers of competition, customer influence, and market entry risks tailored exclusively for Franklin Templeton, identifying disruptive forces, substitutes, and supplier/buyer power that influence pricing, profitability, and barriers protecting incumbents.
Customizable Excel Spreadsheet
A concise one-sheet Porter's Five Forces for Franklin Templeton that instantly highlights strategic pressures and relieves analysis bottlenecks—customizable for scenarios, ready for pitch decks or Excel dashboards, and simple enough for non-finance users (no macros required).
Customers Bargaining Power
Large institutional mandate leverage
Pensions (global pension assets ~57 trillion USD in 2024) and sovereign wealth funds (around 11 trillion USD in 2024) negotiate fees, mandates, and reporting rigorously, exerting strong leverage over managers like Franklin Templeton. Mandate concentration increases client bargaining power and revenue volatility when large mandates are reallocated. Performance shortfalls by managers can prompt rapid mandate reviews or redemptions. Tailored solutions and co-investments are used to defend and deepen relationships.
Retail via advisors and platforms
Intermediated retail flows hinge on model placements and platform approvals, with custodial gatekeepers overseeing over $15 trillion in US retail assets in 2024, giving them substantial leverage. Gatekeepers can demand revenue-sharing, fee cuts or marketing support, pressuring margins. Delistings or model reallocations can trigger rapid outflows—Franklin Templeton, with about $1.5 trillion AUM at end-2023, is exposed to such shifts. Strong wholesaling and practice-management support materially reduce this risk.
Fee transparency and benchmarking
Comparative tools spotlight net-of-fee performance, raising price sensitivity for Franklin Templeton, which managed about $1.5 trillion AUM in 2024; low-cost passive ETFs with expense ratios near 0.03–0.10% set a sharp low-cost anchor. Clients increasingly press for breakpoints and performance-fee structures to narrow net-of-fee gaps. Clear articulation of differentiated alpha is required to justify active pricing.
Low switching costs across funds
Demand for customization and ESG
Clients increasingly demand screens, impact metrics and bespoke reporting, shifting mandates toward customization and ESG and raising service burdens that can threaten fee and mandate retention if preferences are unmet.
- Clients request bespoke ESG screens and impact reporting
- Custom mandates expand scope and operational cost
- Non-compliance risks mandate loss
- Scalable data frameworks turn buyer power into partnership
Pensions ~57T & SWFs ~11T tighten fee leverage; custodial ~15T boosts buyer power
Pensions (~57 trillion USD global, 2024) and sovereign wealth funds (~11 trillion USD, 2024) exert strong fee and mandate leverage over Franklin Templeton (AUM ~1.6 trillion USD mid‑2024). Custodial gatekeepers control ~15 trillion USD US retail platforms, pressuring fees and placement. Low switching costs, passive ETFs (0.03–0.10% ER) and demand for bespoke ESG/reporting increase buyer power and customization costs.
| Metric | 2024 Value |
|---|---|
| Global pensions | ~57T USD |
| Sovereign wealth funds | ~11T USD |
| US custodial platforms | ~15T USD |
| Franklin Templeton AUM | ~1.6T USD |
| Passive ETF ER range | 0.03–0.10% |
Full Version Awaits
Franklin Templeton Porter's Five Forces Analysis
This preview shows the exact Franklin Templeton Porter's Five Forces analysis you'll receive immediately after purchase—no placeholders or sample pages. The document is the professionally formatted, complete analysis ready for download and immediate use. What you see here is precisely the deliverable you'll get upon payment.
Original: $10.00
-65%$10.00
$3.50Description
Go Beyond the Preview—Access the Full Strategic Report
Franklin Templeton’s Porter's Five Forces snapshot highlights industry rivalry, buyer/supplier leverage, entrant threats, and substitutes shaping its competitive edge. The concise view surfaces strategic pressure points and operational risks you need to watch. Unlock the full Porter's Five Forces Analysis to explore Franklin Templeton’s competitive dynamics, market pressures, and strategic advantages in detail.
Suppliers Bargaining Power
Dependence on star investment talent
Experienced portfolio managers and analysts are scarce and highly mobile, giving key investment talent leverage to demand higher pay and resources. Retention packages and carried-interest-like incentives can materially raise fixed compensation costs. Loss of star managers risks asset outflows and brand damage—Franklin Templeton managed about $1.53 trillion AUM as of Dec 31, 2023. Succession planning and team-based processes help dilute this supplier power.
Critical market data and analytics vendors
Essential market data, benchmarks and analytics for Franklin Templeton come from a concentrated set of providers—Bloomberg, LSEG (Refinitiv, acquired 2021) and S&P Global (IHS Markit closed 2022)—giving vendors outsized pricing power and higher switching costs.
Price escalators and bundled services can compress fund margins, while vendor consolidation raises dependency and operational risk; multi-sourcing and in‑house proprietary research are used to mitigate exposure.
Custody, fund admin, and transfer agents
Franklin Templeton relies on custody, fund administration and transfer agents dominated by global custodians holding >$30 trillion each while the firm manages roughly $1.5 trillion AUM (2024), giving suppliers scale advantages. Deep integration and regulatory constraints create high switching frictions, and outages or errors have triggered regulatory fines in the tens of millions and client trust loss. Strong SLAs, redundancy architectures and periodic re-tenders blunt supplier leverage and limit single-vendor risk.
Cloud, fintech, and trading infrastructure
Index licensors and benchmark providers
Popular indices require paid licenses, especially for ETFs and smart beta products, and by 2024 MSCI, S&P and FTSE remained the dominant benchmark providers, giving them pricing leverage that can compress product economics. Limited substitutability for flagship benchmarks raises supplier power, while developing proprietary indices is a proven offset to reduce licensing dependency.
- Index licensing common for ETFs/smart beta
- Flagship benchmarks = high supplier power
- Fees can compress margins
- Proprietary indices reduce reliance
Cloud, custodians and index providers concentrate supplier power over asset managers
Suppliers—from scarce portfolio talent to data, custody, cloud and index providers—wield significant leverage over Franklin Templeton, raising costs and switching frictions. Firm manages ~$1.5T AUM (2024), while top cloud providers hold ~66% market share and global custodians each hold >$30T, and MSCI/S&P/FTSE dominate index licensing. Multi-sourcing, in‑house research and proprietary indices partly mitigate supplier power.
| Supplier | Metric |
|---|---|
| AUM | $1.5T (2024) |
| Cloud | 66% market share (2024) |
| Custodians | >$30T each |
| Indices | MSCI/S&P/FTSE dominance |
What is included in the product
Detailed Word Document
Uncovers key drivers of competition, customer influence, and market entry risks tailored exclusively for Franklin Templeton, identifying disruptive forces, substitutes, and supplier/buyer power that influence pricing, profitability, and barriers protecting incumbents.
Customizable Excel Spreadsheet
A concise one-sheet Porter's Five Forces for Franklin Templeton that instantly highlights strategic pressures and relieves analysis bottlenecks—customizable for scenarios, ready for pitch decks or Excel dashboards, and simple enough for non-finance users (no macros required).
Customers Bargaining Power
Large institutional mandate leverage
Pensions (global pension assets ~57 trillion USD in 2024) and sovereign wealth funds (around 11 trillion USD in 2024) negotiate fees, mandates, and reporting rigorously, exerting strong leverage over managers like Franklin Templeton. Mandate concentration increases client bargaining power and revenue volatility when large mandates are reallocated. Performance shortfalls by managers can prompt rapid mandate reviews or redemptions. Tailored solutions and co-investments are used to defend and deepen relationships.
Retail via advisors and platforms
Intermediated retail flows hinge on model placements and platform approvals, with custodial gatekeepers overseeing over $15 trillion in US retail assets in 2024, giving them substantial leverage. Gatekeepers can demand revenue-sharing, fee cuts or marketing support, pressuring margins. Delistings or model reallocations can trigger rapid outflows—Franklin Templeton, with about $1.5 trillion AUM at end-2023, is exposed to such shifts. Strong wholesaling and practice-management support materially reduce this risk.
Fee transparency and benchmarking
Comparative tools spotlight net-of-fee performance, raising price sensitivity for Franklin Templeton, which managed about $1.5 trillion AUM in 2024; low-cost passive ETFs with expense ratios near 0.03–0.10% set a sharp low-cost anchor. Clients increasingly press for breakpoints and performance-fee structures to narrow net-of-fee gaps. Clear articulation of differentiated alpha is required to justify active pricing.
Low switching costs across funds
Demand for customization and ESG
Clients increasingly demand screens, impact metrics and bespoke reporting, shifting mandates toward customization and ESG and raising service burdens that can threaten fee and mandate retention if preferences are unmet.
- Clients request bespoke ESG screens and impact reporting
- Custom mandates expand scope and operational cost
- Non-compliance risks mandate loss
- Scalable data frameworks turn buyer power into partnership
Pensions ~57T & SWFs ~11T tighten fee leverage; custodial ~15T boosts buyer power
Pensions (~57 trillion USD global, 2024) and sovereign wealth funds (~11 trillion USD, 2024) exert strong fee and mandate leverage over Franklin Templeton (AUM ~1.6 trillion USD mid‑2024). Custodial gatekeepers control ~15 trillion USD US retail platforms, pressuring fees and placement. Low switching costs, passive ETFs (0.03–0.10% ER) and demand for bespoke ESG/reporting increase buyer power and customization costs.
| Metric | 2024 Value |
|---|---|
| Global pensions | ~57T USD |
| Sovereign wealth funds | ~11T USD |
| US custodial platforms | ~15T USD |
| Franklin Templeton AUM | ~1.6T USD |
| Passive ETF ER range | 0.03–0.10% |
Full Version Awaits
Franklin Templeton Porter's Five Forces Analysis
This preview shows the exact Franklin Templeton Porter's Five Forces analysis you'll receive immediately after purchase—no placeholders or sample pages. The document is the professionally formatted, complete analysis ready for download and immediate use. What you see here is precisely the deliverable you'll get upon payment.











