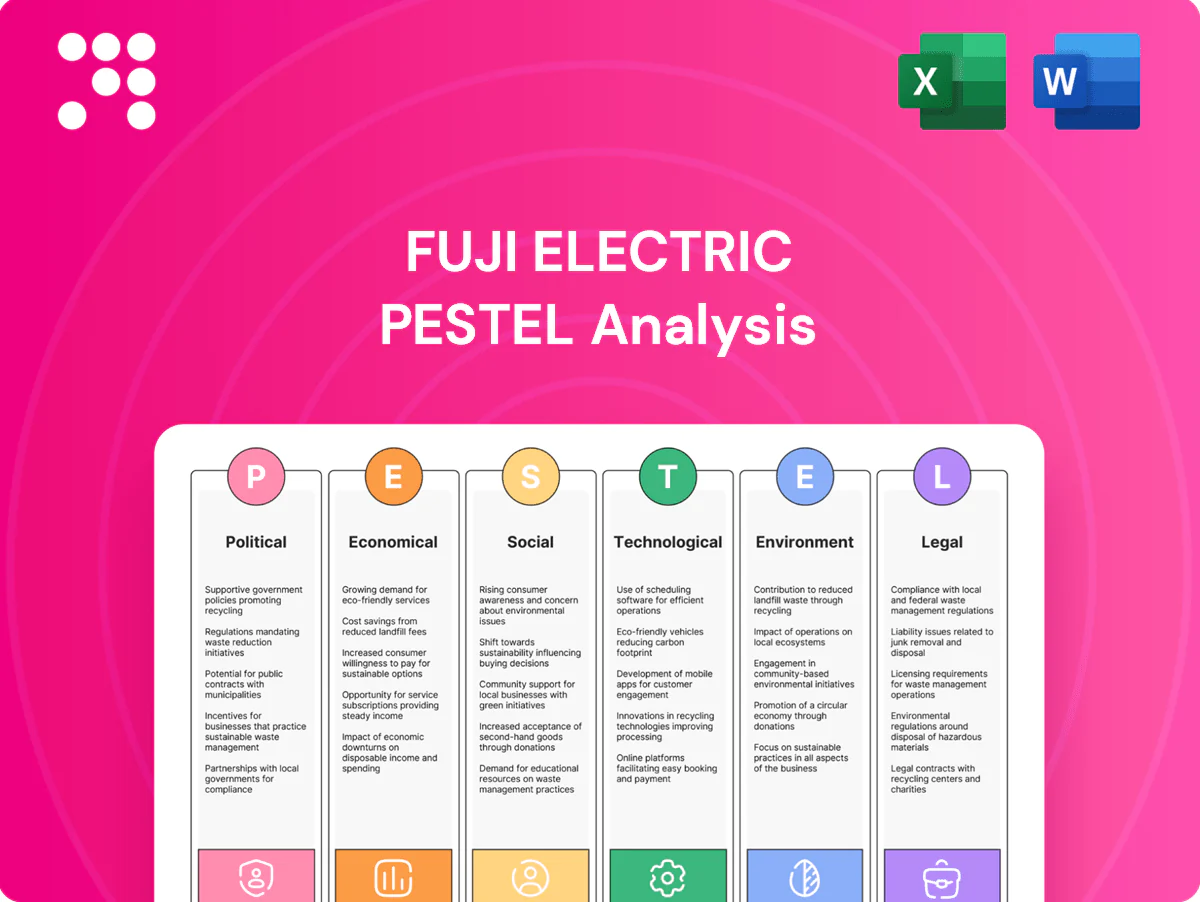
Fuji Electric PESTLE Analysis

Make Smarter Strategic Decisions with a Complete PESTEL View
Unlock how political shifts, economic cycles, and rapid technological advances are reshaping Fuji Electric’s strategic landscape in our concise PESTLE snapshot—ideal for investors and strategists seeking actionable foresight. This expert analysis highlights regulatory risks, market opportunities, and environmental pressures that could affect valuation and operations. Buy the full PESTLE report for a complete, downloadable breakdown you can use today.
Political factors

Industrial policy and subsidies
Government incentives—CHIPS Act ($52B), US Inflation Reduction Act (~$369B clean-energy tax credits), EU semiconductor and green-industrial packages and India’s PLI schemes (≈₹1.97 trillion across electronics)—are expanding demand for inverters, drives and power devices tied to electrification and decarbonization. Japan’s ≈¥2.2 trillion support for chips and supply chains and EU/US grants boost local manufacturing. Fuji Electric can tilt capex to incentive-rich geographies to cut costs and secure public projects. Sudden policy shifts or budget cuts, however, can delay orders and weaken ROI.
Trade tensions and export controls
US and allied export controls rolled out in 2022–2023 on advanced power semiconductors and industrial control systems restrict market access and complicate supply continuity for companies like Fuji Electric. Licensing processes routinely add weeks to months to shipment approvals and raise compliance costs. Fuji Electric must dual‑source and develop region‑specific variants to retain customers in infrastructure and transport. Further escalation could curtail sales into key segments worth billions globally (global power semiconductor market ≈ $29.9bn in 2023).

Infrastructure spending priorities
Public investment in rail, grids, water and smart cities is a primary demand driver for Fuji Electric’s power electronics and control systems, aligning with a global infrastructure need estimated at about $94 trillion to 2040 (Global Infrastructure Hub). National stimulus packages since 2020 have generated multi‑year order backlogs in the sector, while timing of appropriations and tender rules directly affect revenue recognition and cash flow. High project concentration raises exposure to political cycles and procurement changes.

Localization and procurement policies
Local content rules and Buy National provisions—commonly setting localization thresholds in the 30–60% range across major markets—drive factory siting and supplier selection for Fuji Electric, with large energy and transport tenders often exceeding $100m in capex; meeting those thresholds can unlock multimillion-dollar contracts, while JV structures and local engineering teams are frequently required to qualify.
- Localization thresholds: 30–60%
- Typical tender sizes: >$100m
- Qualification: JV/local engineering required
- Risk: disqualification and margin erosion from reconfiguration
Geopolitical supply security
Incentives boost inverter demand; export controls, localization and China rare-earth/copper risks
Government incentives (CHIPS $52B; US IRA ~$369B; Japan ≈¥2.2T; India PLI ≈₹1.97T) boost demand for inverters and power devices but sudden policy shifts can delay orders. Export controls on power semiconductors raise compliance costs and restrict market access. Localization rules (30–60%) and infrastructure spending drive siting; China controls 60–80% rare‑earth processing and LME copper ≈$9,500/t (2024), increasing input risk.
| Factor | Metric | Impact |
|---|---|---|
| Incentives | CHIPS $52B; IRA ~$369B | Higher demand, capex tilt |
| Export controls | 2022–23 measures | Compliance cost, access limits |
| Localization | 30–60% | Factory siting, JV needs |
| Raw materials | Rare earths 60–80% China; Cu ~$9,500/t | Price/availability risk |
What is included in the product
 Detailed Word Document
Explores how external macro-environmental factors uniquely affect Fuji Electric across Political, Economic, Social, Technological, Environmental and Legal dimensions; each section is data-backed, region- and industry-specific, and offers forward-looking insights to help executives, consultants and investors identify threats, opportunities and strategic responses.

 Customizable Excel Spreadsheet
Concise PESTLE summary of Fuji Electric that clarifies regulatory, technological and market risks for fast decision-making, easily dropped into presentations or shared across teams to streamline planning and mitigate external threats.
Economic factors

Capex cycles in industry
Capex cycles in factory automation and process industries are primary drivers of Fuji Electric’s inverter and control demand, with the global industrial automation market estimated at roughly USD 200–250 billion in 2024, supporting steady hardware orders. Slowdowns in electronics, autos or heavy industry materially reduce order intake, often causing quarterly dips. Diversification across sectors and aftermarket services smooths cyclicality, while long-cycle infrastructure projects provide durable revenue that offsets short-cycle volatility.
Currency volatility (JPY exposure)
Fuji Electric earns substantial global revenue while a portion of manufacturing and overheads remain yen‑denominated; yen weakness (around 155 JPY/USD in 2024) boosts export competitiveness but raises imported materials costs. Active FX hedging is essential to protect operating margins and cash flow. Pricing power differs by segment and contract length, with long‑term EPC contracts less able to pass on sudden cost inflation.

Interest rates and financing costs
Higher global policy rates — US Fed funds ~5.25–5.50% in 2024–25 while BOJ short-term rates remain near 0% — push up WACC and can delay customer capex and project awards. Tighter markets make public‑private infrastructure financing harder, prompting Fuji Electric to expand vendor financing to sustain bookings. Strong cash and a conservative debt/EBITDA profile support selective M&A and capacity add‑ins.

Input costs and supply chain
Prices for silicon wafers, copper (LME avg ~9,400 USD/ton in 2024), rare-earth magnets (up ~18% in 2024) and power modules (costs +≈8% Y/Y) pushed Fuji Electric COGS higher, while logistics constraints and component lead times of 12–24 weeks strained delivery commitments.
- Supplier diversification reduces input-price volatility
- Design-to-cost protects margins
- Inventory discipline: target 60–90 days to balance resilience and cash
Global growth dispersion
Stronger GDP growth in India (~6.5% 2025 IMF) and SEA (~4.5%) versus Europe (~1.0%) and Japan (~0.8%) shifts Fuji Electric sales mix toward high-growth corridors; global clean energy investment rose from $1.9T in 2023 to about $2.1T in 2024, underpinning structural demand despite cyclical dips. Local pricing and competitive intensity vary by region, so portfolio allocation should prioritize faster-growing markets to optimize returns.
- Prioritize India/SEA
- Hedge Europe/Japan exposure
- Leverage $2.1T energy transition tailwind
- Region-specific pricing strategy
Incentives boost inverter demand; export controls, localization and China rare-earth/copper risks
Capex cycles in automation (~USD 200–250bn market in 2024) drive inverter/control demand; diversification and aftermarket smooth cyclicality. Yen weakness (~155 JPY/USD in 2024–25) helps exports but raises imported COGS; active FX hedging required. Higher policy rates (Fed 5.25–5.50% 2024–25) and commodity inflation (copper ~9,400 USD/ton, energy invest $2.1T 2024) shape margins and regional focus.
| Metric | Value |
|---|---|
| Industrial automation 2024 | USD 200–250bn |
| Energy investment 2024 | USD 2.1T |
| JPY/USD | ~155 |
| Fed funds | 5.25–5.50% |
| Copper (2024 avg) | ~9,400 USD/t |
| India GDP 2025 (IMF) | ~6.5% |
Same Document Delivered
Fuji Electric PESTLE Analysis
The preview shown here is the exact Fuji Electric PESTLE Analysis document you’ll receive after purchase—fully formatted and ready to use. The layout, content, and structure visible here are exactly what you’ll download immediately after buying. No placeholders, no surprises.

Make Smarter Strategic Decisions with a Complete PESTEL View
Unlock how political shifts, economic cycles, and rapid technological advances are reshaping Fuji Electric’s strategic landscape in our concise PESTLE snapshot—ideal for investors and strategists seeking actionable foresight. This expert analysis highlights regulatory risks, market opportunities, and environmental pressures that could affect valuation and operations. Buy the full PESTLE report for a complete, downloadable breakdown you can use today.
Political factors
Industrial policy and subsidies
Government incentives—CHIPS Act ($52B), US Inflation Reduction Act (~$369B clean-energy tax credits), EU semiconductor and green-industrial packages and India’s PLI schemes (≈₹1.97 trillion across electronics)—are expanding demand for inverters, drives and power devices tied to electrification and decarbonization. Japan’s ≈¥2.2 trillion support for chips and supply chains and EU/US grants boost local manufacturing. Fuji Electric can tilt capex to incentive-rich geographies to cut costs and secure public projects. Sudden policy shifts or budget cuts, however, can delay orders and weaken ROI.
Trade tensions and export controls
US and allied export controls rolled out in 2022–2023 on advanced power semiconductors and industrial control systems restrict market access and complicate supply continuity for companies like Fuji Electric. Licensing processes routinely add weeks to months to shipment approvals and raise compliance costs. Fuji Electric must dual‑source and develop region‑specific variants to retain customers in infrastructure and transport. Further escalation could curtail sales into key segments worth billions globally (global power semiconductor market ≈ $29.9bn in 2023).
Infrastructure spending priorities
Public investment in rail, grids, water and smart cities is a primary demand driver for Fuji Electric’s power electronics and control systems, aligning with a global infrastructure need estimated at about $94 trillion to 2040 (Global Infrastructure Hub). National stimulus packages since 2020 have generated multi‑year order backlogs in the sector, while timing of appropriations and tender rules directly affect revenue recognition and cash flow. High project concentration raises exposure to political cycles and procurement changes.
Localization and procurement policies
Local content rules and Buy National provisions—commonly setting localization thresholds in the 30–60% range across major markets—drive factory siting and supplier selection for Fuji Electric, with large energy and transport tenders often exceeding $100m in capex; meeting those thresholds can unlock multimillion-dollar contracts, while JV structures and local engineering teams are frequently required to qualify.
- Localization thresholds: 30–60%
- Typical tender sizes: >$100m
- Qualification: JV/local engineering required
- Risk: disqualification and margin erosion from reconfiguration
Geopolitical supply security
Incentives boost inverter demand; export controls, localization and China rare-earth/copper risks
Government incentives (CHIPS $52B; US IRA ~$369B; Japan ≈¥2.2T; India PLI ≈₹1.97T) boost demand for inverters and power devices but sudden policy shifts can delay orders. Export controls on power semiconductors raise compliance costs and restrict market access. Localization rules (30–60%) and infrastructure spending drive siting; China controls 60–80% rare‑earth processing and LME copper ≈$9,500/t (2024), increasing input risk.
| Factor | Metric | Impact |
|---|---|---|
| Incentives | CHIPS $52B; IRA ~$369B | Higher demand, capex tilt |
| Export controls | 2022–23 measures | Compliance cost, access limits |
| Localization | 30–60% | Factory siting, JV needs |
| Raw materials | Rare earths 60–80% China; Cu ~$9,500/t | Price/availability risk |
What is included in the product
Detailed Word Document
Explores how external macro-environmental factors uniquely affect Fuji Electric across Political, Economic, Social, Technological, Environmental and Legal dimensions; each section is data-backed, region- and industry-specific, and offers forward-looking insights to help executives, consultants and investors identify threats, opportunities and strategic responses.
Customizable Excel Spreadsheet
Concise PESTLE summary of Fuji Electric that clarifies regulatory, technological and market risks for fast decision-making, easily dropped into presentations or shared across teams to streamline planning and mitigate external threats.
Economic factors
Capex cycles in industry
Capex cycles in factory automation and process industries are primary drivers of Fuji Electric’s inverter and control demand, with the global industrial automation market estimated at roughly USD 200–250 billion in 2024, supporting steady hardware orders. Slowdowns in electronics, autos or heavy industry materially reduce order intake, often causing quarterly dips. Diversification across sectors and aftermarket services smooths cyclicality, while long-cycle infrastructure projects provide durable revenue that offsets short-cycle volatility.
Currency volatility (JPY exposure)
Fuji Electric earns substantial global revenue while a portion of manufacturing and overheads remain yen‑denominated; yen weakness (around 155 JPY/USD in 2024) boosts export competitiveness but raises imported materials costs. Active FX hedging is essential to protect operating margins and cash flow. Pricing power differs by segment and contract length, with long‑term EPC contracts less able to pass on sudden cost inflation.
Interest rates and financing costs
Higher global policy rates — US Fed funds ~5.25–5.50% in 2024–25 while BOJ short-term rates remain near 0% — push up WACC and can delay customer capex and project awards. Tighter markets make public‑private infrastructure financing harder, prompting Fuji Electric to expand vendor financing to sustain bookings. Strong cash and a conservative debt/EBITDA profile support selective M&A and capacity add‑ins.
Input costs and supply chain
Prices for silicon wafers, copper (LME avg ~9,400 USD/ton in 2024), rare-earth magnets (up ~18% in 2024) and power modules (costs +≈8% Y/Y) pushed Fuji Electric COGS higher, while logistics constraints and component lead times of 12–24 weeks strained delivery commitments.
- Supplier diversification reduces input-price volatility
- Design-to-cost protects margins
- Inventory discipline: target 60–90 days to balance resilience and cash
Global growth dispersion
Stronger GDP growth in India (~6.5% 2025 IMF) and SEA (~4.5%) versus Europe (~1.0%) and Japan (~0.8%) shifts Fuji Electric sales mix toward high-growth corridors; global clean energy investment rose from $1.9T in 2023 to about $2.1T in 2024, underpinning structural demand despite cyclical dips. Local pricing and competitive intensity vary by region, so portfolio allocation should prioritize faster-growing markets to optimize returns.
- Prioritize India/SEA
- Hedge Europe/Japan exposure
- Leverage $2.1T energy transition tailwind
- Region-specific pricing strategy
Incentives boost inverter demand; export controls, localization and China rare-earth/copper risks
Capex cycles in automation (~USD 200–250bn market in 2024) drive inverter/control demand; diversification and aftermarket smooth cyclicality. Yen weakness (~155 JPY/USD in 2024–25) helps exports but raises imported COGS; active FX hedging required. Higher policy rates (Fed 5.25–5.50% 2024–25) and commodity inflation (copper ~9,400 USD/ton, energy invest $2.1T 2024) shape margins and regional focus.
| Metric | Value |
|---|---|
| Industrial automation 2024 | USD 200–250bn |
| Energy investment 2024 | USD 2.1T |
| JPY/USD | ~155 |
| Fed funds | 5.25–5.50% |
| Copper (2024 avg) | ~9,400 USD/t |
| India GDP 2025 (IMF) | ~6.5% |
Same Document Delivered
Fuji Electric PESTLE Analysis
The preview shown here is the exact Fuji Electric PESTLE Analysis document you’ll receive after purchase—fully formatted and ready to use. The layout, content, and structure visible here are exactly what you’ll download immediately after buying. No placeholders, no surprises.
Original: $10.00
-65%$10.00
$3.50Description
Make Smarter Strategic Decisions with a Complete PESTEL View
Unlock how political shifts, economic cycles, and rapid technological advances are reshaping Fuji Electric’s strategic landscape in our concise PESTLE snapshot—ideal for investors and strategists seeking actionable foresight. This expert analysis highlights regulatory risks, market opportunities, and environmental pressures that could affect valuation and operations. Buy the full PESTLE report for a complete, downloadable breakdown you can use today.
Political factors
Industrial policy and subsidies
Government incentives—CHIPS Act ($52B), US Inflation Reduction Act (~$369B clean-energy tax credits), EU semiconductor and green-industrial packages and India’s PLI schemes (≈₹1.97 trillion across electronics)—are expanding demand for inverters, drives and power devices tied to electrification and decarbonization. Japan’s ≈¥2.2 trillion support for chips and supply chains and EU/US grants boost local manufacturing. Fuji Electric can tilt capex to incentive-rich geographies to cut costs and secure public projects. Sudden policy shifts or budget cuts, however, can delay orders and weaken ROI.
Trade tensions and export controls
US and allied export controls rolled out in 2022–2023 on advanced power semiconductors and industrial control systems restrict market access and complicate supply continuity for companies like Fuji Electric. Licensing processes routinely add weeks to months to shipment approvals and raise compliance costs. Fuji Electric must dual‑source and develop region‑specific variants to retain customers in infrastructure and transport. Further escalation could curtail sales into key segments worth billions globally (global power semiconductor market ≈ $29.9bn in 2023).
Infrastructure spending priorities
Public investment in rail, grids, water and smart cities is a primary demand driver for Fuji Electric’s power electronics and control systems, aligning with a global infrastructure need estimated at about $94 trillion to 2040 (Global Infrastructure Hub). National stimulus packages since 2020 have generated multi‑year order backlogs in the sector, while timing of appropriations and tender rules directly affect revenue recognition and cash flow. High project concentration raises exposure to political cycles and procurement changes.
Localization and procurement policies
Local content rules and Buy National provisions—commonly setting localization thresholds in the 30–60% range across major markets—drive factory siting and supplier selection for Fuji Electric, with large energy and transport tenders often exceeding $100m in capex; meeting those thresholds can unlock multimillion-dollar contracts, while JV structures and local engineering teams are frequently required to qualify.
- Localization thresholds: 30–60%
- Typical tender sizes: >$100m
- Qualification: JV/local engineering required
- Risk: disqualification and margin erosion from reconfiguration
Geopolitical supply security
Incentives boost inverter demand; export controls, localization and China rare-earth/copper risks
Government incentives (CHIPS $52B; US IRA ~$369B; Japan ≈¥2.2T; India PLI ≈₹1.97T) boost demand for inverters and power devices but sudden policy shifts can delay orders. Export controls on power semiconductors raise compliance costs and restrict market access. Localization rules (30–60%) and infrastructure spending drive siting; China controls 60–80% rare‑earth processing and LME copper ≈$9,500/t (2024), increasing input risk.
| Factor | Metric | Impact |
|---|---|---|
| Incentives | CHIPS $52B; IRA ~$369B | Higher demand, capex tilt |
| Export controls | 2022–23 measures | Compliance cost, access limits |
| Localization | 30–60% | Factory siting, JV needs |
| Raw materials | Rare earths 60–80% China; Cu ~$9,500/t | Price/availability risk |
What is included in the product
Detailed Word Document
Explores how external macro-environmental factors uniquely affect Fuji Electric across Political, Economic, Social, Technological, Environmental and Legal dimensions; each section is data-backed, region- and industry-specific, and offers forward-looking insights to help executives, consultants and investors identify threats, opportunities and strategic responses.
Customizable Excel Spreadsheet
Concise PESTLE summary of Fuji Electric that clarifies regulatory, technological and market risks for fast decision-making, easily dropped into presentations or shared across teams to streamline planning and mitigate external threats.
Economic factors
Capex cycles in industry
Capex cycles in factory automation and process industries are primary drivers of Fuji Electric’s inverter and control demand, with the global industrial automation market estimated at roughly USD 200–250 billion in 2024, supporting steady hardware orders. Slowdowns in electronics, autos or heavy industry materially reduce order intake, often causing quarterly dips. Diversification across sectors and aftermarket services smooths cyclicality, while long-cycle infrastructure projects provide durable revenue that offsets short-cycle volatility.
Currency volatility (JPY exposure)
Fuji Electric earns substantial global revenue while a portion of manufacturing and overheads remain yen‑denominated; yen weakness (around 155 JPY/USD in 2024) boosts export competitiveness but raises imported materials costs. Active FX hedging is essential to protect operating margins and cash flow. Pricing power differs by segment and contract length, with long‑term EPC contracts less able to pass on sudden cost inflation.
Interest rates and financing costs
Higher global policy rates — US Fed funds ~5.25–5.50% in 2024–25 while BOJ short-term rates remain near 0% — push up WACC and can delay customer capex and project awards. Tighter markets make public‑private infrastructure financing harder, prompting Fuji Electric to expand vendor financing to sustain bookings. Strong cash and a conservative debt/EBITDA profile support selective M&A and capacity add‑ins.
Input costs and supply chain
Prices for silicon wafers, copper (LME avg ~9,400 USD/ton in 2024), rare-earth magnets (up ~18% in 2024) and power modules (costs +≈8% Y/Y) pushed Fuji Electric COGS higher, while logistics constraints and component lead times of 12–24 weeks strained delivery commitments.
- Supplier diversification reduces input-price volatility
- Design-to-cost protects margins
- Inventory discipline: target 60–90 days to balance resilience and cash
Global growth dispersion
Stronger GDP growth in India (~6.5% 2025 IMF) and SEA (~4.5%) versus Europe (~1.0%) and Japan (~0.8%) shifts Fuji Electric sales mix toward high-growth corridors; global clean energy investment rose from $1.9T in 2023 to about $2.1T in 2024, underpinning structural demand despite cyclical dips. Local pricing and competitive intensity vary by region, so portfolio allocation should prioritize faster-growing markets to optimize returns.
- Prioritize India/SEA
- Hedge Europe/Japan exposure
- Leverage $2.1T energy transition tailwind
- Region-specific pricing strategy
Incentives boost inverter demand; export controls, localization and China rare-earth/copper risks
Capex cycles in automation (~USD 200–250bn market in 2024) drive inverter/control demand; diversification and aftermarket smooth cyclicality. Yen weakness (~155 JPY/USD in 2024–25) helps exports but raises imported COGS; active FX hedging required. Higher policy rates (Fed 5.25–5.50% 2024–25) and commodity inflation (copper ~9,400 USD/ton, energy invest $2.1T 2024) shape margins and regional focus.
| Metric | Value |
|---|---|
| Industrial automation 2024 | USD 200–250bn |
| Energy investment 2024 | USD 2.1T |
| JPY/USD | ~155 |
| Fed funds | 5.25–5.50% |
| Copper (2024 avg) | ~9,400 USD/t |
| India GDP 2025 (IMF) | ~6.5% |
Same Document Delivered
Fuji Electric PESTLE Analysis
The preview shown here is the exact Fuji Electric PESTLE Analysis document you’ll receive after purchase—fully formatted and ready to use. The layout, content, and structure visible here are exactly what you’ll download immediately after buying. No placeholders, no surprises.











